

Measuring page speed by debugging a slow website is important.
All Chrome browsers have built-in tools to help troubleshoot why a page is slow and not performing as well as it could.
The great thing about browsers based on Chrome and Firefox is that they can be extended with tools that make troubleshooting sites fast and easy.
Both Chrome and Firefox support browser add-ons.
Firefox calls them add-ons and in the Chrome ecosystem, they’re called extensions.
Browser extensions and add-ons extend the functionality of browsers in ways that are custom to a user’s need.
Why Use A Page Speed Browser Extension
A browser-based debugger like Chrome Dev Tools is a collection of tools, like a toolbox.
If you want just one tool, you are out of luck because the browser offers the entire collection all at once.
That means a publisher needs to first learn how to navigate through all the different menus, tabs, and screens, many of which offer tools that aren’t necessarily the overview you may want.
And that’s why extensions are a valid alternative to using the built-in troubleshooting tools in a browser.
You can simply choose the exact tool you want and skip the learning curve in order to get the metrics you really need at the moment you need them.
Google Lighthouse Extension For Chrome And Firefox
Lighthouse is a great tool for obtaining an easy-to-understand overview of webpage performance with the option to dig deeper into diagnostic feedback and advice for making a webpage faster.
There’s a standalone Google Lighthouse webpage, but you have to copy the URL of the page you want data for then navigate to the Lighthouse tool.
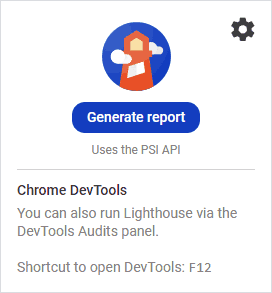
With the Lighthouse extension, the full power of the tool is available with the click of a button.
All you do is click the extension icon and then the blue Generate Report button.
The Lighthouse extension will spawn a new browser tab and generate the full Lighthouse report.
The new webpage will display a wait screen while Lighthouse is generating the report.

The top of the Lighthouse page has the numerical scores for the webpage.

And, if you scroll down, you can see the in-depth data that help diagnose and fix problems.
All you have to do is follow the links for more information about what a problem is and suggestions for how to fix those problems.

Google has developed versions of Lighthouse for both Chrome and Firefox.
Page Load Time Browser Extension
The Page Load Time browser extension for Chrome and also for Firefox provides a highly accurate page load metric because it uses the Navigation Timing API, which is described on the Mozilla developer page for the Navigation Time API.
The browser extension has been installed over 100,000 times and has been rated 258 times.
Once installed, all you have to do is visit a page and look at the Page Load Time icon on the top right corner of the browser.
The icon automatically reports how long it took to download the webpage.
Clicking the icon shows more details about a wide range of factors that tell a more complete story about why the page downloaded as fast or as slow as it did.
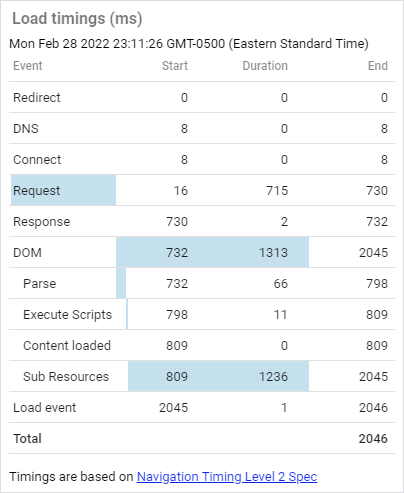
As you can see in the above illustration, the Page Load Time Browser extension reveals an astounding amount of information organized in an easy-to-understand format.
The detailed report shows delays caused by a redirect, the response time for DNS, and connection time.
The report also calculates the response time from the beginning of the request for the webpage and the time that elapses until completion.
There are precise measurements for when scripts are executed, content is loaded, and how long the page took to finally load.
It’s an extraordinary amount of information displayed in an easy-to-understand manner.
Here’s the Page Load Time Extension for Chrome and Load Timer Add-on for Firefox.
Performance-Analyser
The Performance-Analyser Extension for Chrome Browser is like the Page Load Time Browser Extension only it goes further in what it covers.
It uses the Resource, Navigation, and User Timing APIs
This extension generates colorful pie charts to provide a visual representation of various metrics such as requests by domain and provides the navigation timing API information in a convenient waterfall chart that visualizes the render time.
According to the description:
“Performance-Analyser (aka Performance-Analyzer) helps to analyze the current page through the Resource, Navigation and User Timing APIs – see requests by type, domain, load times, marks and more – instantly.”
Page Size Inspector
The Page Size Inspector Extension for Chrome is especially useful because it provides a snapshot of a variety of metrics, including how many requests were made for fonts and what the uncompressed size of that download is.
What makes this extension stand out is the easy to understand interface plus the size in bytes for the following webpage resources:
- HTML
- JS
- CSS
- Images
- Ajax
- Fonts
The Chrome browser extension also provides times in seconds for download for a quick and handy overview of page speed metrics at your fingertips right there on the page.
Checkbot: SEO, Web Speed & Security Tester
This extension aggregates multiple tools related to SEO.
What’s of interest with this extension is that it provides data that can help to better understand why a webpage takes as long as it does to download.
The plugin reports on the following variables:
- File Minification.
- Network compression information.
- File Caching.
- Render blocking CSS and JavaScript.
- Duplicate CSS and JavaScript.
- Excessive inlined CSS and JavaScript.
- Redirects and also chained redirects.
All of the above data points are super useful for understanding possible issues that need fixing.
As a bonus, the Chrome Checkbot: SEO, Web Speed & Security Tester extension also offers various SEO-related data, and one of my favorites is the security headers data which can tell you if a site is insecure because of missing security headers.
Page Speed Browser Extensions
Page speed browser extensions are extremely useful for publishers and developers.
They can help you quickly identify problems right at the moment without having to open up another webpage and then paste a URL on another website.
Page speed diagnostics can be done right there while you’re on the site, automatically or with the click of a button.
More Resources:
- 13 Best Chrome Extensions for Digital Marketing and SEO
- How to Improve Site Performance: 4 Speed Audit Quick Wins
- Core Web Vitals: A Complete Guide
Featured Image: StudioByTheSea/Shutterstock
