

It’s no secret that site speed is important for SEO.
Not only is it used as a ranking factor by Google, but it’s also imperative for providing a good experience for users from the second they land on your site.
A slow website and poor performance will impact user experience and accessibility, as well as affect a business’s growth and, ultimately, revenue.
In fact, organizations that have invested efforts into speed improvements have seen an increase in website traffic, better engagement, and an uplift in conversions.
Pinterest is one example of this where, after implementing a performance budget, they saw an uplift in both user sentiment and engagement, which translated into a 44% increase in revenue.
A Blueprint for Performance Optimization
With all of this in mind, Paul Irish and Elizabeth Sweeny from the Google Chrome Web Platform shared a useful blueprint they have created to assess and optimize site performance, at the 2019 Google I/O event.
While this was primarily focused on development teams, there are some key tasks that are useful for SEO professionals, which I have explored further in this post.
Working on these areas will provide an opportunity for you to work more closely with your development team toward one common goal:
Providing the best experience possible for your users.
Here’s how to do it.
1. Gain an Understanding of the Key Metrics
The first step is to understand the key metrics which are used by Google when measuring a website’s page speed.
Fortunately for us, Google is open about these metrics and have detailed them clearly on a dedicated section of their development site.
The current metrics used by Google are:
- First Contentful Paint (FCP)
- Largest Contentful Paint (LCP)
- First Input Delay (FID)
- Time to Interactive (TTI)
- Total Blocking Time (TBT)
- Cumulative Layout Shift (CLS)
Each of these metrics has different weights, which impact the overall performance score provided.
A number of these metrics have been used by Google for several years, however, they have recently introduced some newer ones, which have become increasingly important:
Largest Contentful Paint (LCP)
This user-centric metric displays the render time of the largest element that is visible in the viewport.
Total Blocking Time (TBT)
TBT measures the load responsiveness of a website and quantifies the non-interactivity of a page before it is usable.
Cumulative Layout Shift (CLS)
Another user-centric metric, CLS measures the visual stability of the page by quantifying how often users experience unexpected layout shifts.
2. Measure the Quality of User Experience
This step involves measuring the performance impact for real users on your site, so it is important to prioritize the metrics that matter most.
Google has put together a useful matrix that can help you to think about the user’s expectations and the metrics associated with them.
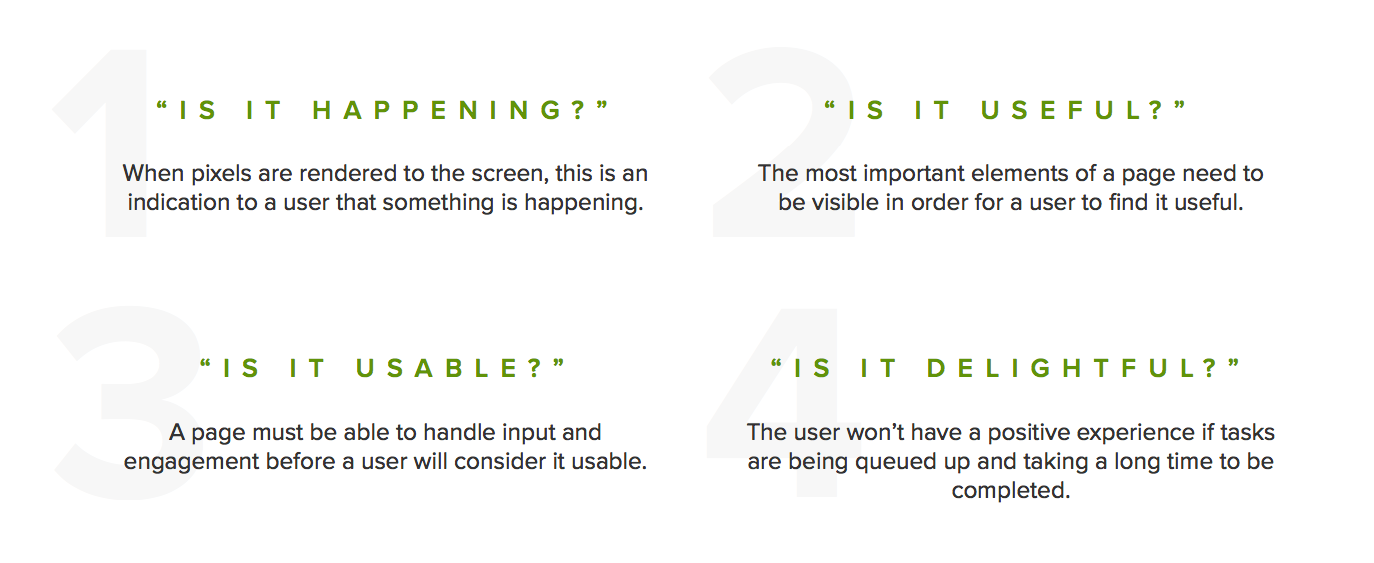
Using this matrix to analyze the most impactful performance metrics, from those listed above, is helpful when it comes to prioritizing optimization work.
3. Gain an Overview of Your Page Speed
The next step is to review your site’s performance. When working with large sites, it’s always best to pick a selection of key pages to perform this analysis on.
This could be pages that drive a significant amount of revenue or receive a lot of traffic.
Also, if your site has templates for key pages, you can analyze a number of these in order to understand a base level of performance across the site.
Performing Page Speed Tests
There are several tools which allow you to perform page speed tests, a number of these are free and are great starting points for gaining key insights into a website’s performance.
Google’s Pagespeed Insights
This free tool from Google utilizes a combination of lab data from Lighthouse and field data from the Chrome User Experience report in order to analyze the content of a webpage and provide recommendations for improvement.

It allows you to test both the mobile and desktop experience and displays a score out of 100, based on the metrics we spoke about above.
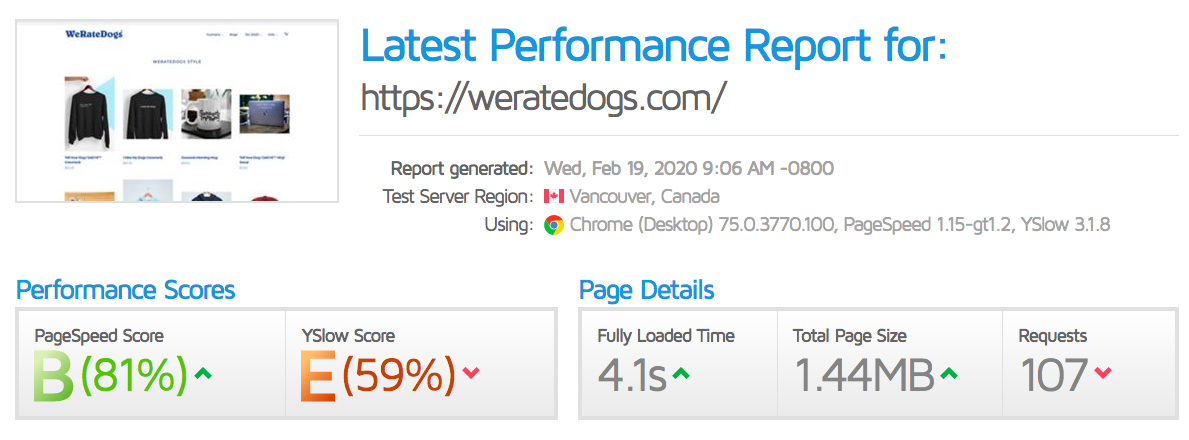
GTMetrix
GTMetrix is another free tool that provides a speed metric breakdown along with optimization opportunities.
Another useful feature is the ability to customize tests based on location, device and browser types, so this can be used to mimic different browsing environments.
Use a Web Crawler
While the tools above are useful for analyzing on a page-per-page basis, if you wanted to perform measurement at scale, as well as see visual trends, utilizing a crawling tool is very beneficial.
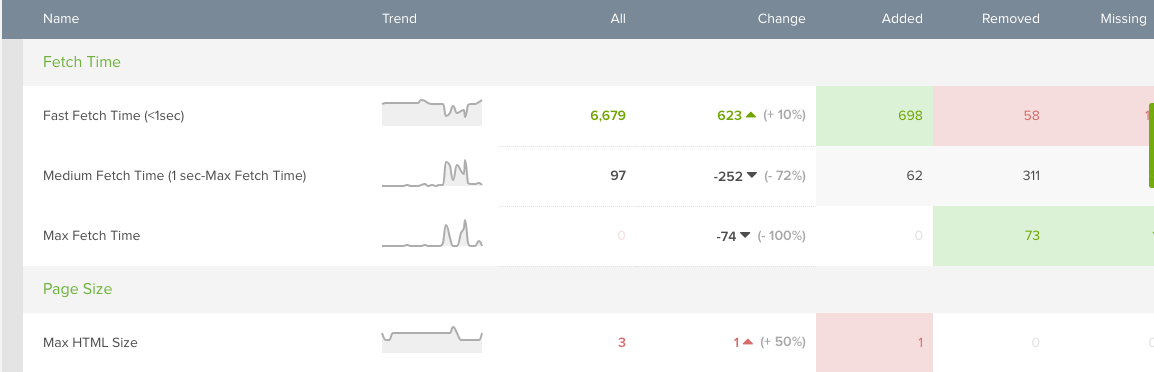
For example, by using DeepCrawl’s custom JavaScript feature you will be able to extract a number of key metrics from Chrome. (Disclosure: I work at DeepCrawl.)
Not only does this enable you to gather useful insights at scale, you will also be able to see a visual trend of site speed over time.
4. Discover Specific Aspects Affecting Page Load
There are a number of factors that may be affecting your page speed. Some of the main culprits include:
- JavaScript-heavy resources.
- Large image file size.
- Having a large number of redirect chains.
Using Chrome Dev Tools will enable you to discover any specific aspects on a page which are affecting load time.
The most useful report for this sits under the Coverage tab and allows you to run a recording to test the load of a specific page.
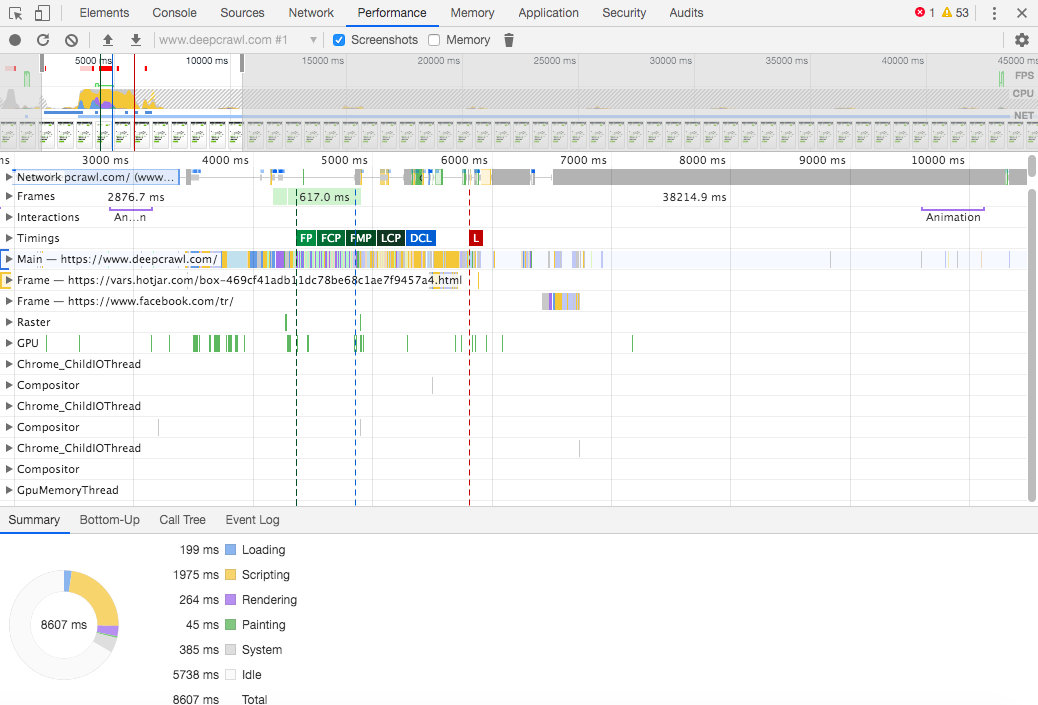
Not only does this allow you to review which resources have an impact on user experience, but you will also be able to understand the time taken for the loading, rendering, and painting of different aspects of the page.
This will allow you to pinpoint specific problem areas that are affecting the load speed.
5. Set Specific KPIs to Track
It’s important to remember that every website is unique, with specific challenges and individual success metrics.
These will differ depending on the main goal of the website, and the KPIs will be dependent on these goals.
For example, an ecommerce client I once worked with was looking to increase sales from organic traffic, so set a KPI to “increase sales from organic users by 10% in the next 6 months.”
Other KPIs may be based on increasing organic sessions, generating or converting more leads as well as decreasing a page’s bounce rate.
Page speed will directly impact these KPIs, as a fast site will be rewarded by Google and provide a better user experience.
6. Implement the Recommended Changes
This step involves implementing the recommended changes provided by the tests you have performed in the previous steps.
Common optimization recommendations include:
- Implement caching to reduce the size of the initial request.
- Serve images in next-generation formats.
- Compress and minify HTML, CSS, and JavaScript.
- Eliminate render-blocking resources.
This is where you will need to work with your development team, both to gain an understanding of what is possible on the site and to get the changes implemented.
There are a number of terms you can ask your developers about, which can help you to better understand how the website works, Rachel Costello provided a useful list of these terms in her recent talk on the future of technical SEO.

7. Mitigate the Performance Impact of Third-Party Tags
It’s also important to review the third-party tags on your site and the impact they are having on your website’s performance. You may be surprised by the results you see here.
There are a number of tools that can provide visual summaries of the number of requests, load time and run-time costs of different third-party tags.
For example, Request Map displays a map of the tags on a page and allows you to choose the test location to run the analysis from.
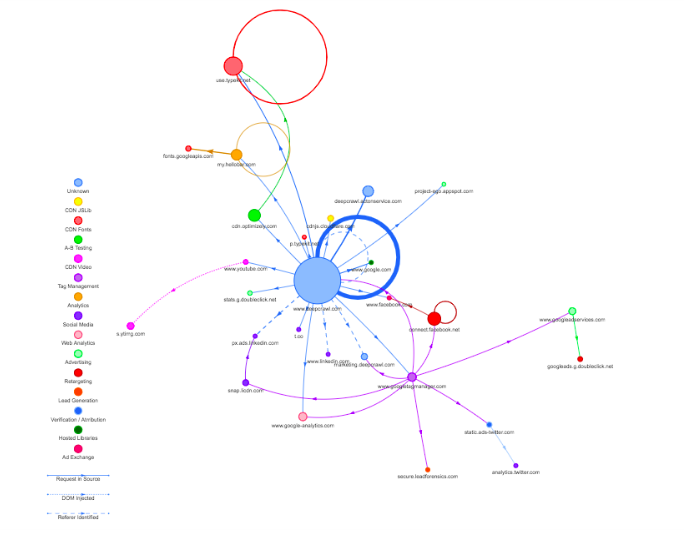
As well as Third-Party Web, which allows you to identify the tags causing the biggest performance impact.
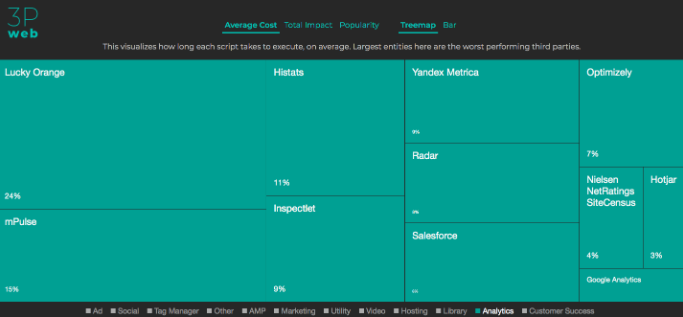
Once you have an understanding of the impact of these, you can review the unnecessary tags and work to remove them.
8. Track the Metrics Over Time
In order to ensure the changes you have implemented are providing the positive impact you are working towards, it’s important to track them over time, both to view the improvements and to identify any regressions.
There are many ways to review how performance has evolved, including:
- Using custom-made dashboards that incorporate data from Google’s Page Speed Insights tool.
- The Chrome User Experience Report.
9. Compare & Monitor Performance Against Others in Your Industry
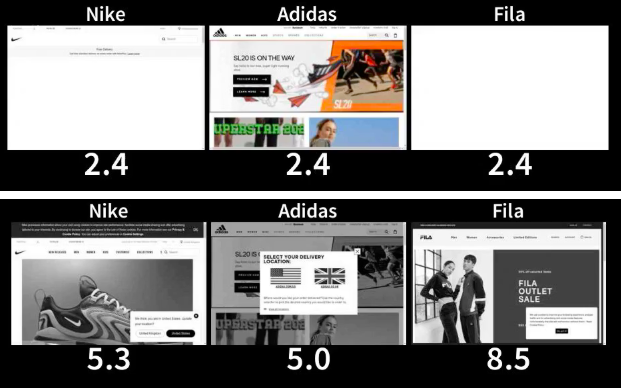
Undertaking competitor analysis is important in most SEO tasks, including performance optimization, in order to gain an understanding of how similar websites in your industry are performing and how you compare to them.
Using Web Page Test’s Visual Comparison you can input both your website and your competitors’ sites to compare the loading experience and see where you match up.
10. Measure the Correlation Between Performance & Revenue
The final step in this list is one of the most valuable things you can do: connect the real user metrics you have collected above to your actual business goals.
This will enable you to collect ROI data and prove the business value of the improvements you have been undertaking.
One way of performing this is by selecting important representative pages to monitor in order to understand how the page speed data over time affects the business KPIs set for these pages.
For example, you could measure this set of pages for site speed changes and correlate the results with user or conversion date from Google Analytics.
Automating Performance Testing & Monitoring
Performing site speed analysis can be a time-consuming task, especially if you have a large URL set to review.
Therefore, in order to efficiently track improvements over time, adopting an automated approach to testing can be very beneficial.
There are several ways you can automate page speed testing, including:
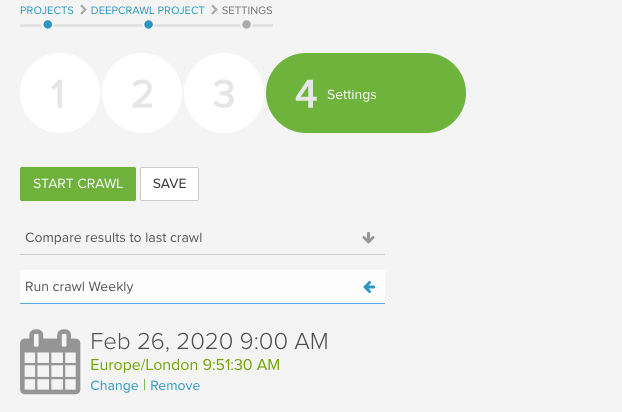
Using a Crawler
As mentioned above, you can use a website crawling tool to run regular crawls and monitor site speed over time.
It is typically possible to automate these reports by setting crawls to run weekly, fortnightly or monthly and receive notifications when they are ready to review.
Google Search Console
Google also introduced the speed report to Google Search Console last year, which enables you to see an aggregated view of your site’s key speed field metrics using data from the Chrome User Experience Report.
There is also the ability to drill down into specific issues and find examples of groups of pages that need improvement.
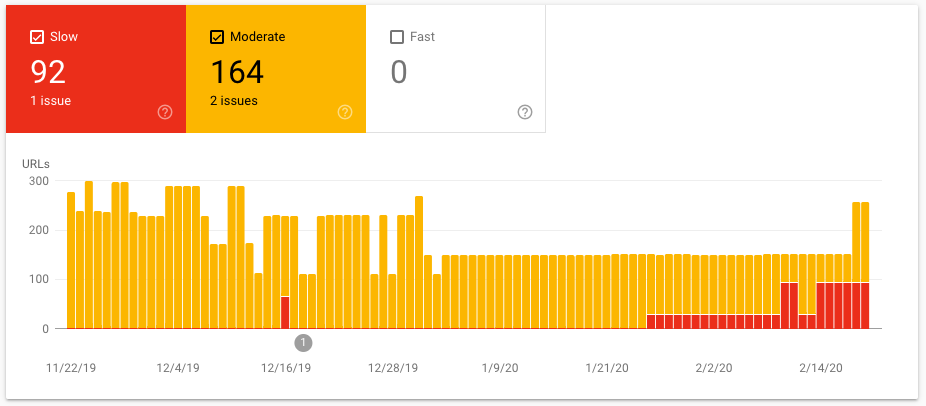
Most importantly, you will be able to monitor the speed over time and review if there are any improvements based on the work you have been implementing, as well as spot any regressions.
Running Lightspeed Tests in the Command Line
It is also possible to run Lighthouse reports via your command line. The benefit of this is that you can have it running in the background and can generate results in a number of formats.
In order to do this, you need to have Google Chrome and node.js (a JavaScript runtime environment) installed on your computer. From here we will use the NPM package to install Lighthouse on the command line;
sudo npm install -g lighthouse
Once this has been installed, you will be able to run lighthouse tests straight from your command line, using the command;
lighthouse {your url}
This will open a browser window and perform the usual lighthouse tests automatically for you. You will also be able to define the output format and even run the command headless, so as to not interrupt your workflow.
For example, I would run the analysis as follows;
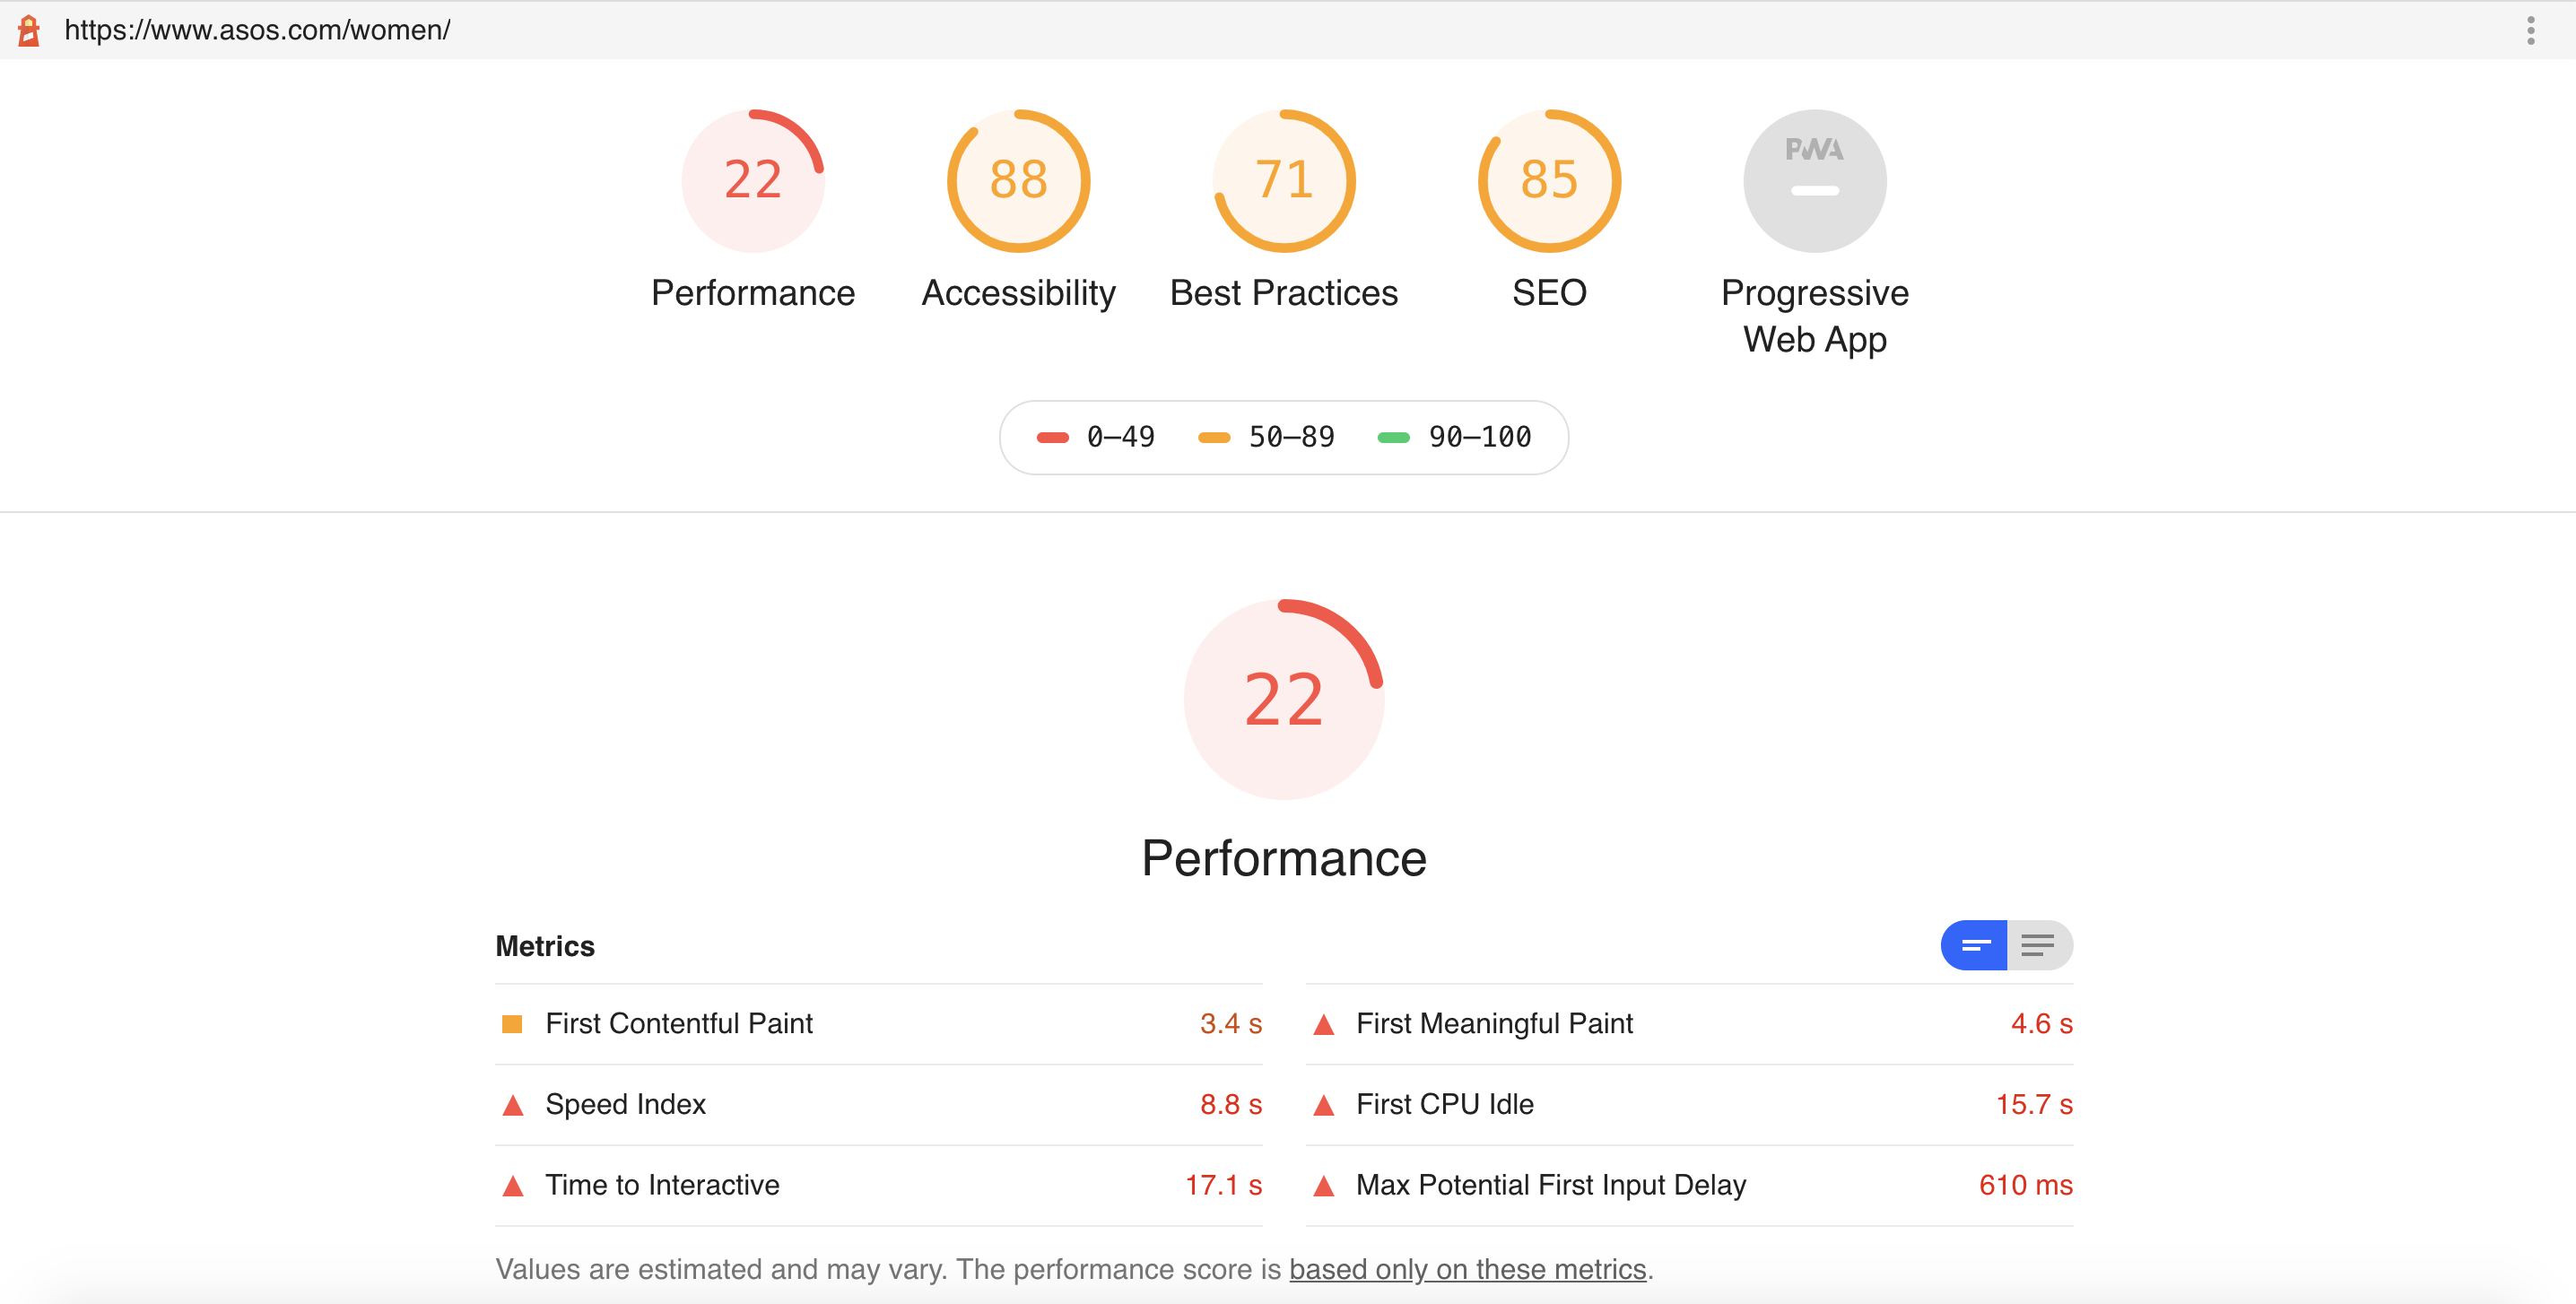
lighthouse https://www.asos.com/women/ --quiet --chrome-flags=”headless” --view

This will run the test using headless Chrome and open the output in an HTML file once it has finished, as well as save it to my computer.
You can find more advanced options in the Github repository here, along with the full instructions for installing and running it.
This is also a great way to get started with utilizing the command line to run analysis and was a great help for me to get more comfortable with using it.
To Sum Up
The need for a fast, performant website isn’t going away.
There is a big opportunity for us, as SEO professionals, to work together with our development teams to provide the best experience possible for both site visitors and search engine crawlers.
By performing the 10-step process outlined above, we will be able to provide a lot of value to the conversations around site optimization, but it is also important to understand what is possible for specific websites.
For example, due to their setup, some websites have certain limitations that will not allow them to be optimized for speed in some of the ways recommended by page speed tests.
Along with this, working with developers to review if you can implement user-centric strategies, such as graceful degradation and progressive enhancement, will help with further optimization activities.
In addition, performing speed analysis no longer needs to be a manual task.
There are several tools available to automate these tests, in order to provide efficiency and allow you to focus your time on ensuring your site is as user-friendly as possible.
More Resources:
- How to Improve Page Speed for More Traffic & Conversions
- User-Centric Optimization: 3 Ways to Improve Your Website Experience
- A Technical SEO Guide to Lighthouse Performance Metrics
Image Credits
In-Post Image: DeepCrawl
All screenshots taken by author, March 2020
