
Peter Drucker once said, “If you can’t measure it, you can’t improve it.”
Without data, it is impossible to show what effect your SEO strategies are having.
Tracking performance and progress makes analytics invaluable to marketers.
According to HubSpot, 61% of respondents say generating traffic and leads is their most significant marketing challenge.
When the C-suite isn’t getting the leads they expect, they start questioning if your work is valuable. That is where data becomes crucial to digital marketers.
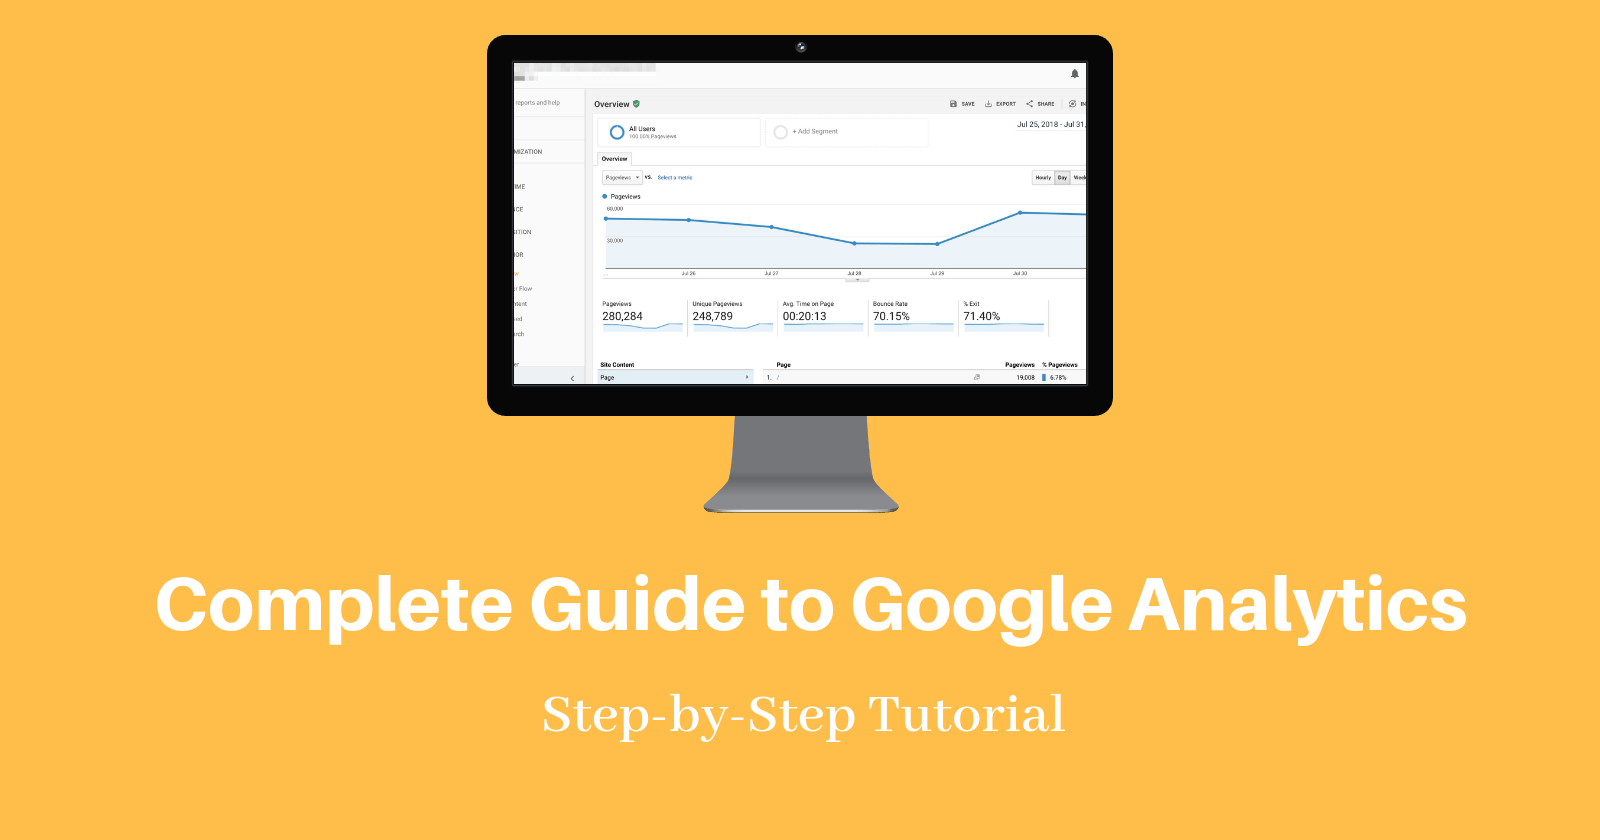
This guide is an overview of Google Analytics, the most robust free analytics platform available, and how SEO pros and marketers can use it to their advantage.
How Can Google Analytics Help My SEO?
Google Analytics provides access to a massive amount of data related to how users find and interact with your site.
For example, you can see how many people visited a specific page, how long they remained there, where your users live, how certain keywords perform, and so forth.
Google Analytics can be integrated on your website through code or through their WordPress plugin, Site Kit.
This information is vital in determining how effective your awesome SEO strategies are – and to uncover areas you can make improvements.

What You’ll Learn About Google Analytics
Now that you know why Google Analytics is essential to SEO, let’s talk about what you will learn in this guide.
This article is broken up into five sections based on the reports in Google Analytics.
Reports:
Then, we will cover how to set up your Google Analytics dashboard and how to do a basic audit of your Google Analytics to see if your account is up to par.
Real-Time

This report offers real-time data about who is on your site and what they are doing.
Did you publish an awesome post and want to see how many people are reading it? Or do you want to find out if users are watching the video you just uploaded?
With real-time, you can.
To access data as it happens, click “Real-Time” in the left sidebar of your Google Analytics dashboard.
In most cases, real-time shows actions that have occurred on your site in the last five minutes. A few real-time reports will allow you to view data in the last 30 minutes.
Let’s look at the different real-time reports.
Locations
Do they live in a different time zone or even speak a different language than you?
In this report, you can see where your current users are located, what page they are on, and how long they have been there.
Traffic Sources
Traffic Sources tells you how users found your site.
Did they click a link on Facebook? Type your URL in directly?
This section can be extremely useful in real-time if you want to see how much traffic a new social post is generating or see how a brand-spanking-new landing page is performing.
Content
This section provides insight into where users are landing on your site and how long they are staying there.
You can see the page title, URL, and the percent of active users on a specific page.
Events
In real-time, events allow you to track customizable interactions users have with your site.
This might include ad clicks, white paper downloads, or video views.
You can further customize data by viewing “Events (Last 30 min)” to see events in the past half hour or click an event category to see activity specific to that category.
Conversions
For every strategy you implement, someone is going to want to know “But did it increase conversions?”
This report gives you that data in real time.
View the top goals, how many users completed that goal, and the percentage of users who completed that goal – all in real-time or in the last 30 minutes.
Audience

Audience reports group users together based on set parameters.
Want to know how many people performed a site search? Or how many people made a purchase in the last year, but haven’t made a purchase in the last two weeks?
All this information can be yours.
You can use this info to better target specific sections of your audience.
There are two crucial features to keep in mind:
- You have to define the audiences you want to track.
- Google rolled out an Audience report that allows you to see how your audiences are responding to remarketing campaigns.
Active Users
This section of the audience report lets you track users who have visited your site in the last 1, 7, 14, or 30 days.
This information helps you measure audience interest.
For example, if you have a high number of 1-day active users but see a drastic decrease at 7, 14, and 30, this might indicate a disconnect with your audience.
Lifetime Value
Are you wondering if the leads you gained through an email campaign are valuable? Trying to decide if it is worth it to spend more resources on social media?
The Lifetime Value report calculates the long-term value of users acquired through a variety of methods including social, direct, organic, and referrals.
You can then sort each acquisition audience and see average goal completions, pageviews, revenue, and so forth.
Cohort Analysis
A cohort is a group of users bound by a shared characteristic, for example, users acquired on a specific day.
This report allows you to analyze a variety of data about cohorts.
For example, you could define a cohort as the day you launched a new course. You could then view data about users who responded to your launch – where they live, if they used a tablet, if they made a purchase, and so on.
Audiences
An audience report inside an audience report? Yes, you read that right!
This section allows you to create more granular audiences and apply them to other sections of your analytics report.
You can create and apply up to 20 audiences at a time.
User Explorer
This report analyzes the behavior of specific users, rather than providing a broad overview of user behavior, the way you do in the cohort analysis, for example.
How can you use this data?
Aggregated data is important if, for example, you want to understand how users in Denver responded to a recent initiative.
User-specific data provides insight into what led a specific user to make a much larger than average purchase or what actions a user took before abandoning their cart.
For each user, view data such as average session duration, bounce rate, revenue, and goal conversion rate.
Demographics
This section allows you to view detailed information about the age and gender of your users.
For example, you can see the average session time of women between the ages of 25-34 during a specific period.
You can use this information to better tailor content, ads, and other marketing efforts.
You can also create segments based on these categories and create remarketing audiences.
Interests
Want to target users who love technology? Or who love East Asian cooking?
This section of Google Analytics makes it possible.
To get started, you will need to enable remarketing and advertising reporting features.
Once enabled, you can view data on users based on:
- Affinity categories: Broad lifestyle categories, such as “Food and Dining Enthusiasts” or “Value Shoppers.”
- In-Market Segments: Product-related interests such as “Travel/Hotel Accommodations” or “Baby & Children’s Products.”
- Other Categories: More specific categories such as “Hair Care” or “Pets/Dogs.”
This information is particularly useful for remarketing campaigns.
Geo
The Geo report provides information about the location and language of your users.
You can use this information to better inform new initiatives or look for new opportunities.
Behavior
This report can help you determine if new users are returning to your site to engage with your content.
View data based on three sub-categories: New vs Returning, Frequency & Recency, and Engagement.
You can leverage this data to report whether, for example, a new buyer’s guide is encouraging users to return, indicating they are moving through the buying cycle.
Technology
This report lets you learn more about how users are viewing your site, including which browser and OS they use and what network they use to connect to the internet.
Mobile
This report allows you to view whether users view your site with a tablet, desktop, or mobile device, as well as what specific devices, such as an Apple iPad, Samsung SM-G950 Galaxy S8, or Samsung SM-T800 Galaxy Tab S 10.5.
You can use this information to determine if their site is optimized for the specific devices they users are using – and make changes accordingly.
This is particularly important as Google has started the switch to mobile-first indexing.
Custom
This area of Google Analytics lets you better define and compare user segments.
For example, compare the bounce rate of mobile users to those who make a purchase, or see how much of your organic traffic are new users.
Sort data by Custom Variables or User Defined.
This data allows you to view extremely detailed, customizable information about how your audience interacts with your site.
Benchmarking
This section allows you to compare your data to aggregated data from others in your industry.
Compare yourself to the rest of your industry based on subcategories, such as Channels, Location, and Devices.
You can use this data to find missed opportunities.
Users Flow
What do your users do once they get to your site?
This report provides a visual representation of how users move through your site and can be sorted by user type.
For example, you can see where users from New York start and where they drop off in your buyer’s cycle.
This granular data can show where specific users leave your site so you can make adjustments.
Acquisition

The Acquisition Report provides detailed data on how your audience finds your site, what they do once they get there, and if they completed specific actions, such as filling out a form.
Spoiler alert: Google announced that Image Search reports will soon be added to the acquisition reports in Google Analytics.
All Traffic
The All Traffic section shows which sites send you the most traffic.
You can then view data about the actions those users take, including Bounce Rate, Pages per Visit, Goal Completions, and so forth.
The data can be broken down into subcategories including Channels and Source/Medium.
If you keep digging into the Source/Medium, Google Analytics will tell you how much traffic you’re driving from image search as well.
Tip: You can use this information to assign a dollar value to your organic traffic by comparing how much a keyword you rank for organically would cost in a Google Ads Campaign.
Google Ads
If you are investing in Google Ads, this data is vital to understanding how you are performing.
First, link your Google Ads and Google Analytics accounts.
Then, you can view data about:
- Campaigns.
- Keywords.
- Search queries
- The hour of the day.
- Final URLs.
Search Console
This report is a powerhouse if you want to understand how your site performs in organic search.
First, though, you need to connect Google Search Console with Google Analytics. This article walks you through the process.
Once connected, you’ll have access to a ton of data and the ability to sort based on subcategories such as Landing Pages, Countries, Devices, and Queries.
You can use this to prioritize your work.
For example, find pieces of content that rank well but have a low click-through rate.
With a few tweaks, that content could drive a ton of traffic. This article gives some great examples of how to use the data.
Social
The Social tab shows how people are interacting with your content on social media.
Sort by:
- Network Referrals.
- Landing Pages.
- Conversions.
- Plugins.
- Users Flow.
Use this info to identify platforms where your audience is already interacting with your content, measure how social is impacting site behavior, and more.
Campaigns
The Campaigns report shows how paid campaigns are performing and how they compare to other initiatives.
Sort data by:
- All Campaigns.
- Paid Keywords.
- Organic Keywords.
- Cost Analysis.
You can even compare metrics for non-Google campaigns if you upload the cost data.
Behavior

The Behavior Reports provides data about the actions users take on your site, including using site search, the content they view, how fast pages load, and so forth.
This information can help uncover areas where your site is not performing as intended.
Behavior Flow
This report shows the path users take on your site.
For example, did people who read your in-depth post about winterizing their swimming pool then make a purchase?
To use this report, you must set up and track Events.
Site Content
Site Content offers in-depth data including if users were on mobile, if they made a purchase, if the traffic was organic, and so forth.
This data helps you determine if a specific piece of content is performing well.
If you’re a content marketer, this Google Analytics report is the motherlode. I use this report to discover what blog titles are performing the best.
To find the best performing titles, follow these steps:
- Go to Google Analytics > Behavior > Site Content > All Pages.
- Click Page Title as your Primary Dimension.
- Voila! You have your top performing page titles.
If you want to learn more, I created this step-by-step video on how to find the top performing pages in Google Analytics.
The same thing goes if you’re looking to refresh your content, I walk you through how to find that content worthy of refreshing in Google Analytics here.
Site Speed
The Site Speed report shows how fast content loads and can be sorted by traffic source, showing, for example, if mobile customers experience a higher load time.
To get the most out of this report, I highly suggest building custom reports, like this one from LunaMetrics that shows which browsers slow download time.
Site Search
This report shows how site visitors use the search function on your site.
With this information, you can locate key terms you should be optimizing for or find holes in your content.
This is another area where custom reports are helpful.
This report, created by John Ekman, shows conversion rates for users who use site search.
Events
Google Analytics defines an event as “user interactions with content that can be tracked independently from web page or a screen load.”
Events include downloads of a PDF, views of a video, form submissions, and so forth.
Sort this report by:
- Top events.
- Pages.
- Events flow.
One minor limitation of Events in Google Analytics is you can only have 500 unique event names per device and browser.
Publisher
The Publisher Report gives you access to data about how your site is monetized, including impressions and clicks.
This report requires a connection with AdSense or Ad Exchange.
Then, you can view info on Publisher Pages and Publisher Referrers.
Experiments
The Experiments function lets you test variations of your site – for example does your new welcome message convert better than your old one?
This feature is being replaced by Google Optimize, which appears to be a more robust platform.
Conversions

This section of Google Analytics is all about completed actions.
How many people registered for your email list? How many users made a purchase?
The answers to these questions provide tons of information about the health of your business and the success of your SEO efforts.
Goals
Goals are actions you want to track.
This report gives granular info about user actions based on the goals you create.
You can set both micro and macro goals to understand what activities contribute to larger actions.
For example, did reading a news article on your site contribute to purchasing a new computer chair?
First, create a Goal, then you can view the data based on:
- The Goal URL.
- Reverse Goal Path.
- Funnel Visualization.
- Goal Flow.
If you’re still uncertain about how to set-up a goal in Google Analytics, I created this video tutorial for you:
Josh McCoy shares more advanced tips on setting up goals in Google Analytics in this article.
Ecommerce
The Ecommerce report can be sorted by:
- Product.
- Sales.
- Transaction.
- Times to Purchase.
You must add the ecommerce code snippet to your site in order to access this data.
Multi-Channel Funnels
With so many ways to communicate with your audience, it can be hard to tell what is actually working.
This report digs into how different channels feed into your funnel.
First, add the ecommerce snippet to your site. Then you can track:
- Assisted Conversions.
- Top Conversion Paths.
- Path Length.
I like to use the multi-channel funnels assisted conversions report is useful for ecommerce brands tracking social media conversions.
Corey Morris dives deeper into how to track social media conversions in Google Analytics.

Attribution
Attribution refers to the rules used to assign credit to points on the conversion path.
For example, did a buyer read your email, then download a whitepaper, then make a purchase?
The attribution model you choose determines how the credit for the conversion is split between the email and white paper.
The Model Comparison Tool allows you to compare how different models assign credit.
How to Set Up Your Google Analytics Admin Dashboard
Several reports above require you to connect different platforms or adding snippets.
Many of the customizations will depend on the type of business you run, but I highly recommend these settings for most site owners.
1. Property Settings
First, make sure you’ve enabled those specialty reports.
Sign into Google Analytics, then navigate to Admin > Property Settings. Then check the following:
- Is the URL correct?
- Enable Demographics and Interest Reports > ON
- Use enhanced link attribution > ON
- Enable Users Metric in Reporting > ON
- Is Google Ads linked and is PPC data populating?
- Is Google Search Console linked correctly?

2. View Settings
Now, let’s check some of the basic settings.
Navigate to Admin > View Settings.
Now, check the following:
- Ecommerce Tracking > ON
- Site Search Tracking > ON (make sure to set your search query parameters)
- Verify URL is correct
- Verify time zone and currency are correct

To filter out most of the referral spam, scroll down to “Bot Filtering” and check the box.
You can take a deeper dive into how the bot filters out the traffic here.
3. Add Filters
Filters help ensure you get the most accurate data by filtering spam traffic and traffic from your and your client’s IP addresses. This way you aren’t wasting time figuring out why you can’t convert yourself. 🙂
How to set a filter for your own IP address in Google Analytics:
- Sign into Google Analytics
- Navigate to Admin > View Settings > Filters > Add Filter
- Name the filter
- Choose “exclude”
- Choose “traffic from the IP addresses” and add the IP address
- Choose “equal to”

Annie Cushing of Annielytics also recommends creating an ‘include filter’ and adding your own domain. This will prevent most referral spam but isn’t right for all sites.
To create the include filter, follow the steps above through #3, then choose “Include Only” > “traffic from the ISP domain” and add your domain name.
4. Goals
Site traffic isn’t the only data that matters. There is so much more you can track, and goals help you do it.
Goals tell Google what actions you think are most important for your business.
To set up goals, go to Admin > Goals (under Create View) > New Goal.
This post gives an in-depth break down of different types of goals you can create. I suggest creating at least two goals, you can add later.
5. Dashboards
Part of what makes Google Analytics so powerful is the ability to customize.
Dashboards provide a high-level view of the stats and data that matter most to your business. They can be basic or extremely in-depth, depending on your needs.
Here are a few examples of dashboards to consider:
- SEO dashboard, created by BrightonSEO
- Top content and key terms dashboard
- Traffic growth dashboard
- Sample dashboard by Jenny Halasz (learn how to customize it here)
6. Alerts
An alert will send you a notification if certain parameters are met in your account.
For anyone who might not be in Google Analytics every day, this is a critical step.
To start, I suggest setting an alert for when organic traffic decreases by 20% on the same day and another when organic traffic increases by 20% on the same day.
This will alert you to major changes.
Here’s how:
- Sign into Google Analytics
- Navigate to the Admin control panel
- Click on Custom Alert > New Alert
Now, add a name and set the parameters for your alerts.
7. Google Analytics Health Checklist
The best way to understand how Google Analytics works is to dive in and do a health check.
Start off with this 10 point checklist:
- Are additional platforms connected? (Google Ads, etc.)
- Is site search enabled?
- Have you set alerts for any metric changes that would require immediate action?
- Did you add filters to block your own IP address plus any spam sites currently sending traffic to your site?
- Did you enable the Demographics and Interest Reports?
- Are people finding what they need in your site search?
- What is your bounce rate?
- Has traffic increased or decreased drastically in the past week? If so, from what source – organic, paid, referral?
- What key terms are you ranking for?
- What is the most popular piece of content on your site? Why?
If you’re just starting out with Google Analytics, I highly recommend following Annie Cushing of Annielytics. She’s one of the smartest analytics consultants out there and publishes tons of in-depth content. She offers a full Google Analytics audit spreadsheet here. For more advanced help, she also has a self-guided site audit template you can purchase.
Wrapping It All Up
For an SEO professional, understanding and getting the most out of Google Analytics is essential.
Google Analytics can help you understand not just what is working but why. (Or why not.)
In some cases, you might find a strategy was successful, you were just looking at the data from the wrong angle.
All of this data is available for free – you just have to know how to leverage it.
More Resources:
- 6 Ways to Use Google Analytics You Haven’t Thought Of
- 10 Great Google Analytics Alternatives
- Why Google Search Console & Google Analytics Data Never Matches
Image Credits
Featured Image & In-Post Photos: Created by author
All screenshots taken by author
