

There once was a time where infographics were the go-to medium when it came to content marketing. Informative, engaging, and easy to share, they present the ultimate trifecta for attracting traffic, gaining links, and generating leads.
But the raving about infographics has seemingly died down a bit. They aren’t a fresh concept anymore.
It takes a bit more effort to get users psyched to download, share, and link to an infographic; even more effort to make it go viral.
How do you create infographics that stand out from the rest and drive traffic to your website?
Here are 10 ways to step up your infographic game.
1. Conduct Market Research
There’s no sure indicator whether your infographic is going to get your audience hooked, but conducting market research before you start creating the graphic will get you close.
You want to come up with a concept that your audience is, in fact, interested in.
You can conduct market research by surveying your audience regarding their most burning industry questions. The goal is to figure out what they really want to know. Some questions to ask them include:
- What’s the #1 question you have about [topic/industry]?
- What’s your biggest struggle when it comes to [accomplishing goal]?
- If you could sit down with an [industry] expert, what would you ask them?
- What 3 things do you find most interesting about [topic/industry]?
You can easily create a survey using Google Sheets and send it out to your audience. You can even hint that an awesome “bonus” or “resource” will be released soon, as s result of their answers.
That way, you have the answers you need to create an awesome infographic and you have an audience that’s primed to gobble it up once it’s ready.
2. Identify Viral Topics
It’s easier to ride a #trending wave than create your own. To ensure that your infographic really takes off, it’s best to identify hot topics in your industry and capitalize on that existing momentum.
If a ton of people is already searching for information on a topic, there’s a great possibility that you can grab a piece of that traffic pie if you get in soon enough.
You can gain the attention of your target audience (traffic and shares) and others in your industry who are writing about the topic (backlinks).
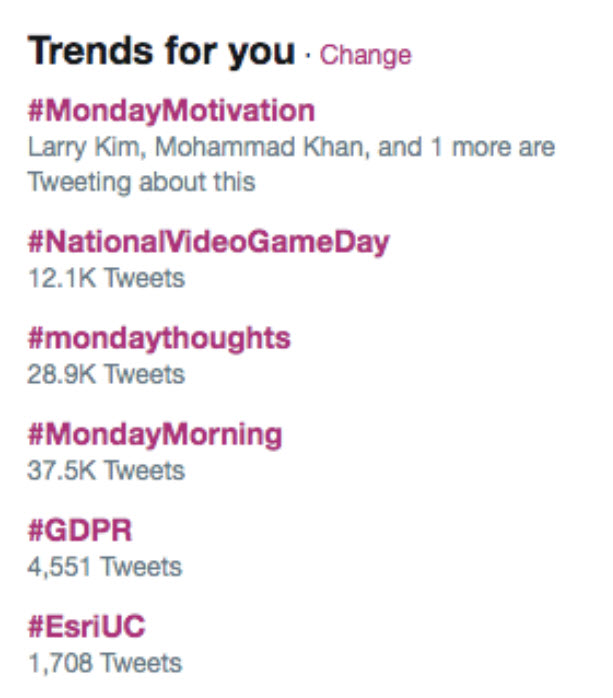
Google Trends, Twitter, BuzzFeed, Reddit, and Facebook are all great places to find trending topics. All of these platforms have a “trending now” section of sorts that show which topics are being searched the most.
One of these topics may be worth creating an infographic about. And you can always share the finished product back on these platforms later.
3. Lay Out a Content Marketing Plan
Before actually creating your infographic (which takes time and money), it’s best to lay out a marketing plan to ensure that you will make a return on your investment.
Creating an infographic and waiting for traffic to trickle in isn’t the best approach.
Even if your primary goal is to gain organic traffic, you at least need to determine how you plan on optimizing the page or post in order to rank in the search results.
But beyond that, it’s worth laying out a robust marketing plan that gets your infographic in front of as many eyes as possible, using social media, email marketing, and even paid ads.
If you previously reached out to your audience for market research purposes, it’s a great idea to send the finished product out to them.
You may even consider which trending hashtags you should use on social media.
Should you create a roundup post of industry experts in order to encourage backlinks?
These are all things to consider before ever even creating your graphic.
4. Think Outside the Box

With so many infographics, blog posts, and videos already out there, it may feel like “there is nothing new under the sun”. But in order to create an infographic that really takes off, you need to think of a concept that will stand out.
- How can you make your chosen topic more exciting?
- In what new ways can you visualize the data?
- Are there any symbols or graphics that would catch readers’ attention?
- Can you incorporate humor into your infographic?
- What’s something others in your industry haven’t dared to do before?
Depending on how adventurous you are, this could be the time to ruffle some feathers, do something bold, or get people laughing. Ideas that are new and exciting will get people talking about and sharing your content.
5. Dig Into the Data
While many people focus on the graphic part of the infographic (i.e., how to make it look pretty), it’s just as important (if not more important) to focus on the info part.
Dig into the date first, then create the graphics around the data to make it interesting.
People don’t want to read a rehashing of old concepts and statistics they have seen before.
If you have new data to share, some study results to publish, or an exciting case study to present, now’s the opportunity to do just that. Share information that your audience is unlikely to find anywhere else.
Once you have this data (and you are sure it’s of interest to your audience), your job is to visualize the data in a way that makes sense.
- Is there a creative way to display this information?
- What can you do that will make the data more meaningful and memorable?
That’s where the graphic side comes into play.
6. Create Content That Tells a Story
The first step when it comes to mapping out the design for your infographic is to create the content.
Rather than having a design and trying to make the information fit into the design, it’s best to organize the content and create a design around the information.
In order to do that, you want to create content that tells a story.
Much like a blog post, it should have an introduction, the body content, and a conclusion. Effectively introduce the concept, keep readers reading, and tie everything up at the end.
If you’ve taken a think-outside-the-box approach, you may already have a storyline in mind.
For example, you may be sharing the information from the perspective of a certain character, like a small business owner, an attorney, an aspiring artist, or even a cartoon.
Or, maybe you’ve decided to lay out a timeline of events for readers to follow through history.
Simply summarizing the data and making it look good isn’t going to cut it. You want content that’s going to keep your readers engaged and graphics that are going to wow their socks off.
7. Set the Mood
Similar to creating content that tells a story, you want to create content that inspires some kind of emotion in the reader. Intrigue, surprise, shock, and even confusion are enough to get people talking.
Of course, you don’t want to create anything that is going to attract negative publicity to your business. Be considerate of controversial topics before you release your infographic into the world.
Your goal is to get people interested and sharing your content, not bashing your brand and drumming up a bunch of negative attention.
Infographics that inspire emotions are those that get remembered and shared. Capitalize on human psychology to make your graphic go viral.
8. Build Out a Sleek and Interesting Design

The purpose of your infographic is to serve as a marketing tool for your business. Therefore, it’s worth investing in high-quality work just as you would with any other marketing campaign.
Working with a professional graphic artist that knows how to create amazing infographics is the best way to go.
A sleek, intriguing design could cost you $100 or more, depending on the size and complexity. But consider how much traffic, backlinks, and new business could be gained as a result of a truly stellar infographic.
A great design is worth the money.
Here are some things to consider when it comes to designing the infographic:
- Does the way the information is organized make sense?
- Are you visualizing the data in a new way?
- Are the graphics clear and crisp?
- Is the text easy to read?
- Is the image web-friendly?
- Are the colors and fonts on-brand?
- Does the graphic include your logo and/or brand name?
- Does the infographic have a catchy, bold title?
- Is the image optimized for social sharing?
- Is the image viewable on a mobile device?
If you are going to spend the time and money on creating an infographic, you want to be sure that your investment pays off.
Take whatever time it takes to create a graphic that’s attractive, stands out, and is ready to be circulated across multiple platforms.
9. Share, Share, Share!
Once the infographic is created, it’s time to put your content marketing plan into action. If that means generating traffic through SEO, make sure the post or page is optimized to the nines.
If that means email marketing, write copy for your email campaign. If that means social media, create captions, use hashtags, and schedule out your posts.
You don’t have to just rely on search engine traffic to attract people to your infographic. Especially if you have chosen a trending topic, you want to ride the momentum of searches that are already taking place on social media.
Another hot platform for infographics is Pinterest. Pinterest is a highly visual platform and serves as a powerful search engine that attracts over 250 million users per month.
Sharing your infographic on Pinterest with a great caption and the right hashtag could drive hundreds to thousands of users to your website.
10. Offer Users a Content Upgrade
You may decide that your infographic is just too good to give away for “free”. In fact, using an infographic as a content upgrade is a smart way to generate leads for your business.
Simply create a piece of content (like a blog post) that attracts users to your website.
Then, add the infographic behind an email wall where users have to enter their email address in exchange for the “upgrade” (your infographic). That way, you can grow your email list and users get something they can’t find anywhere else.
You can also add your infographic to a landing page where you send traffic from Google Ads or Facebook Ads.
Grow your list and even target these users with more ads later. You’re not only getting traffic but real leads for your business.
Create Infographics That Go Viral
The sky is the limit when it comes to creating creative, engaging, and share-worthy infographics.
With a little market research, some awesome copy, and killer graphics, you can create infographics that attract traffic, backlinks, and leads.
More Resources:
- 8 Benefits of Using Infographics in Your Content Strategy
- 7 Reasons Why Content Needs Amazing Images, Videos & Visuals
- 4 Vivid Visuals That Will Increase Your Social Engagement
Image Credits
Featured Image: Shutterstock, modified by author, August 2019
Screenshot taken by author, August 2019
Infographic #1: GOOD Inc
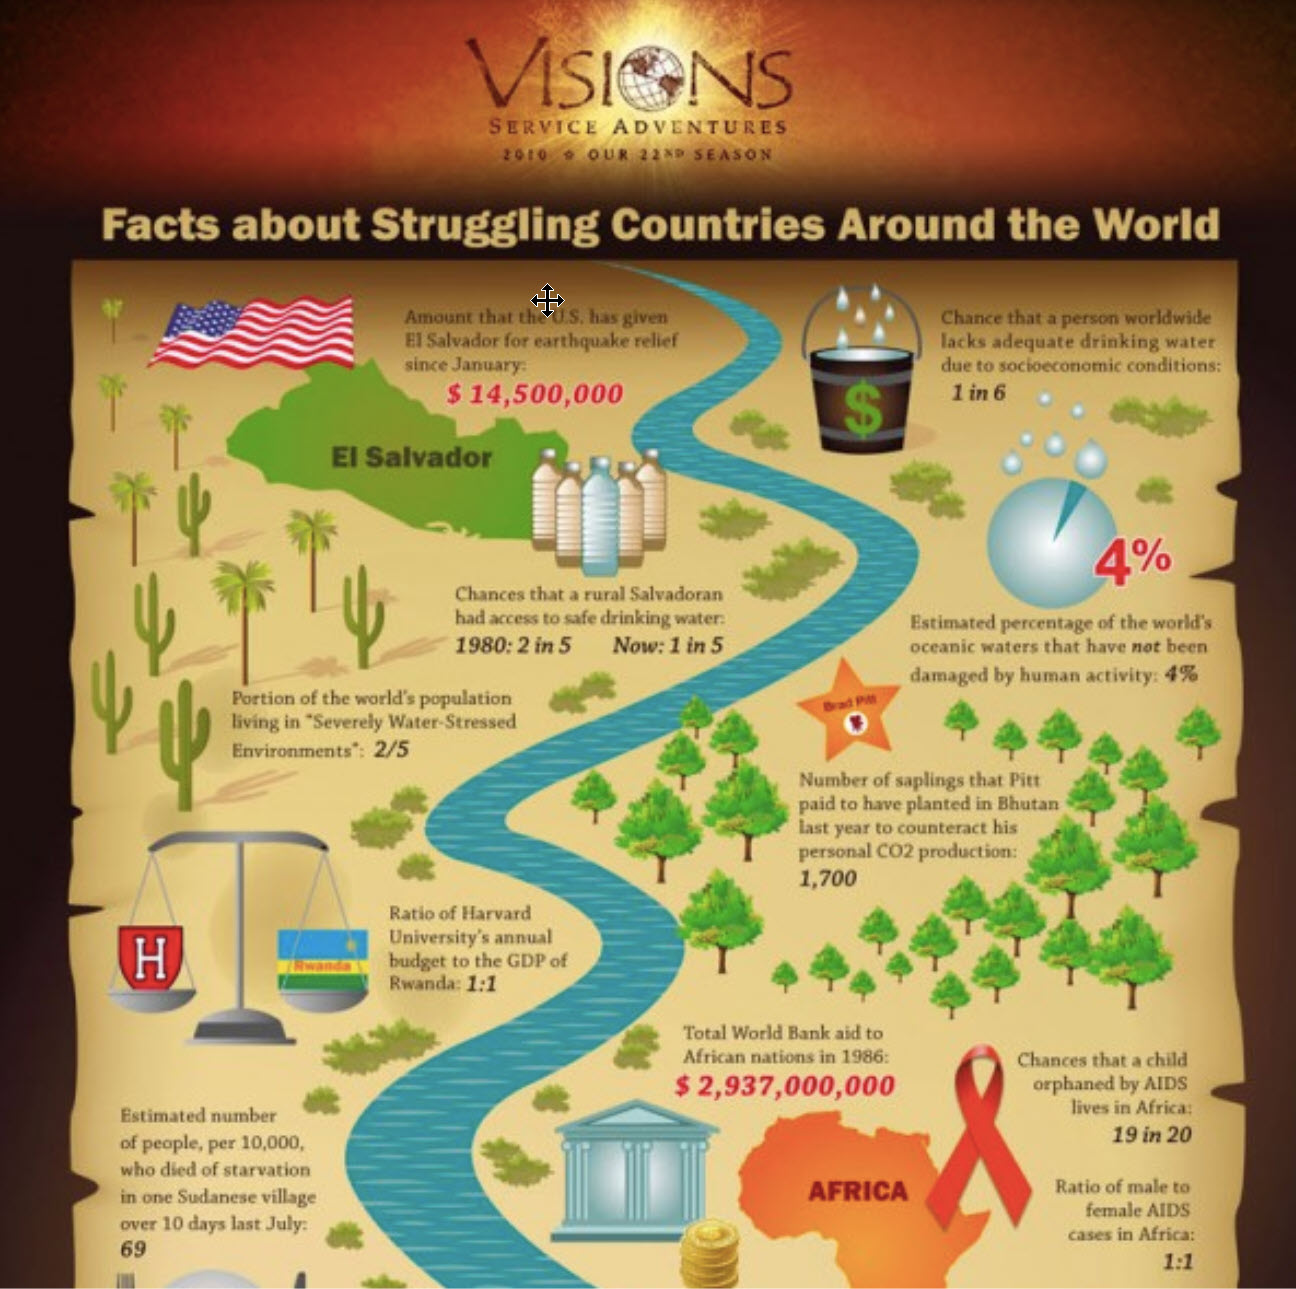
Infographic #2: Vision Service Adventures
Infographic #3: Visual.ly
