

Time is money.
This is one of my mantras, and I try to run my life by it.
Since I run my own small digital marketing agency and we only have a lean team, we have also made this one of our key pillars.
So it is not a surprise for me, and for us as a team, that automation has always been at the top of the priority list.
It is also because I have always been fascinated by technology and innovation, and believe that progress is what drives us forward for the better.
As such, I have looked at ways to do things using a different approach.
My Automation Journey Started With Macros And VBA
Back in the day, I worked for a large online travel agency and my job was to set up partner businesses in the back end. It was a repetitive and tedious job; a sort of endless “copy and paste” task.
That is when I discovered the existence of macros.
For those that are not that familiar, macros are sets of actions that can be recorded as instructions.
When played back, macros will automatically repeat all the actions and steps that have been recorded in that exact same order.
A benefit is that they can be recorded and used in a large number of environments. One of the most common uses is in spreadsheets – Excel, Google Sheets, etc.
Many Years After, We Still Use Macros!
Even with my duties running the agency, I still enjoy being hands-on with the accounts – and in particular, working with the ops team.
Recently, we had to complete an extra large report for one of our biggest clients.
They prefer Excel over any other solution, and we had to engineer something that could collate and “clean” the data, format it, and present it in an insightful way.
Whilst gathering the data and presenting it was quite straightforward, “cleaning” it to maintain consistent formatting was a bit of a challenge since we were dealing with tens of thousands of rows.
This is where macros came to the rescue.
A few sets of instructions I recorded and modified using visual basic (VB) – the language macros are built-in – made the task not only possible, but also helped to complete it faster, and eliminate the risk of human error.
Automation = Money
My point is exactly this: If time is money and automation saves time, then automation equals money.
All while providing the additional benefit of reducing the chance of making mistakes along the process.
It is easy to see what has inspired my fascination with automation.
Some of you reading this column might even have come across one of my previous articles here on SEJ: How To Use Google Sheets For Web Scraping & Campaign Building.
Evolving To Google Ads Scripts
There are tons of Google Ads scripts out there that have been written by some of the brightest minds in our industry; Frederick Vallaeys, and Daniel Gilbert, just to name a couple, are amongst those that I consider the real automation trailblazers!
But despite scouring the internet, by and large, I couldn’t find anything that could solve my problem.
Why We Needed A New Script
Here was my issue: At our agency, we have a number of retail clients in the flower delivery industry that run their businesses online and via their brick-and-mortar stores.
Having helped many of these businesses with their ad campaigns for several years now, we know a lot about their customer behavior and buying patterns.
From these insights, we’ve gathered that people tend to mostly order flower deliveries on weekdays, but on the weekends it is easy enough to pop to the shops and grab a fresh bunch of flowers.
So normally we can see a dip in return on ad spend (ROAS) between Friday afternoon and Sunday afternoon.
Typically, people are back online on Sunday evenings, ordering deliveries for Monday.
But despite all the amazing steps forward that Google has made with automated bid strategies (target ROAS, maximize conversions, etc.), most of these clients struggle to maximize ad performance during the weekends, whilst their ROAS tend to peak at the beginning of the week.
So one of the actions we have taken (in accordance with our clients) is that, led by their performance data, we allocate different budgets, at a campaign level, to each day of the week.
For example, we would have something like this for a Monday:
| Day | Campaign | Budget | Weight |
| Monday | Campaign Name 1 | $150.00 | 30.00% |
| Monday | Campaign Name 2 | $85.00 | 17.00% |
| Monday | Campaign Name 3 | $162.50 | 32.50% |
| Monday | Campaign Name 4 | $62.50 | 12.50% |
| Monday | Campaign Name 5 | $40.00 | 8.00% |
| Total | $500.00 | 100.00% |
And then like this for a Friday:
| Day | Campaign | Budget | Weight |
| Friday | Campaign Name 1 | $70.00 | 20.00% |
| Friday | Campaign Name 2 | $87.50 | 25.00% |
| Friday | Campaign Name 3 | $140.00 | 40.00% |
| Friday | Campaign Name 4 | $35.00 | 10.00% |
| Friday | Campaign Name 5 | $17.50 | 5.00% |
| Total | $350.00 | 100.00% |
You can see that, not only do we have a smaller total budget, but we also have a different budget weighting by campaign.
We needed to be able to change each campaign budget to have a different allocation every day of the week.
Indeed there is a way to automate the process directly from Google Ads using rules. Though, if you have an account with a large number of campaigns, the setup could take a significant amount of time and effort.
That is because we would either need to create one rule for each campaign, for each day of the week, in order to update the budget amount.
Alternatively, we would have to create one rule for each day of the week, but with a different line (action) for each campaign.
And no matter how you do it, either of these options leaves you vulnerable to mistakes along the way.
I postulated that it would be easier to have a spreadsheet with the budgets split, where allocations can be calculated using simple formulas, and have this fed straight into the platform via a script.
As I mentioned, I scoured the internet by and large, but couldn’t find anything like that.
Sure, there are a handful of Google Ads scripts that have been written to manage budgets, most to control spend and limit chances to overspend, but nothing that would suit our clients’ needs.
Enter The Google Ads Budget By Day Of The Week Script
What our script does should be pretty clear by now, but to summarise, it allows us to use a Google Sheet to set budgets by account and by campaign for each day of the week.
It then uses that information to update the campaign’s daily budget.
Note that this is an MCC-level script, so if needed, multiple accounts can be managed through one single document.
Where To Download And Copy The Script
The script is completely free to use, and can be downloaded or copied from our Github gist here.
-
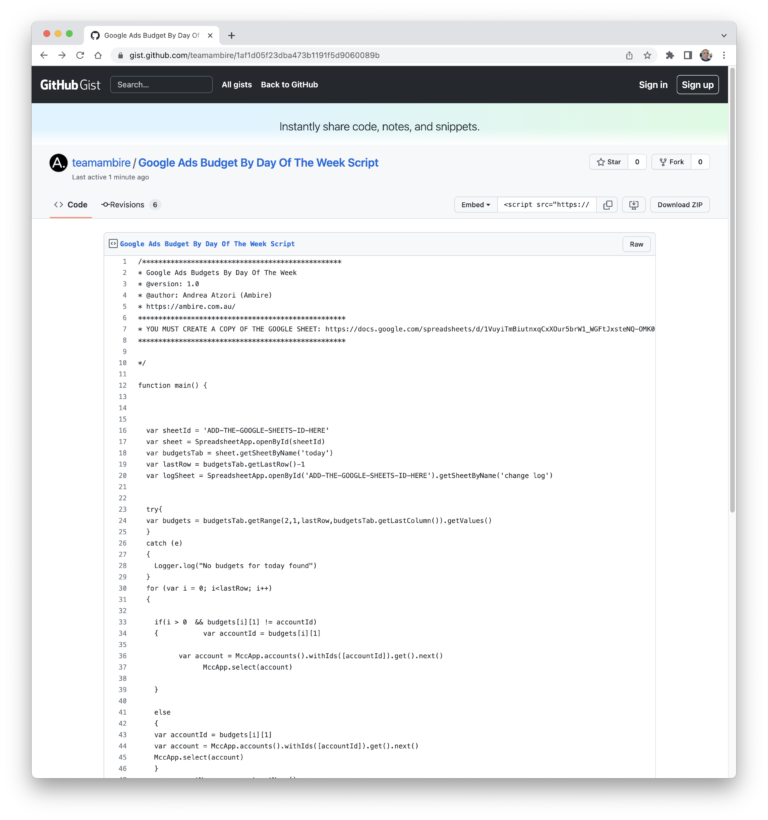
Screenshot from Github, December 2022
How To Use The Script
In order to use the script, first you will need to create a copy of the Google Sheet that is used to feed the budget information from.
This can be done via this link.
Once you have created a copy of the file, you will see there are four tabs in the document:
- Today – The tab where, if a budget has been created for the current day, it will be shown, and from which the script will take the data to process the budgets update
- Allocation – This is the tab where budgets are defined for one, multiple, or all days of the week. Here, if needed, you can use formulas to calculate the amounts that are allocated to each day of the week, each campaign, etc.
- Everything – The master list of the budget allocation. In theory, this tab can be superfluous but we added it in order to have a way to double-check that budgets are split and allocated correctly. Unless changes are made to the formulas, this tab must be kept, since the data in the ‘today’s tab is queried from here.
- Change Log – The last tab, where changes are recorded once applied. If a change has been made, here it will show the previous and new budget allocations.
-
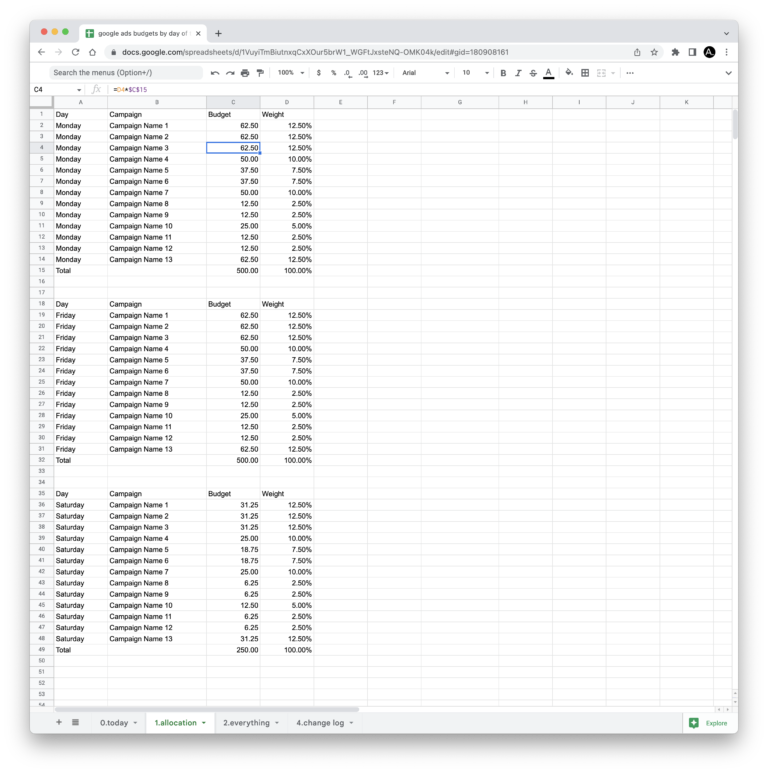
Screenshot from Google Sheets, December 2022
The Next Step Is To Install The Script
As mentioned, this is an MCC script.
In Google Ads, you will need to go to Tools and settings > Bulk actions > Scripts:
-
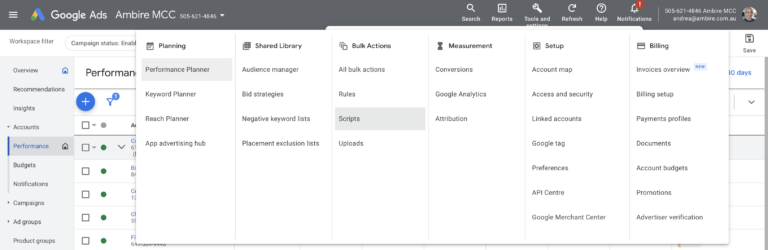
Screenshot from Google Ads, December 2022
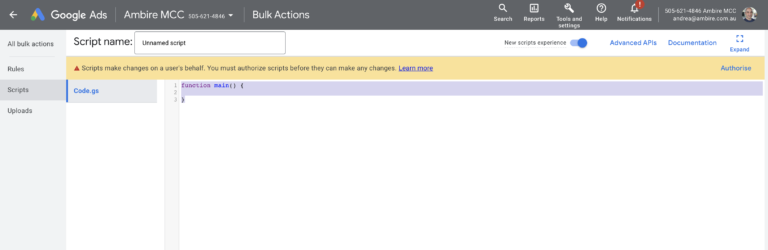
From there, click on the plus (+) icon to add a new script.
-

Screenshot from Google Ads, December 2022
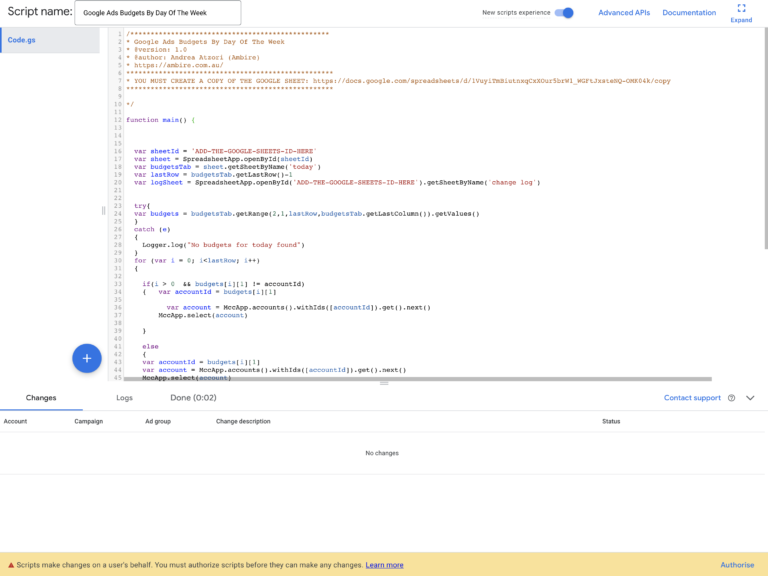
For this script to work properly you will need to make sure that “New scripts experience” is enabled (see above).
Then you will need to remove the few lines of code that are in the document by default:
-
Screenshot from Google Ads, December 2022
At this point, you may proceed to paste the file you copied from our Github gist:
-
Screenshot from Google Ads, December 2022
Customizing The Script
Before the script can be used, you must change two variables. This will let the script know where to source the budget information, and where to record any changes that have been applied.
The two variables are:
- var sheetId = ‘ADD-THE-GOOGLE-SHEETS-ID-HERE’
- var logSheet = SpreadsheetApp.openById(‘ADD-THE-GOOGLE-SHEETS-ID-HERE’).getSheetByName(‘change log’)
There you will need to replace ADD-THE-GOOGLE-SHEETS-ID-HERE with the Google Sheet ID of the document you created earlier:
-
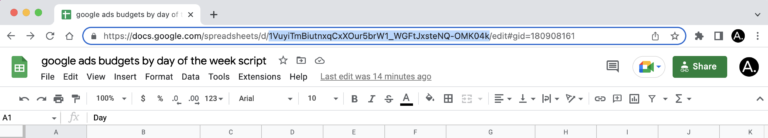
Screenshot from Google Sheets, December 2022
Running The Script
You are nearly ready to run the script, but note that you will need to grant authorization before it can make any changes:
-
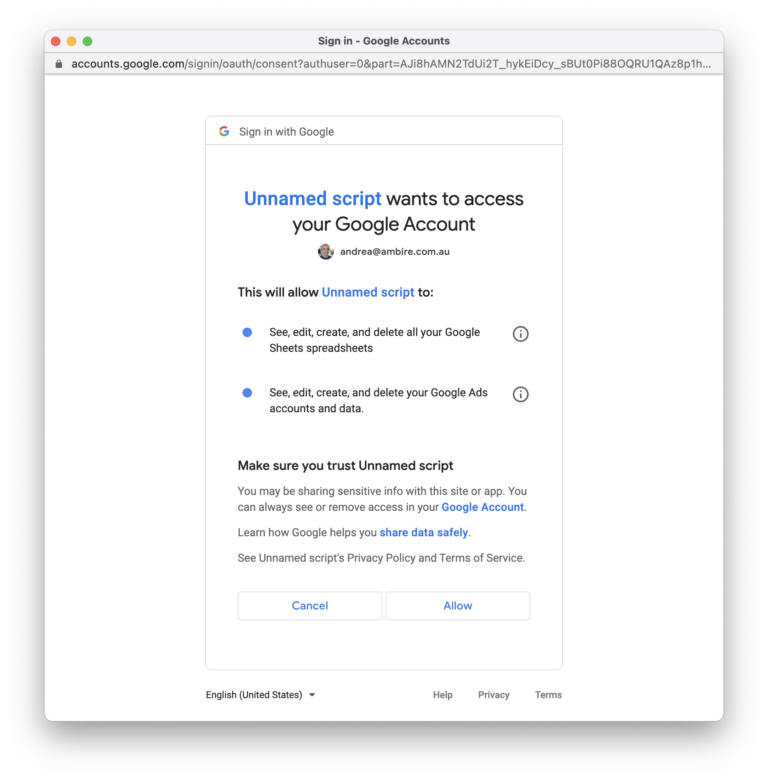
Screenshot from Google Ads, December 2022
Once you have used your credentials to authorize the script to act on your behalf, run a quick preview to make sure all is working as expected.
At this stage, if there are budgets that have been allocated for the current day in the Google Sheet’s tab named ‘today’, you would see something like this when running the script preview:
-
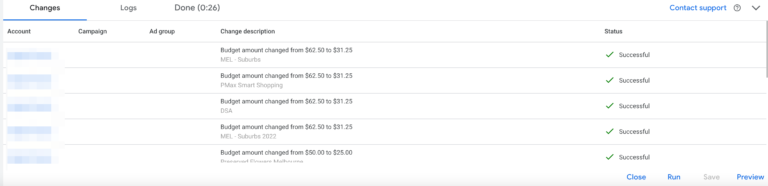
Screenshot from Google Ads, December 2022
Whereas in the Google Sheet’s tab called “change log” you will see something similar to this:
-
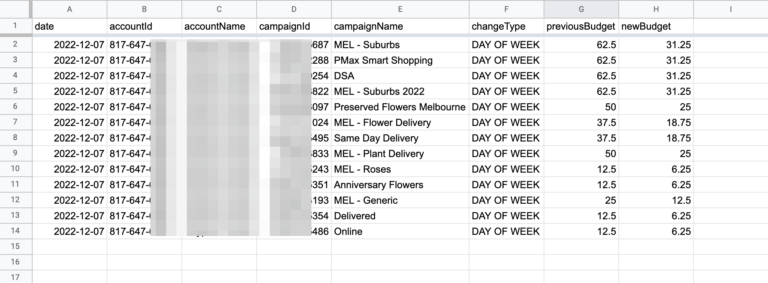
Screenshot from Google Sheets, December 2022
All changes have been applied and recorded correctly!
The last thing left to do is to schedule the script.
Depending on your needs, you can let it run daily, or only on the days that you want it to make the changes.
Conclusion
Just like other Google Ads scripts we regularly use, this has helped our team streamline processes and leverage automation to free up time and resources.
This has enabled our agency to focus on more strategic work and tasks.
Hopefully, the push for innovation and finding better ways to work will motivate you as much as it motivates us.
More resources:
- Free Google Ads Script To Dynamically Change Target ROAS
- Money-Saving Placement Exclusion Script for Google Ads
- 10 Most Important PPC Trends To Know In 2022
Featured Image: BestForBest/Shutterstock
