

After a long wait, Google is starting to roll out their new search console with a significantly updated UI and up to 16 months of data.
The Google Search Console has always been one of my favorite SEO tools.
Having had one of my sites in the beta the last few months, I found myself relying on it even more.
It will be great to have this much data available for all websites in my Google Search Console account.
Even with the extended data in Google’s Search Console, the data is still normalized and averaged out over time; however, it is some of the best directional data available from any tool.
With appropriate filtering, you can find some really actionable insights that can’t be found anywhere else.
Here are some things you can start looking at right away as soon as you see the new Google Search Console in your account.
1. Brand Search vs. Non-Brand Search
Understanding the breakdown of your brand vs. non-brand is critical on many levels.
Excluding brand impressions and clicks from your search metrics reveals the true visibility of your SEO efforts.
Likewise, viewing only brand search over the 16 months now visible in Google Search Console can shed some valuable insights as to the strength of a brand.
This metric can answer important questions, such as:
- Is the brand accruing more impressions over time?
- Is CTR for the brand relatively stable?
- Are there any variations of the brand that do not rank in a couple of positions?
- And, when paired with data from Adwords performance, how is brand bidding impacting the CTR of an organic brand listing?
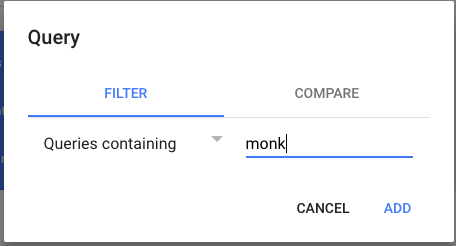
Filtering Brand Searches
You can search for your brand name by choosing Queries containing and typing it into the field.
Tip: The query you are filtering should not be the full brand name as it should also pick up common misspellings.
For example, I truncate monkey down to “monk”.
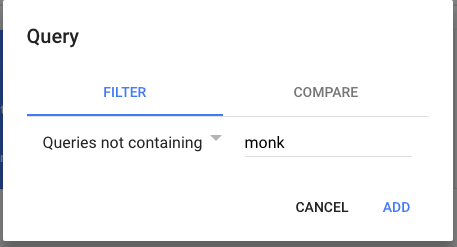
Filtering Non-Brand Searches
Use the Queries not containing filter to exclude the brand name from search and only see non-brand keywords.
2. Homepage vs. Non-Homepage
Similar to the brand search filter, viewing homepage vs non-homepage traffic can illuminate the effect of an SEO campaign.
While for many larger brands a major portion of traffic will land on the homepage, it is important that non-homepage pages are also ranking and receiving search traffic.
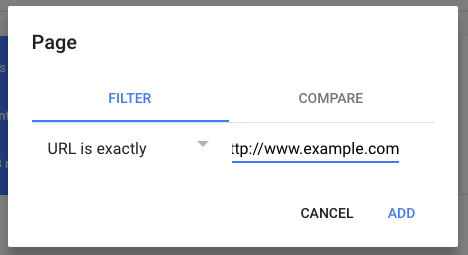
Filtering Homepage Only Searches
You can come up with a homepage-only search report by choosing “URL is exactly” and typing in your homepage URL in the field.
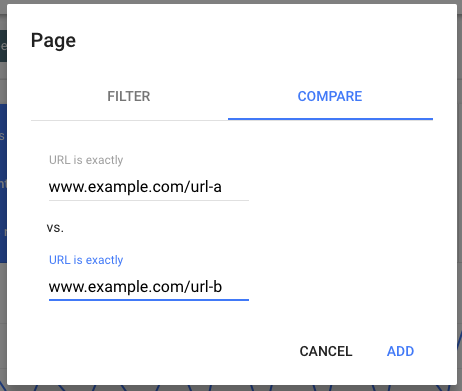
Comparing Non-Homepage Search Reports
You can also compare the traffic of two specific pages if you changed a URL during the last 16 months:
3. Brand Impact by Dimension
More than just clicks to the site, it is also important to look at the other dimensions of brand (and non-brand) traffic.
Within Google Search Console you can see countries, devices, and then view the impressions, CTR, and rankings.
Deep dive into these reports to see if there are any outliers which deserve attention.
Here is how you would get the country (and filter it for specific countries)

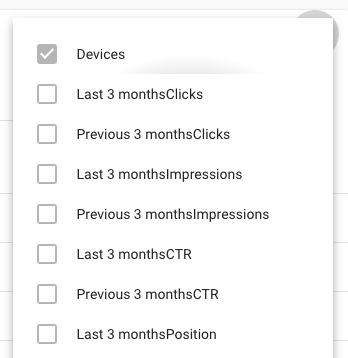
Here is how you look at device.

Within these reports, you can toggle on queries, CTR, impressions, and rankings.
4. Year over Year Data
As there is now 16 months’ worth of data in GSC, you can see YoY data for the last four months.
Look at clicks, impressions rank, and CTR by page and keywords.
Here is how to get 16 months of data:
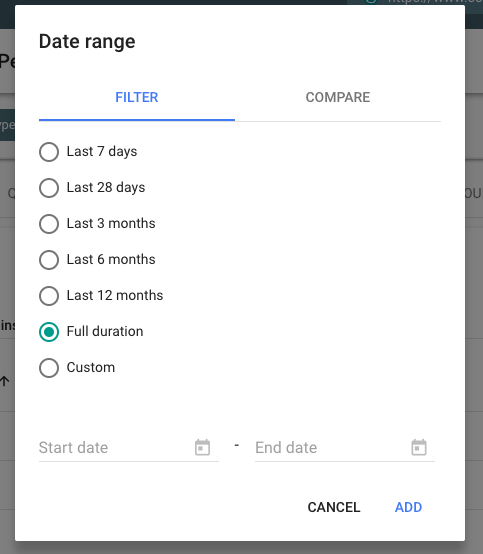
You can also look at custom chunks of data with beginning and end dates.
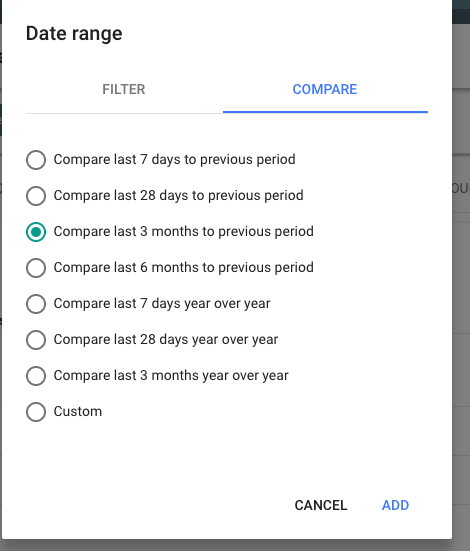
Time period comparisons are also available. They are slotted into the dialog box for dates under Compare:
5. Pivot Tables
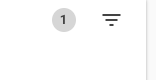
Google Search Console has an additional hamburger menu which allows you to create items to filter.
You can have multiple filters on at the same time and narrow down to specific scenarios.
Note: It’s hard to demo the power of this data without revealing sensitive data, so you will have to play with this menu on your own.
Here’s how to find that hamburger menu:
Now that you know how to dig through these reports, here are some key insights and action items that you should look for in your data.
- Discover pages that have a relatively low CTR, but a high-ranking position. (Note: There is no hard and fast rule here on what constitutes an outlier, but as you dig through your data you should notice pages worth attention.) These pages will likely have some sort of mismatch between their meta description / search snippet and a user’s query. You can and should try to address this by updating the title, meta description, and/or on-page content.
- Sort queries by impression count and ensure that you are effectively optimized for these queries. If you are not ranking high, these keywords could present new traffic opportunities for SEO campaigns.
- Within the Sort by query impression, filter by country. Discover if there are countries with high performance you have not focused on and consider doing some international specific SEO efforts to get even more of this traffic.
- Filter the clicks and impression reports by device to discover if there are potential engagement issues on mobile devices or vice versa where there is better performance on mobile than desktop.
- Sort queries by position and look for keywords ranking on the cusp of the first page of Google search results (Position 8 or 11, depending on the query). These are keywords that if you put a little bit of SEO effort behind should see outsized returns.
Conclusion
Once the new Google Search Console is fully released, SEO pros should see that this new version is light years ahead of the old one when it comes to finding actionable insights.
In the meantime, there are a few things to note:
- It doesn’t seem like there is a way to download reports yet, but the Google blog posts about the new Google Search Console mention API availability.
- Rather than checking boxes to add dimensions into a report, you just click on the name of the actual dimension.
- The new Google Search Console is blazing fast compared to the old one and will make finding data a joy!
Image Credits
In-post Photos: Screenshots taken by Eli Schwartz, January 2018.
