
Google Analytics is undoubtedly one of the most powerful web analytics tools available today. It has tons of features that can help you measure your sales and conversions. Not only that, but it helps you understand how visitors use your site, how much time they spend on your site, and what content keeps them coming back.
While working with clients and helping them configure Google Analytics on their website, I learned many clients were not aware of many important features of Google Analytics. I wanted to share with you the commonly missed features of Google Analytics that you can use to generate great insights.
Creating More Than One View
Having more than one view allows you to experiment with your Google Analytics data without having the fear of data loss.
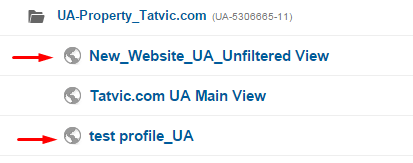
I have seen situations when the client had only one view in Google Analytics and saw discrepancy in the data due to improper configuration of filters.
To avoid situations like data discrepancy or data loss, you should create more than one Google Analytics View:
- Unfiltered View
- Test View
In the unfiltered view, you do not apply any filters or configuration as it will affect the raw Google Analytics data.
In the test view, you can apply filters and make configuration changes to analyze the data you want.
Additionally, if you are a big enterprise and use the single Google Analytics Property for different sub-domains, you can create different views for different sub domains in Google Analytics and share limited access to the stakeholders.
Further Reading:
- How to Create New View (support.google.com)
- Why you need at least 2 views in Google Analytics (cxfocus.com)
Demographic and Interest Report
The Demographic and Interest report has been around for a long time, but I still don’t see it used by many people. The Demographic and Interest report provides you with information about your users’ age, gender, and interest.

The report is extremely helpful in understanding your website’s audience. Additionally, insights from the report will enable you to target your marketing campaigns for higher conversion.
Insights that you can generate from the report are endless, for example:
- Which Gender is engaging more with your website?
- Which Age Group is engaging better and converting?
Further Reading:
- Google Analytics Demographics & Interests Reports (online-behavior.com)
- Demographics and Interests analysis (support.google.com)
- Customer Insights With Google Analytics Demographics (online-behavior.com)
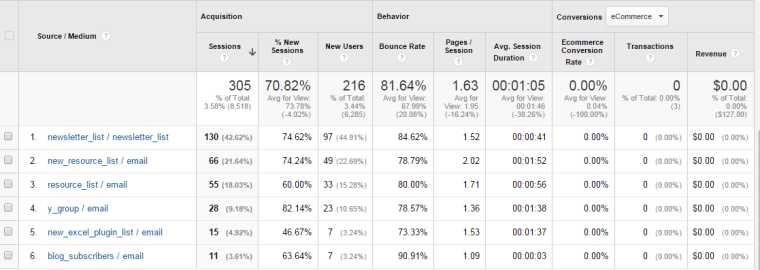
Event Tracking
Google Analytics tracks many user actions by default, but there are events which Google Analytics does not track out of the box. For example: Number of clicks on download button. Using Event tracking you can track any click – event.
![]()
Event tracking allows you to track actions whether or not a URL change is recorded. Examples include clicking on links, email addresses, social media icons, or file downloads.
We understand every website will have certain user actions they may want to track. Through event tracking you go deeper into custom behavior and understand how users are engaging with your content.
You can track:
- Number of people who downloaded a file
- Number of people who clicked the play/pause button
- Or any other specific click base user action
Further Reading:
- Event Tracking Google Universal Analytics – Complete Guide (optimizesmart.com)
- Event Tracking for Google Analytics: 3 Step Set Up (gravitatedesign.com)
Tool:
Using the Benchmarking Report
Benchmarking is an extremely valuable report since it tells you how your metrics are stacked up against others in the industry. It lets you compare and understand how each of your channels are performing compared to the industry standard.

Following are some of the insights you can generate from the report:
- How is your site performing compared to others in your industry?
- In what areas could you stand to experience a major overhaul?
- In what areas are you close to reaching industry benchmarks?
Further Reading:
- More Context With Google Analytics Benchmarking (online-behavior.com)
- Benchmarking Performance: Your Options, Dos, Don’ts and To-Die-Fo (kaushik.net)
Using UTM Parameters to Track Campaigns
When running an online marketing campaign it is highly likely you will distribute various pieces of marketing material in many places across the web.
Let’s say you place display ads of various sizes on a range of websites, place a feature about your product in your monthly newsletter and place an article and advert in the newsletter of an online industry magazine.
While it is easy to determine which channel is bringing in more traffic to your landing page (let’s say email drives more traffic than advertising), how do you determine which newsletter is more effective? Or what banner size is most effective? This is where UTM parameters come in to play!
UTM parameters are simply tags that you add to a URL.
When someone clicks on a URL with UTM parameters, those tags are sent back to your Google Analytics for tracking.
For example – we had recently sent a newsletter to five different email list, by using UTM Parameters, we were able to learn how much traffic each of these list is generating.
If we hadn’t used the UTM parameters, it would have been difficult for us to understand which list generated more traffic and converted well.
Further Reading:
- How to Track Online Marketing Campaigns with UTM Parameters in Google Analytics (kissmetrics.com)
- How to Use UTM Parameters In Google Analytics (kissmetrics.com)
Tools:
Integrating Google Webmaster Account
Many of us are not in a habit of looking at our Google Webmaster Account on a regular basis. Integrating the same via Google Analytics once helps you look at the search queries.
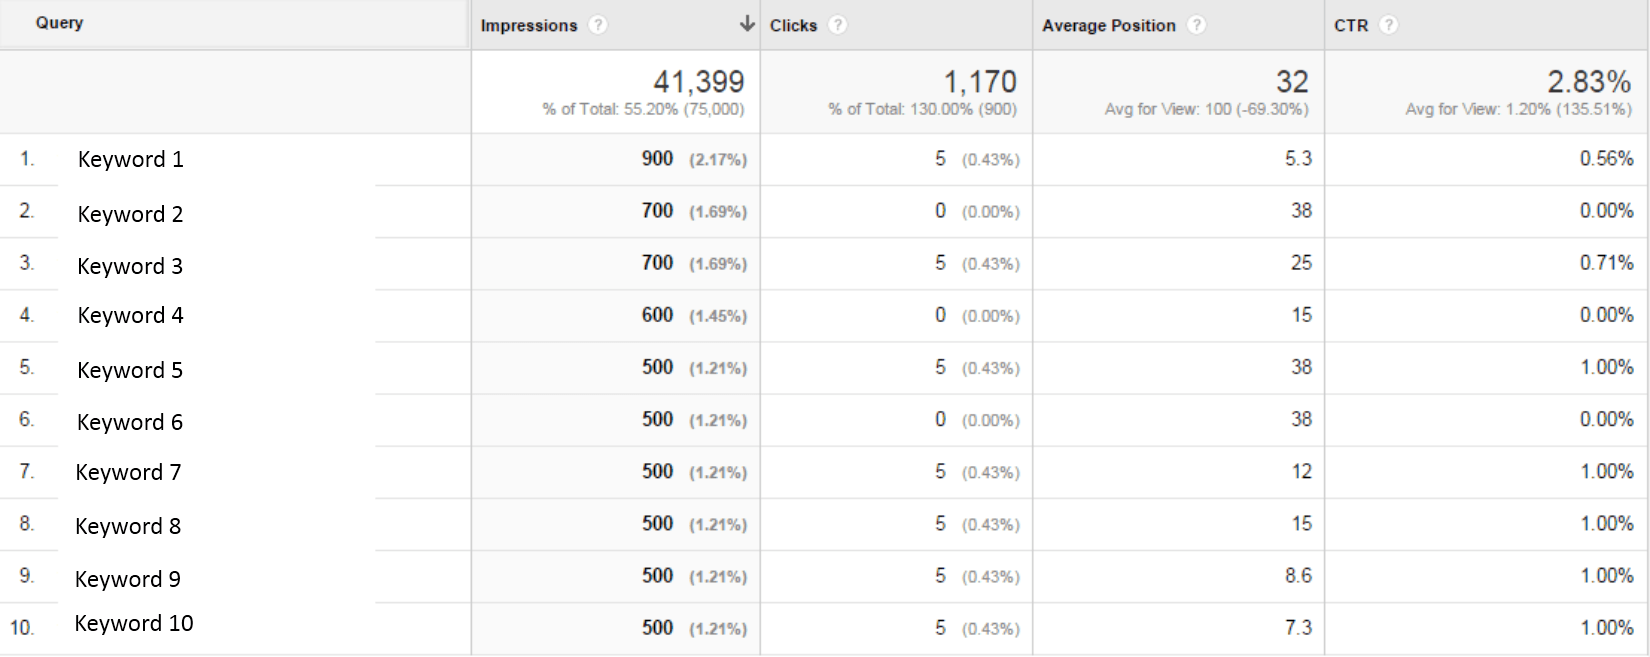
Search queries are a great sources for keyword ideas to optimize your site for. That is why you should learn how to integrate your Google Webmaster Account.
The Search Queries page shows those Google Web Search queries that have returned URLs from your site. You can also see information about the pages on your site that were seen most often in Google search results (top pages).
We all know that search queries are one of the greatest sources of keyword ideas. After the “Not Provided” move from Google, webmaster search queries are used heavily to identify new keyword opportunities.
Further Reading:
- How To Link Google Analytics to Google Webmaster Tools (Youtube – Orbit Media Solutions)
Tracking Percentage of Mobile Users
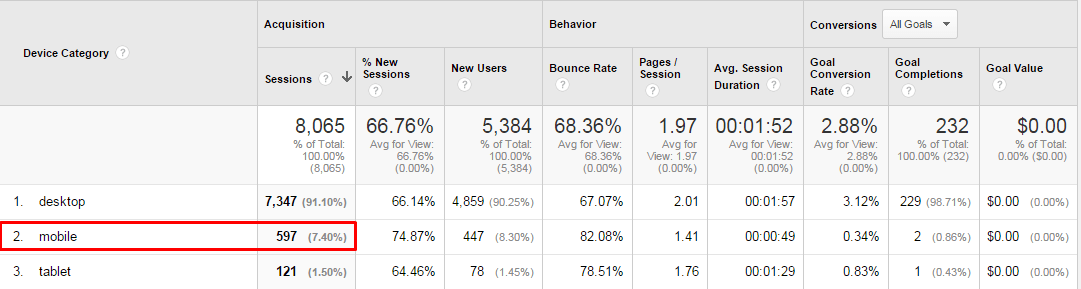
This report basically tells you the percent of your mobile users.
Since more users are now connecting via smart phone, it has become important to keep track of this report and to improve the mobile optimization strategy. I recommend checking this data every 15 days.
Further Reading:
- Which Mobile Devices Do Your Visitors Use? [Google Analytics Quick Tip] (hubspot.com)
- Google Analytics: Desktop vs. Mobile vs. Tablet Metrics (hallaminternet.com)
Monitoring Analytics Notification
Google regularly evaluates your Google Analytics tracking code, account configurationb and other analytics implementation in order to find tracking code issues. Google communicates the issues via this feature.
Resolving this issue will help you collect better Google Analytics data:
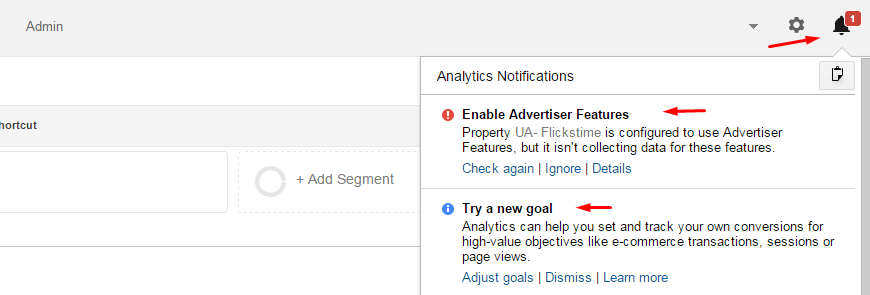
Let me give you an example of what type of notifications you can expect:
For example, if Google Analytics is aware of the fact that you have not taken care of removing the internal traffic, then it will suggest you to remove internal traffic.
OR
As shown in this example, the property does not have Demographic and Interest Report Enabled. Hence, Google Analytics will suggest you enable the report to better insight.
Since the notifications offered will help you collect better data, I recommend you to review your analytics notification tab regularly.
Further Reading:
- Fixing Google Analytics Tracking Notifications (optimizesmart.com)
Monitoring Site Search Report
Site Search is one another great report from Google Analytics. It works towards providing information about the search users input in the search box on your website.
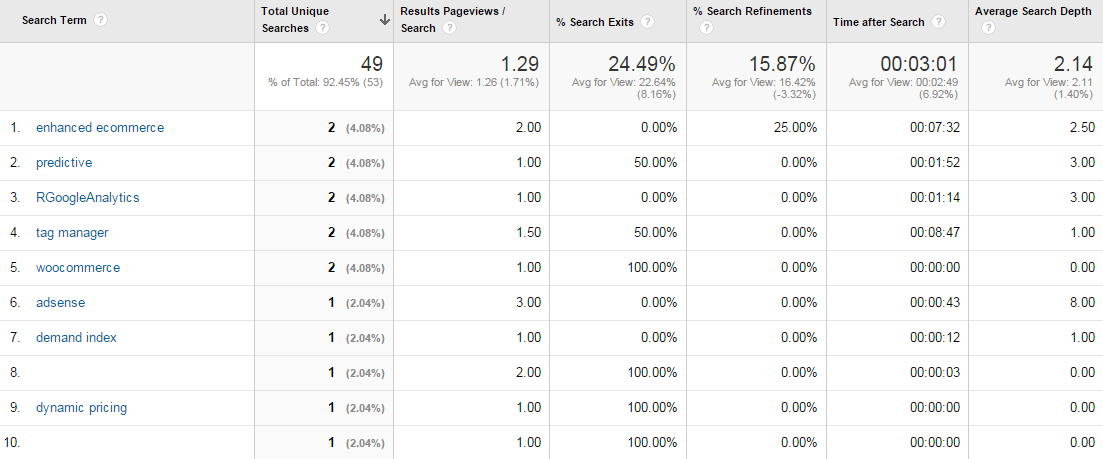
As it is helping you with user intent, you can use the information to pick those keywords and come up with some blog posts, to optimize them in the future.
Further Reading:
- How to Use Google Analytics Site Search Reports (searchenginewatch.com)
- Five Questions to Ask of Your Site Search Data (support.google.com)
Enhanced eCommerce
This is the last – and most recently added – report you shouldn’t miss.
Enhanced ecommerce is the new ecommerce reporting structure of Google Analytics. It comes with 10 other powerful reports and delivers you all the information you need to dive deep inside the behavior of your customers.
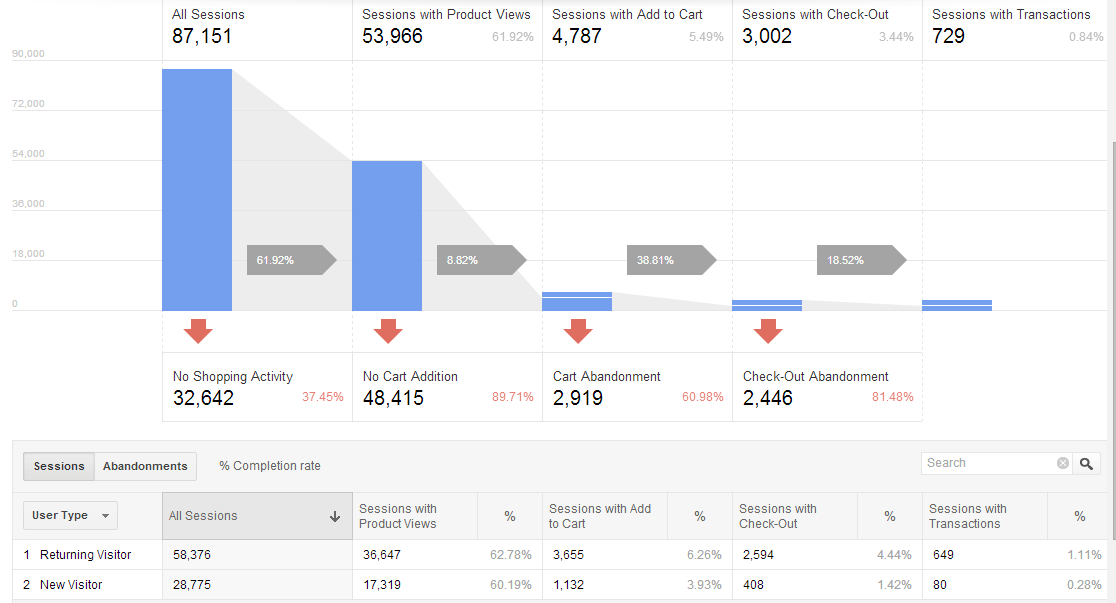
Insights you can generate from Enhanced e-Commerce:
- Which stage of your website is causing high drop-offs and leaking revenue
- The behavior pattern of New vs. Returning users on your website
- Product categories that are getting high visibility among users, but lower visibility to add to carts (ATC)
- Product categories that are getting removed on a frequent basis from the shopping cart.
- Brands which are showing better performance and generating high revenue
And much more…
Further Reading:
- Understanding Enhanced E-commerce tracking in Universal Analytics (optimizesmart.com)
- 5 Enhanced E-commerce Reports That You Need To Understand Now (tatvic.com)
The above ten points are awesome ways to generate insights from your website’s data. I hope this helps you utilize the power of Google Analytics better. I highly recommend you invest a few minutes right away to see how Google Analytics data can be molded to suit your specific needs!
You may just discover features or methods that can aid in your existing data collecting/reporting system. Last but not least, please share your your encounters with Google Analytics in the comment section below.
Happy discovering!
Image Credits
Featured Image: Created by author for Search Engine Journal
All screenshots taken April 2015
