
Content marketing is more successful than traditional marketing when it comes to communicating a product or service online.
In fact, roughly 26.4% of internet users will use ad blocking software this year, according to Statista.
With almost 4.57 billion active internet users, that equates to a lot of missed opportunities.
Why are so many people using ad blocking software?
The most commonly cited reason is that consumers want to view relevant content without distraction.
Enter content marketing.
Because content marketing gives people what they want to read, and not what they don’t, a brand can actually connect with their target audience on a personal level.
The hangup seems to be the upfront cost and confusion around how to quantify success.
Content marketing is an investment and for many companies, it takes a longer time to feel the results in comparison to the instant gratification of PPC.
The cost of content marketing varies broadly.
Depending on your business goals and resources you can expect to spend between $5,000 for a very basic strategy to $50,000 for a larger comprehensive strategy appropriate for a Fortune 500 company.
Despite this upfront price tag, 91% of B2B marketers use content marketing.
Why? Content marketing does not have an end date – it is the gift that keeps on giving.
A well-designed and optimized campaign will continue to bring quality leads to your website long after the invoice is paid.
In fact, for every dollar spent, content marketing generates 3X the leads you’d get with traditional marketing.
Your company will naturally feel and see the results of a well-designed content marketing strategy through the increase in leads and social shares.
Being able to quantify that feeling into visually compelling data instills trust and allows for greater flexibility with future campaigns.
Here’s how to measure content marketing success:
Define Success
Without a clearly defined goal, content marketing is just another channel of communication to manage.
It becomes weight – weight that neither you, your board, or clients need right now.
Never create content for the sake of creating content – or because you just think it’s what people want to read.
Creating content because that’s what you’re supposed to do will be a giant drain on resources and burn out your writers.
There needs to be a clear goal and that goal needs to be in direct partnership with the consumer’s natural behavior.
What defines success for every campaign is going to differ however there are a few solid KPIs that most businesses focus on:
- Lead generation.
- Customer engagement.
- Brand visibility.
Setting Up Campaign Goals
Lead Generation
Now that you have defined your content’s key performance indicators – or what you determine to be a success – we need to record those goal completions.
Our team prefers to use a combination of Google Analytics, Google Tag Manager and Data Studio to create interactive reports anyone can view at any time.
To measure lead generation, you must set up a custom goal for each successfully submitted form.
The following are steps to set up a new goal using Google Analytics destination tracking.
Creating a New Goal in Google Analytics
- Sign in to Google Analytics.
- Click Admin.
- Navigate to the desired View:
- Should be filtering out company IPs here.
- In the VIEW column, click Goals.
- Click + NEW GOAL
- Select Custom from the list of options.
- Click Next Step.
- Select the goal Type: Destination.
- Destination: Equals to “/campaignname_thankyou”
- Edit this to your campaign’s unique thank you page.
- Value: Assign a monetary value for how much each lead is worth.
- Click Save.
Customer Engagement
Some campaigns are designed to get content out via social networks. Here you will want to track how many viewers are sharing an article on social media or via email.
For this measurement, we have found it easiest to use GTM.
Google Tag Manager (GTM) uses trigger configurations to fire tags in response to events.
This method can be used to set up event tags that are triggered in response to clicks on links, clicks on elements, and when a form is successfully submitted.
Additional metrics to be included in the final report may be the number of clicks from the search engine result page to the landing pages, bounce rate, and pages/session.
Again, depending on the needs of the content strategy.
Anatomy of a Content Marketing Report
For those of you who don’t already know, Google Data Studio is like Google Analytics dashboards but way cooler.
It is a free reporting tool that is easy to use, customize, and share.
Because we have laid out conversion tracking in the previous steps, we can now turn this hard data into an appealing interactive report that team members can access 24/7.
Making the hard-earned increase in organic brand visibility, user engagement, and/or leads generated easy to convey and understand.

Brand Visibility
To convey brand visibility look at search impressions for the campaign’s target keyword variations and the brand’s position in the SERP.
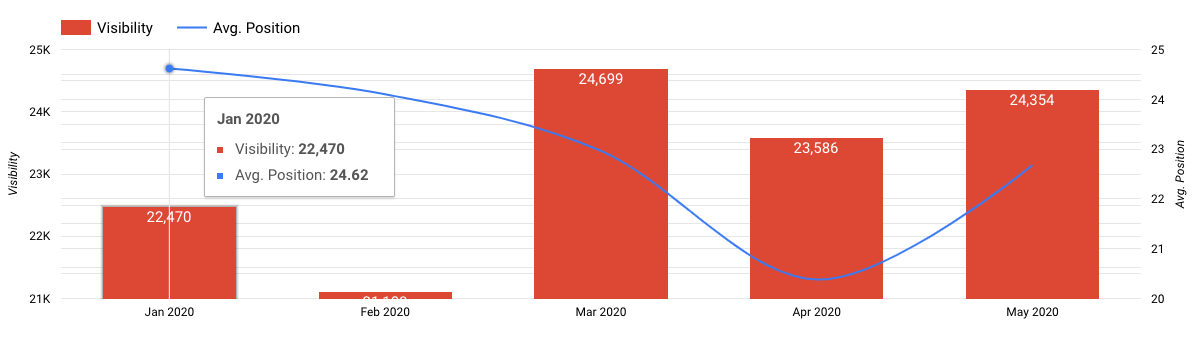
Simple Visibility Graph
- Insert a Chart: Time Series graph.
- Data Source: Search Console Site Impressions.
- Dimension: Date.
- Metrics:
- Impressions (Renamed to Visibility).
- Average Position.
- Date Range:
- Custom: This year to date (excluding today).
- Filter for the search term variations you’re targeting.
- Filter for the countries your campaign is targeting.
Voila!
This graph shows how the content marketing campaign is influencing brand visibility in the SERP for the targeted key terms without all the extra noise.
Organic Audience Engagement
Visualization goal #2 is audience engagement.
OK, so we have the content ranking for the target key terms but are consumers interested?
For this data, we like to use a table filtered to display our targeted keyword variations only. We are looking at visibility (impressions) vs. engagement (clicks.)
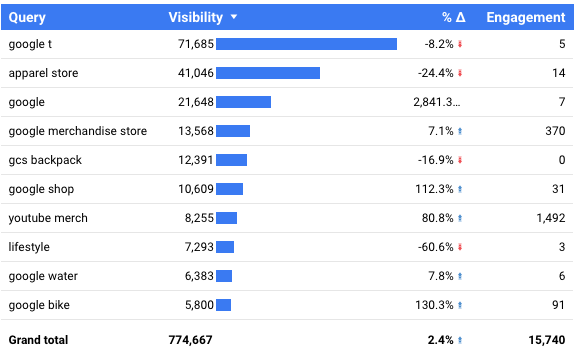
Simple Engagement Table
This is for Google Organic Search only, to pull in data from additional search engines, you will need to use a data studio “connector.”
- Insert a Chart: Table.
- Data Source: Search Console Site Impressions.
- Dimension: Query.
- Metrics:
- Impressions (Renamed to Visibility).
- Clicks (Renamed to Engagement).
- Include comparison to watch seasonal trends.
- Date Range:
- Custom: This year to date (excluding today).
- Filter for the search term variations you’re targeting.
- Filter for the countries your campaign is targeting.
Lead Generation
Saved the best for last.
This table is where our previous work setting up goals (KPIs) in Google Analytics and assigning values comes into play.
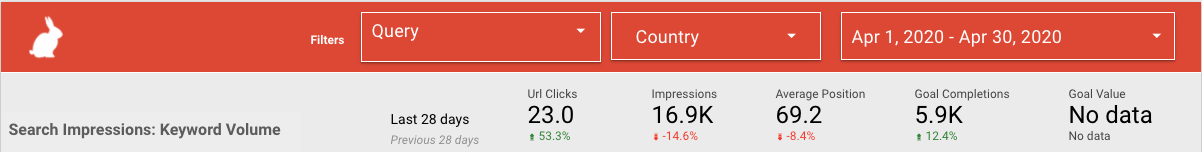
The lead generation table displays:
- How many users are navigating to the new content pages.
- How many goals are completed per page.
- What the monetary value of that content campaign is.
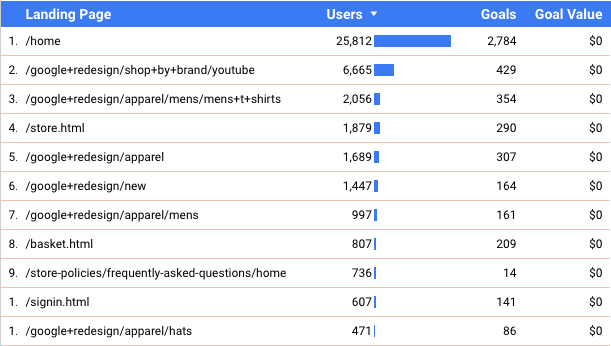
Landing Page Value Table
- Insert a Chart: Table.
- Data Source: Google Analytics Data Filtered View.
- Dimension: Landing Page.
- Metrics:
- Users.
- Goals (select the specific goals for this campaign).
- Goal Value.
- Show Summary Row.
- Sort by Users, Goals, or Goal Value.
- Date Range:
- Custom: This year to date (excluding today).
- Filter for URLs of the content campaign.
Content Marketing Wins Summary
Across the top of the content marketing report, highlight major wins for a high-level snapshot:
Search query impressions.
- URL clicks.
- Pages per session.
- Goal completions.
- Goal value.
The possibilities in Data Studio are endless.
It gets even cooler when you start adding MCF assisted conversions to show which LPs have contributed to all conversions.
Content Marketing ROI
Content marketing ROI seems hard because campaigns can stretch over months and the leads generated continue long after.
Return on investment is calculated by dividing the goal value by the cost of your content marketing implementation: strategy, writers, search engine optimization, management, etc.
Content Investment
First, you need to know the cost of your investment. Add up the expense for each step involved in creating, launching, and reporting on a campaign.
For example:
- $3,000 campaign strategy.
- $5,000 for 4 articles, 1 landing page and 1 downloadable or quiz.
- $2,000 search engine optimization + reporting.
Total Content Marketing Investment = $10,000 per campaign
Now, let’s calculate the return.
Return on Content Marketing
Jot down the average percent of leads (or downloads) that turn into a sale. And, what the lifetime value of that partnership is.
In other words, what is the average consumer’s profit margin over the course of their relationship with your company?
Number of Customers Example:
- Campaign average monthly traffic: 5,000
- Conversion rate to lead: 2%
- 100 leads
- Closing conversion rate (lead to sale): 2%
- Customers attributed to the campaign per month: 2
Customer Lifetime Value Example:
- Average customer contract is $90,000
- X average duration (3 years) = $270,000
- Profit margin per client is 15%
- Average customer lifetime value is $40,500
Projected Profit:
- CLV x # of new customers = $81,000
Content Marketing ROI Formula
Content marketing ROI can be calculated by multiplying customer lifetime value by the number of new customers per month minus cost of investment divided by cost of investment.
Example Continued:
($40,500 x 2) – $10,000 / $10,000
($81,000 – $10,000) / $10,000
$71,000 / $10,000 = 7.1
The ROI for this content marketing campaign example is 710%.
How Soon Can You Expect to See the Return?
How soon you will begin seeing a return on the content marketing investment varies depending on traffic to your landing pages, conversion rate optimization, and sales team closing rates.
When content strategies are intentional and built on a solid audience analysis, you can begin seeing results as early as two weeks of indexing.
You arrived at this article looking for a way to measure content marketing success and left with some ideas to communicate effectiveness and return on investment – helping board members make clear decisions on where to spend marketing resources.
More Resources:
- Content Marketing: The Ultimate Beginner’s Guide to What Works
- 5 Creative Ways to Boost Your Content Marketing ROI
- Content Marketing KPIs: Your Guide to Picking the Right KPIs for Content
Image Credits
Featured Image: Created by author, May 2020
All screenshots taken by author, May 2020
