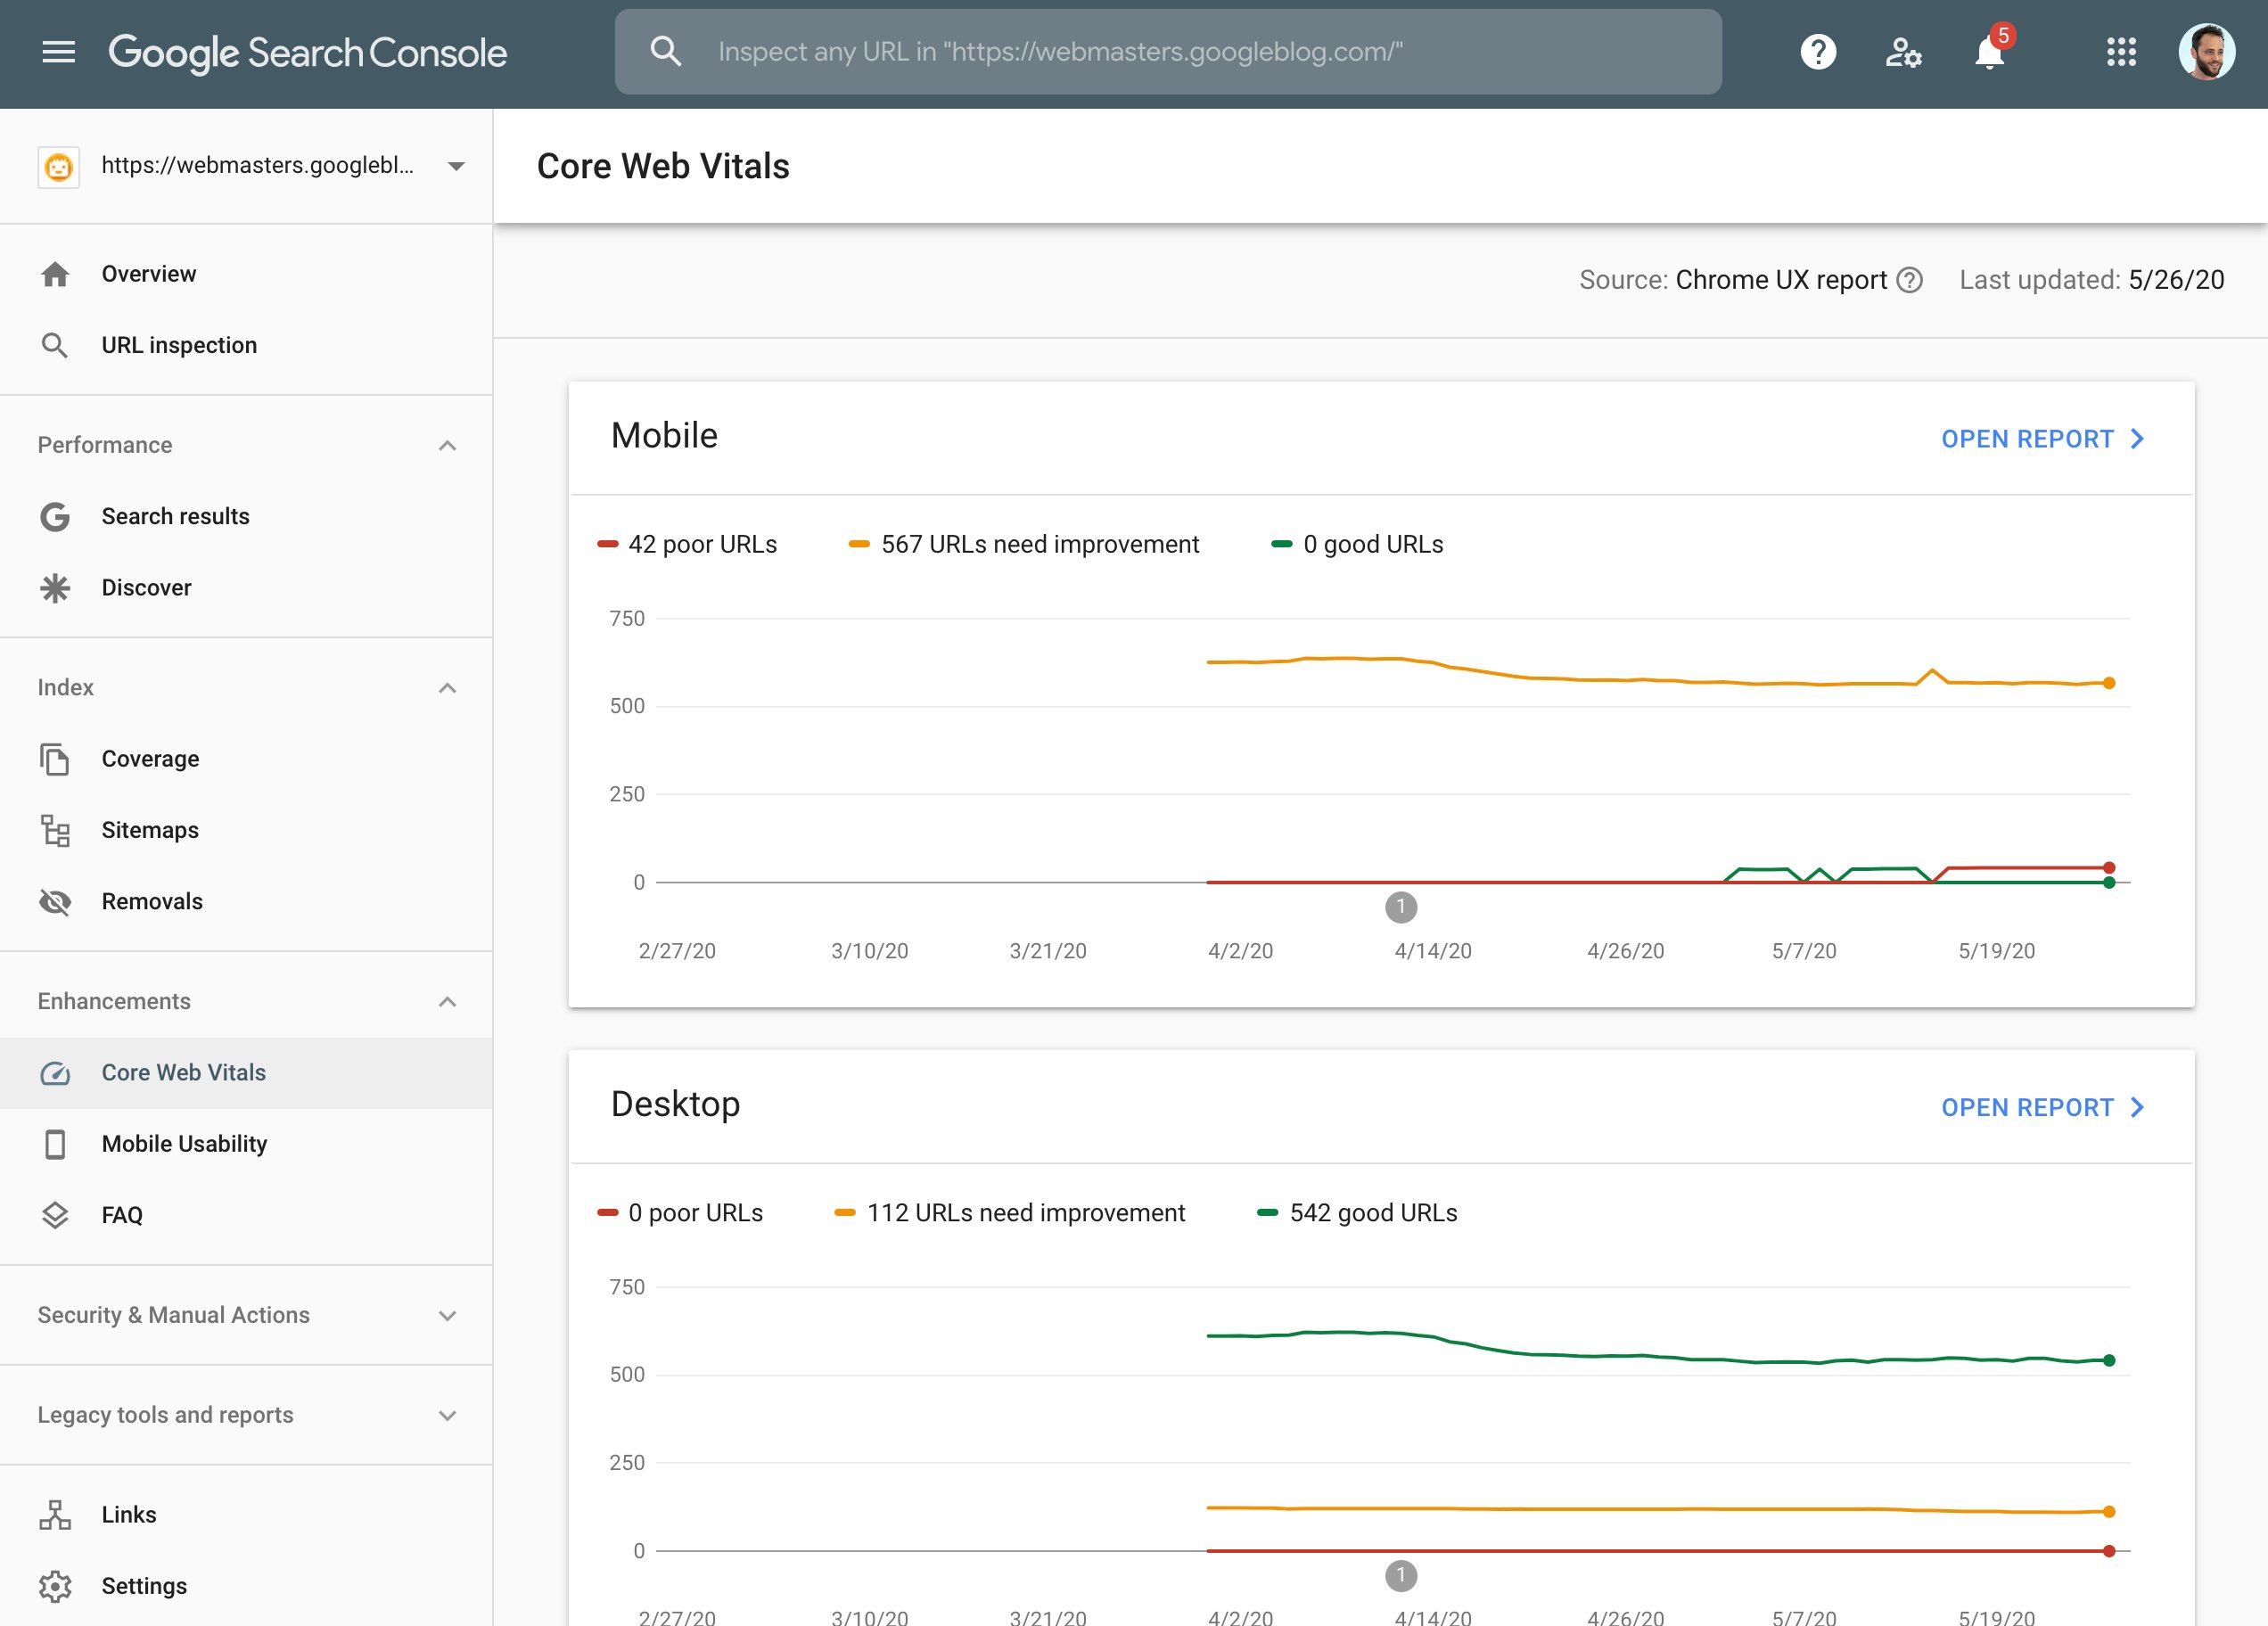
Google’s Core Web Vitals, a set of metrics deemed essential to delivering a good user experience, now have their own report in Search Console.
Core Web Vitals were first introduced earlier this month as a way to measure the quality of the user experience provided by a website.
Google considers these metrics “critical” to all web experiences, and is now providing site owners with an easy way to measure them.
See: Google’s Core Web Vitals to Become Ranking Signals
Measuring Core Web Vitals in Search Console
Google is rolling out a Core Web Vitals report in Search Console which will replace the old Speed report.

Replacing the Speed report with the Core Web Vitals report goes to show how Google’s thinking has evolved regarding user experience.
There’s more to keeping users happy than having a site that loads fast.
In order to provide a good user experience, according to Google, a site needs to meet certain expectations for loading, interactivity, and visual stability.
With that said, let’s take a look at what exactly are the Core Web Vitals.
What are the Core Web Vitals?
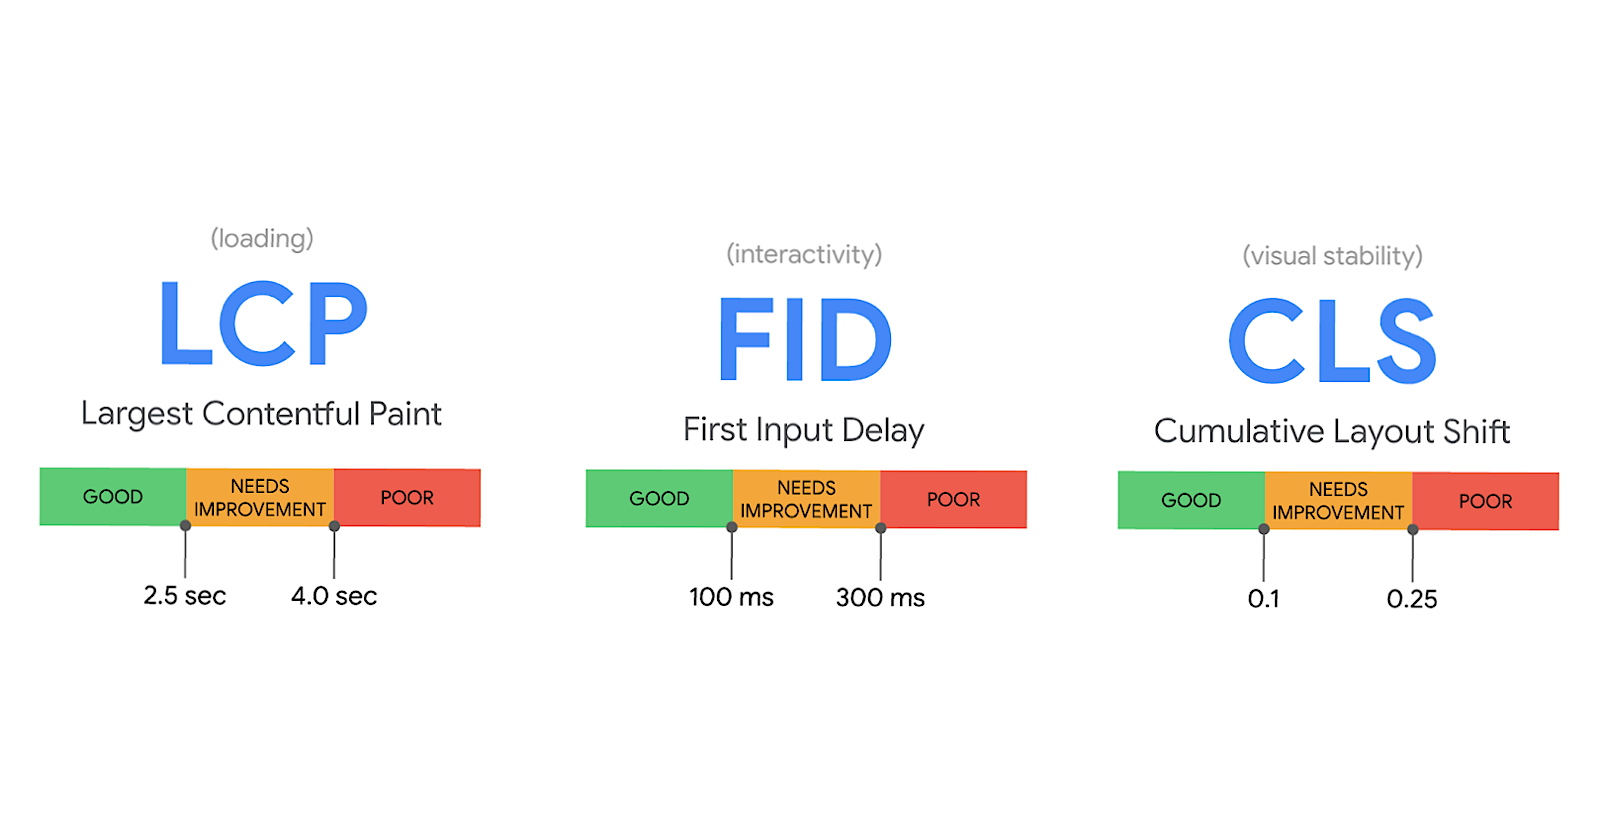
These three metrics represent the 2020 Core Web Vitals:
- Largest Contentful Paint: measures perceived load speed and marks the point in the page load timeline when the page’s main content has likely loaded.
- An ideal speed is 2.5 seconds or faster.
- First Input Delay: measures responsiveness and quantifies the experience users feel when trying to first interact with the page.
- An ideal measurement is less than 100 seconds.
- Cumulative Layout Shift: measures visual stability and quantifies the amount of unexpected layout shift of visible page content.
- An ideal measurement is less than 0.1.
Why are these metrics more important than others?
Google rationalizes choosing these metrics as the Core Web Vitals because they: capture important user-centric outcomes, are measurable, and have supporting lab diagnostic metric equivalents.
Reading the Core Web Vitals Report
Here’s how to make sense of what you see in the new report.
The Core Web Vitals report shows URL performance grouped by status, metric type, and URL group (groups of similar web pages).

On the Overview tab you can toggle between ‘Poor,’ ‘Needs Improvement,’ or ‘Good’ tabs.
From one of those tabs, click Open Report to see the page performance numbers for mobile and desktop.
You can click on individual rows in the table to see details about URL groups affected by a specific issue.
If this sounds similar to navigating other reports in Search Console, it’s because the Core Web Vitals report works exactly the same way,
Improving Core Web Vitals
Google recommends fixing everything labeled “Poor” first, then prioritize what to do next based on issues affecting the most URLs.
Non-technical users may need the assistance of a developer to fix specific issues.
If that’s the case, then you can download the and of the reports and send them to the person assisting you.
Google says some of the most common page fixes should include:
- Reduce your page size to less than 500KB.
- Limit the number of page resources to 50.
- Consider using AMP.
Like other Search Console reports, when an issue is fixed it can be validated directly within the Search Console report.
Source: Google Search Console Help


