

As of July 1, 2023, the version of Google Analytics we have used for 10 years will stop processing hits.
This is a major change, and it means that Google Analytics 4 (GA4) will fully replace Universal Analytics (UA).
The good news is there is still time – but you can’t keep putting off learning GA4.
Consider this article your training wheels for navigating GA4.
Here’s you’ll learn where to find the most important information about your marketing efforts, including:
- Site traffic.
- User engagement.
- Events.
- Conversions.
Universal Analytics vs. GA4: What’s The Difference?
You’ve probably always referred to Universal Analytics as simply “Google Analytics.”
So, before we jump into the details, we should quickly cover the significant differences between the two versions.
Universal Analytics was session-based and used hit types such as page hits, event hits, and social interaction hits.
Google Analytics 4 is event-based; all hits like “pageview” are now events.
This is an incredibly oversimplified explanation, but that’s it in a nutshell.
If you’re interested in the technical details, you can read Google’s documentation here.
GA4 Training Wheels: How To Pull 4 Strategic Reports
If you’ve looked under the hood at GA4’s new interface and decided, “No, thank you,” you’re in the right place.
The interface and terminology are different from the version you’ve known since 2012, so finding what you need may feel complicated and clunky.
Be assured that a lot of your hard-earned knowledge and skills do carry over!
Things look different, but the basics of analysis remain the same.
Here are four GA4 tips to get you up and running.
Note: These tips assume you have already set up a GA4 properly. If you have not, this complete step-by-step guide on setting up GA4 with Google Tag Manager can help.
1. Site Traffic
Let’s start with the basics. How will you know if your marketing efforts are resulting in site growth?
To measure site traffic, you can look at users or sessions.
Users represent an individual who visited your website.
Sessions represent “visits” or the different times a user visited your site.
The metric (quantitative measurement) you use is up to you. Just be sure you choose one and stick with it.
Understanding Site Traffic Reports
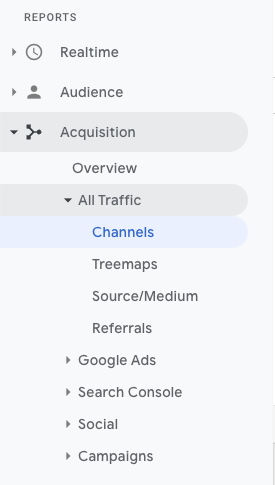
In Universal Analytics, we used to open the Acquisition > All Traffic > Channels report.
 Screenshot from Google Analytics, March 2022
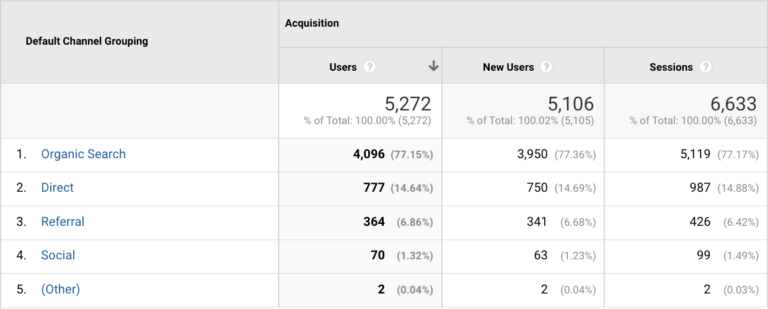
From here, we could see users, sessions, bounce rate, and conversions by marketing channel.
 Screenshot from Google Analytics, March 2022
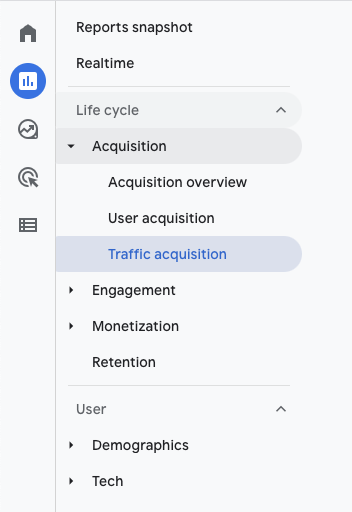
To view site traffic metrics in GA4, open the Life cycle > Acquisition > Traffic acquisition report.
 Screenshot from Google Analytics, March 2022
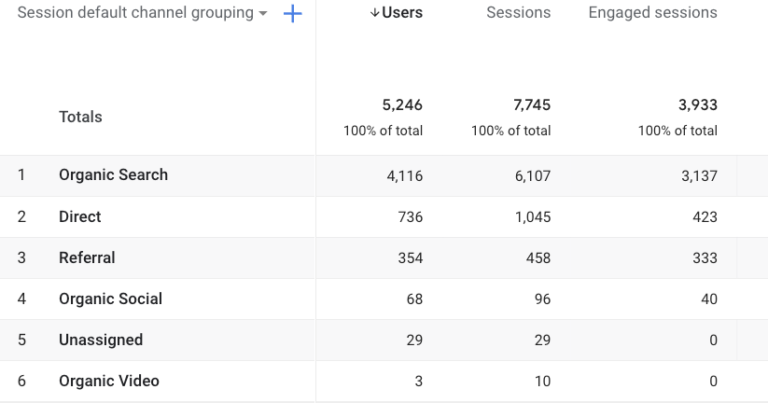
Traffic acquisition automatically reports using default channel grouping.
 Screenshot from GA4, March 2022.
Default channel grouping is a grouping of related traffic sources.
For example, the “Organic Search” grouping in GA4 consists of any traffic source that matches a list of search sites or when the traffic medium exactly matches Organic.
Read more about how Google classifies your site traffic into channel groupings here.
Why Do User Counts Not Match?
At this point, you may be thinking, wait, something is wrong with GA4.
The numbers of Organic Search Users in Universal Analytics and GA4 do not match.
Nice catch!
In the above examples, UA shows 4,096 users from Organic Search and GA4 shows 4,116 users from Organic Search for the same time period.
There are a few reasons why the data will not be the same.
If you had set up filters in UA, it’s not really an equal comparison because GA4 does not currently support filters.
GA4 shows “active users,” whereas Universal Analytics focuses on total users, and the default channel groupings are defined differently.
You can read more about all the differences in GA4 user counts here.
2. User Engagement
Now that we know where users are coming from, we need to understand what content they engage with.
By viewing user engagement metrics for article pages, we can learn what types of content to produce more of (high engagement) and which topics require further analysis (low engagement).
Understanding User Engagement Reports
In Universal Analytics, you may have used bounce rate or time on page to determine whether or not the content satisfied a user’s search query.
Bounce rate is often a misunderstood metric as it does not actually tell us the percentage of users that landed on our page and immediately left.
It only tells us the percentage of visitors who did not send a secondary hit to Universal Analytics.
In GA4, you will not find “bounce rate.”
You will find user engagement metrics based on engaged sessions.
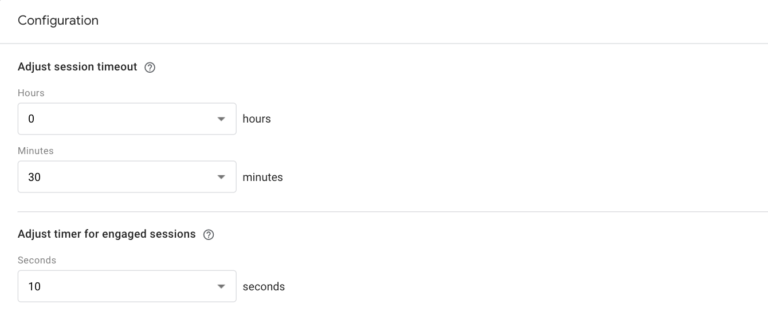
Engaged sessions provide more context to understanding users’ behavior on-site because an engaged session includes any user that has spent at least ten seconds on a page.
You can adjust this length of time from the default 10 seconds up to 60 seconds within Data Stream > More Tagging settings.
 Screenshot from GA4, March 2022.
Engaged sessions are great for blogs and publishers because it accounts for when a user may have had a positive experience reading or watching a video without triggering a secondary hit.
To view engagement metrics in GA4, open the Life cycle > Acquisition > Traffic acquisition report as we did in the previous report to find site growth.
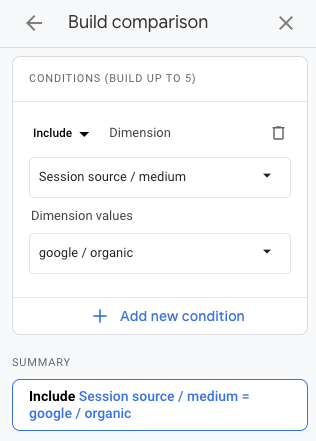
But we don’t want to view by default channel grouping; we want a more detailed view, so click Add comparison in the top left.
Then add a new dimension for session source/medium.
For example, Google/Organic.
 Screenshot from Google Analytics, March 2022
Clean up your report by clicking on the x to remove All Users.
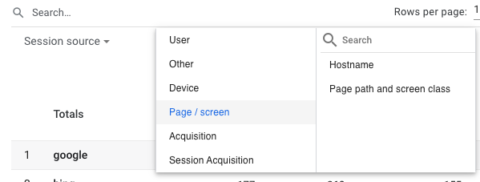
For your table, click on the blue plus sign and add a secondary dimension for page path and screen class.
 Screenshot from Google Analytics, March 2022
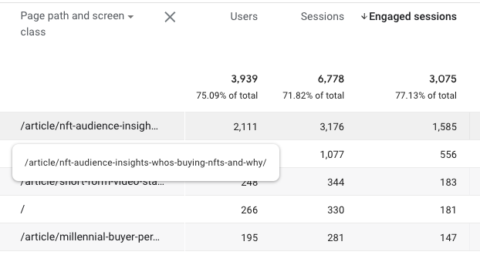
Lastly, click on the header of the engagement sessions column to switch the table from highest to lowest.
Clicking on the header again switches the table from lowest to highest.
In the example below, Google organic search users are interested in NFT audience insights.
Creating more audience insights content may increase site traffic.
 Screenshot from Google Analytics, March 2022
3. Events
Up until now, you may not have thought about events at all.
An event measures a user’s interaction with your website.
The action does not necessarily need to align with business objectives.
For example, clicks on outbound links and video plays are events that can tell us important information about user behavior, but they don’t make us money.
Remember that GA4 is event-based, so several events are automatically collected, such as first_session, sessions_start, user_engagement, and more for mobile apps.
There are also “enhanced events” you can enable, which include page_views, scrolls (more than 90% of page height), outbound clicks, site search, view engagement, and file downloads.
If you have not yet, I highly recommend enabling enhanced events now.
To enable enhanced events in GA4, click the gear icon in the bottom left of your screen and select Data Streams located under the Property column.
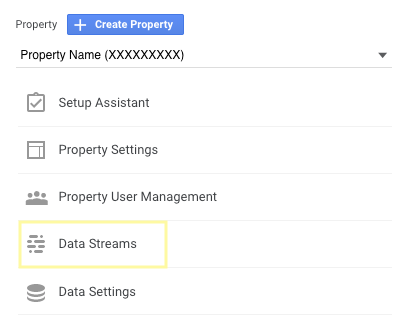 Screenshot from GA4, March 2022
Next, select your data stream and click the gear icon under Enhanced measurement.
Here you will toggle all current and future relevant events for your site.
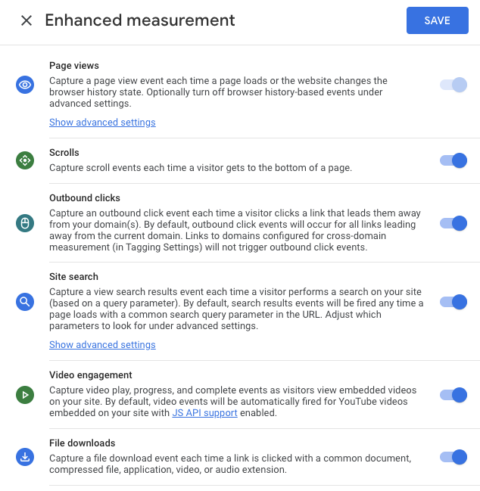 Screenshot from GA4, March 2022
Most user interactions on your site will fit into one of the above five enhanced measurement events, which can be modified to create specific events.
When you’re ready for a more advanced GA4 tutorial, click here to learn how to modify and create new events.
Understanding Event Reports
In Universal Analytics, we would view Behavior > Events > Pages report to see which pages.
 Screenshot from Google Analytics, March 2022
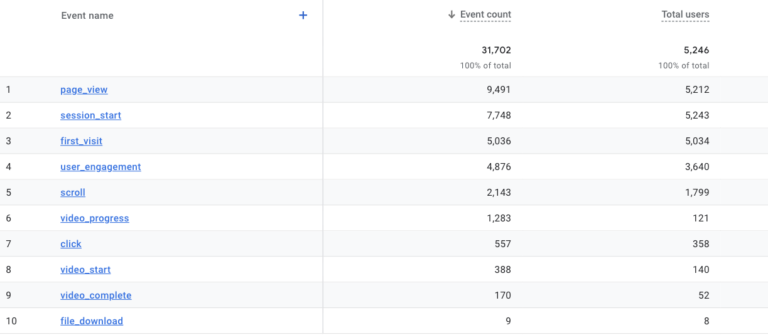
From here, we could see things such as the total events and how many of the site sessions had an event occur.
You would drill down by event category.
 Screenshot from Google Analytics, March 2022
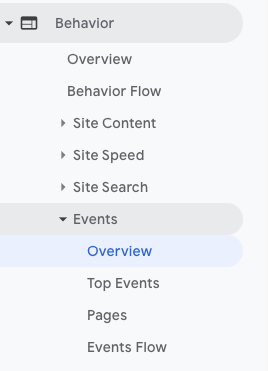
To view user event metrics in GA4, open Life cycle > Engagement > Events report.
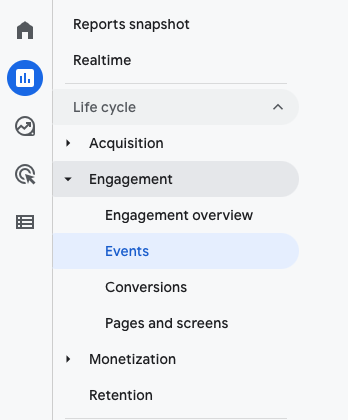 Screenshot from GA4, March 2022
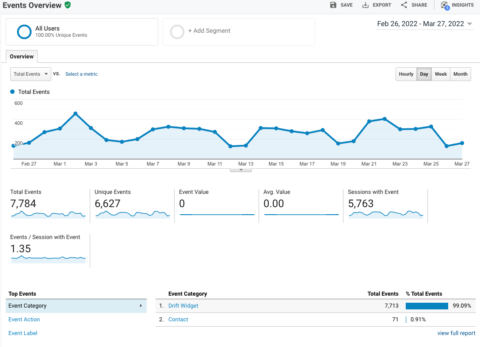
The events report shows all automatically collected events and any enhanced measurement events you’ve added.
 Screenshot from GA4, March 2022.
There isn’t an easy way to “drill down” and see which marketing channels or pages these events occurred within GA4 generic reports.
Clicking on the event name pulls up an overview dashboard with what I would describe as mini-reports in “snapshot cards.”
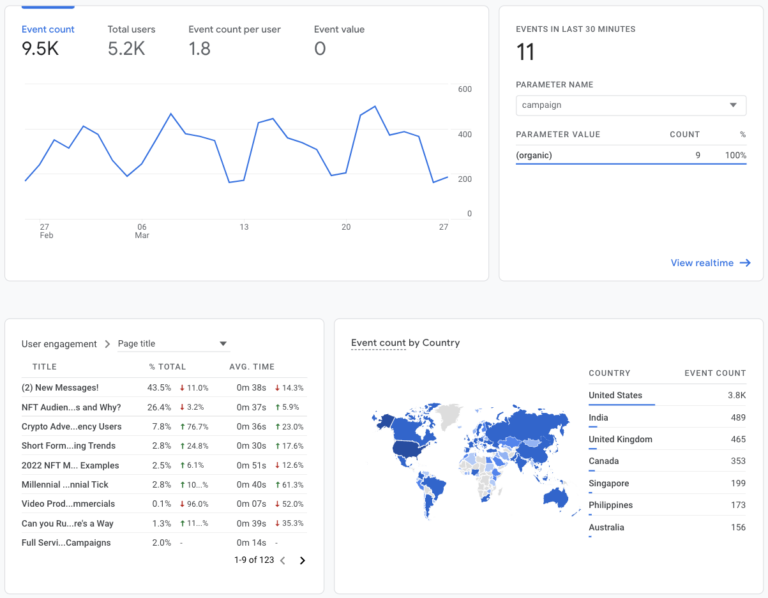 Screenshot from GA4, March 2022.
In the above example, we can see event count over time as a line graph, events in the last 30 minutes as a table, user engagement metrics by page, and event count by country, but the world map is not interactive.
4. Conversions (Goals)
Arguably the most important report, this shows whether or not our marketing effort is meeting business objectives.
We use conversions (in UA this was named goals) to measure user activities that contribute to the success of your business.
For example, when a user completes a form, interacts with a chatbot, or downloads a file.
Currently, GA4 has five pre-defined conversions that are automatically tracked in GA4.
The trouble is that most of the automatically tracked conversions only apply to apps, aside from purchases, which are web and app.
So, you will need to tell GA4 which events you consider to be a conversion.
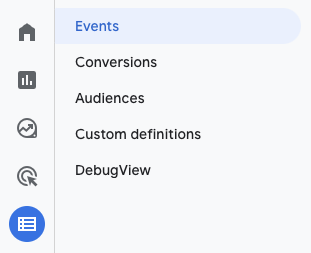
To mark an event as a conversion in GA4, click Configure > Events.
 Screenshot from GA4, March 2022.
Locate the desired conversion in the existing events table and click the toggle on the far right to mark the event as a conversion.
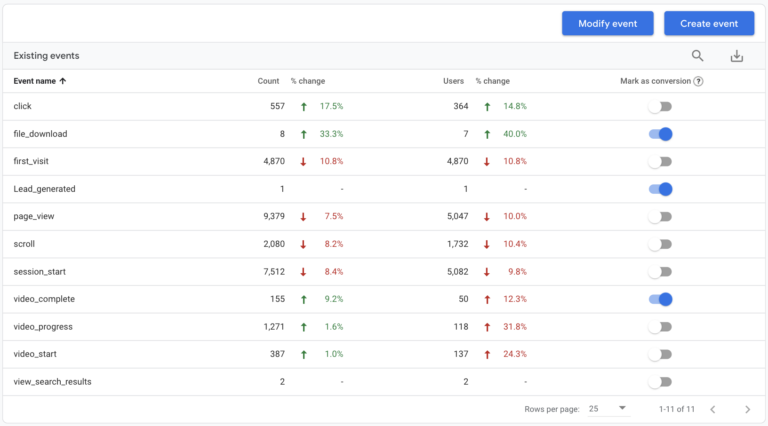 Screenshot from GA4, March 2022.
Gray means the user interaction will record as a regular event.
Blue means that the event will also display as a conversion.
Understanding Conversion Reports
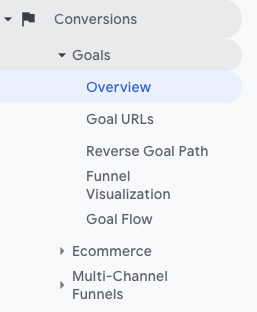
In Universal Analytics, we used to click on Conversions > Goals > Overview to see the number of goal completions by name and location or page path.
 Screenshot from GA4, March 2022
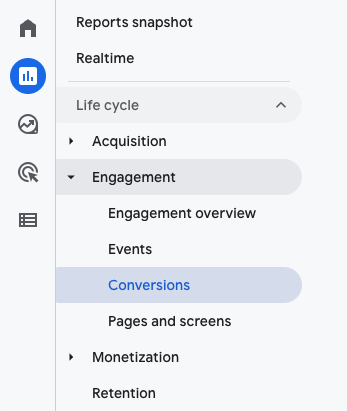
To view Conversions in GA4, open the Life cycle > Engagement > Conversions report.
 Screenshot from GA4, March 2022
Here you will see automatically collected events and any event that you manually marked as a conversion.
 Screenshot from GA4, March 2022
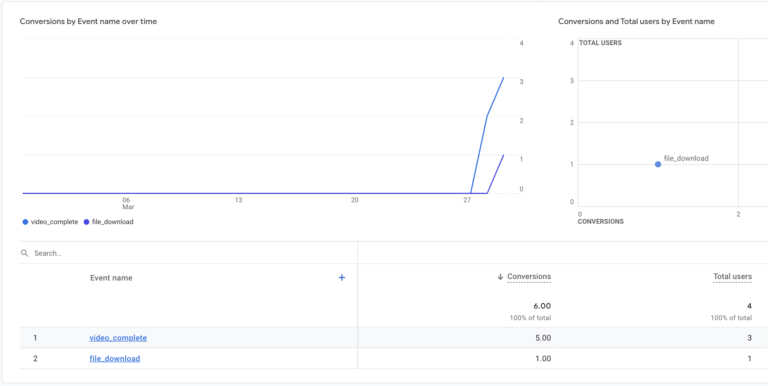
You may want to analyze conversion events in-depth.
Click on the blue event name to view conversions by marketing channel or page.
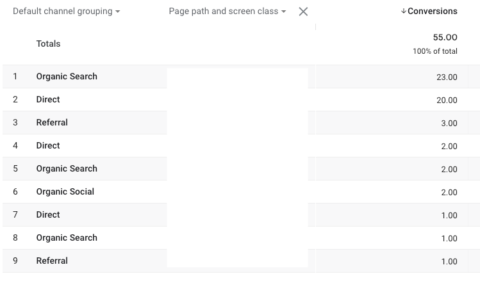 Screenshot from GA4, March 2022
In this example, we have clicked on “file_download” and added a secondary dimension of “Page path and screen class.”
This screen shows which pages had the most conversions and which marketing channel the user came from.
Final Thoughts
Now that Google has set a date as to when Universal Analytics will be deprecated (July 1, 2023,) it’s time to get serious about creating measurement strategies, migrating data, and educating your team on GA4.
I highly recommend using Google Tag Manager to migrate to GA4 to transfer some of your Universal Analytics tags.
To get the most out of GA4, create events to track user interactions with your site that align with business objectives.
While the technology and terminology have changed, your general analytics knowledge can translate over.
It’s a matter of getting comfortable navigating the new interface, and the best way to do that is to start using it.
Stay tuned! We’ll talk more GA4 tips and tricks in upcoming articles.
More resources:
- 7 GA4 Features That Will (Hopefully) Make You Hate It Less
- New Integration For GA4 And Search Ads 360
- The Complete Guide to On-Page SEO
Featured Image: Fonstra/Shutterstock
