

For years, SEOs have faced multiple paths when it comes to career development options.
For some, the general options involving web development or traditional marketing roles have dominated the conversation, leaving out the data wonks out in the cold.
While there’s a massive benefit in mastering Excel for SEO, you may want to complement your current career with something a bit more challenging like data science.
Let’s dive into the basics of understanding how data science works for a search marketer’s workflow and how using R can help you on your career development path.
First Things First: The Basics Always Matter
It’s one thing to be able to copy and paste code and run scripts – many of the greats began their career that way by deconstructing pre-existing work and learning along the way. But in order to level up to greatness with data science, you’ll need to focus on the whole package over time.
The three big supporting avenues I recommend dedicating time to include the following, which we’ll discuss as we go along:
- Statistics: Why all data isn’t created equal.
- Analytics: How to use Google Analytics and general analytics platforms.
- Tools and Support: Understanding how clean code, version control, and being able to explore the greater community of those who’ve been in your position before and seek advice.
Remember: When it comes to learning something as monumental as data science, take it one step at a time and enjoy the ride.
Now, in order to begin basic data science principles, let’s cover general guidelines that you’ll want to master over time.
Understanding How Data Visualization Works
Data visualization is exactly just that: being able to show the data in a way that speaks volumes in a visual manner.
With Google Analytics, many SEO professionals use the traditional line chart to explore data for insights and communicate to clients the cause and effect associated.
Line charts, however, are horrible at showing relative proportions (as opposed to pie charts) or comparing data (as opposed to bar charts). Knowing this, in general, is critical in our line of work.
Far too often, conveying a simple message turns into wasted effort in having to verbally explain the situation when a proper chart could have done it in seconds.
For data visualization in R, I recommend installing the ggplot2 package first. When learning ggplot2, not only do you receive the benefit of working with a structurally sound syntax, but you also have the added benefit of learning about visualization principles simply by coding.
Why Is Data Visualization Important for SEO?
Simply put, if you can’t visually speak to the site’s performance, be prepared to vocally speak to the confusion and objections.
Data visualization is nothing new to a search marketer. On a daily basis, we deal with pie charts, line charts, and on occasion, let out a collective groan when we try and explain to a client or a colleague the merits of scatter plots.
Understanding when to use a specific chart or graph is quite simple once you get the gist of why each one has its benefits in communicating the story clearly.
Data Wrangling – Collection, Transforming, and Getting ‘Tidy’

The best part about beginning to understand the basics of data scientist as an SEO is that you likely have access to an exorbitant amount of data at your fingertips.
Being able to draw from Google Analytics, Google Search Console, YouTube, Twitter, and even Spotify can be a blessing, but given the different processes that require each data pull, being able to align multiple streams in a manner that remain accurate, relevant, and free of “bugs” can make or break both trust and any decisions that come from the data.
But let’s not get ahead of ourselves. Before we report, we’ll need to follow these general steps:
1. Collecting Data
Using a tool like R and RStudio, we can pull in data from a number of sources using pre-made packages developed for integration with Google tools such as Search Console, Analytics, AdWords, and even Sheets. But it doesn’t stop there!
If you have access to a database such as CloudSQL, PostgreSQL or MySQL, there’s a package for you too.
Odds are, anything that you can dream of collecting, it can be done using R.
Once you’ve imported your data, now it’s time to turn it into something useful, in a format that works for your needs.
2. Transforming Data
Once you’ve imported your data, now it’s time to sort it all out in a manner that tells the story. Using the dplyr and tidyr packages, you can filter, arrange, select, and group large segments of data with relative ease.
Of course, this can also be done with your favorite analytics package of choice, but what about cases where you’d like to compare keyword data from BrightEdge or Nozzle with Google Search Console, Analytics, and AdWords? How about also throwing in CRM data from a database?
This is where data science and R shines.
Optional: Storing Your Data
If you’re finding that the amount of data that you’re handling is simply eating up your local storage, or you’re having trouble sharing your data with others, you’ll need to think about storage. Fortunately, there are packages for these problems as well!
Some of the well-known options for this include:
- BigQuery via the bigQueryR package, which is both fast and relatively cheap for handling data by the TB.
- Google Cloud Storage via the googleCloudStorageR package, which is ideal for situations where integration with other Google Cloud applications are a concern.
3. Showcasing Your Data
Now that you have the data processed and where you want it, how can you deliver it to the intended recipient? Fortunately, you have a number of options for output based on the use case:
- Shiny
- RMarkdown
- White-label logins
- Scheduled emails
Why Is Data Manipulation Important for SEO?
Think about data manipulation as a muscle that many SEOs often fail to develop. For many of us, we’ve had it easy, allowing tools such as Conductor or BrightEdge to do the integrations for us and provide us with on-demand reporting solutions.
However, we often have to settle on which data sources to speak to and how, consequently struggling to tell the entire story.
Because we now have the knowledge that anything can be reported on and combined using proper data manipulation steps, being able to speak to the entire customer journey in full detail is made much easier once you get the hang of it.
Go Back to School: Fall in Love with Statistics
Before you throw your hands up in defeat, hear me out.
Understanding Statistics isn’t imperative when you’re first learning how to work with a programming language or even collecting data. However, if you want to be the data analyst who can tell the story both concisely and accurately, you’re going to need to learn statistics.

Why Is Statistics Important for SEO?
Take a deep breath and really think about that question for just a second.
Statistics is important, period!
If you’ve spent any amount of time in a digital marketing environment, you’ve likely witnessed skewed data in action.
Imagine that you have a client report in front of you for the previous month, and you’d like to speak to the site’s organic search performance as it pertains to end-user acquisition. You find that the time period shows a massive spike in both organic traffic and impressions, and you’d like to take credit for this amazing month-over-month turnaround:
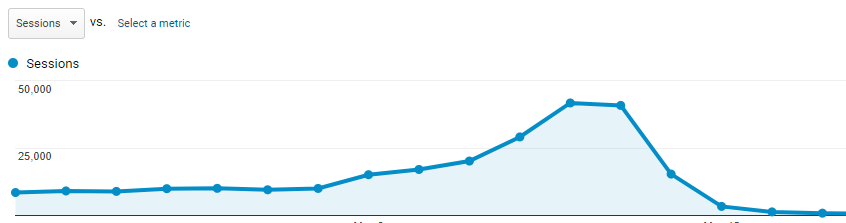
“We saw a 4 percent increase in organic traffic when looking at year-over-year performance for organic search, but more impressive is the 77 percent uptick in November versus October, which was also up nicely from September! Because weekly traffic shot up in late November, we expect this to continue into December because we survived Google’s recent algorithm update…”
Now imagine that the client is an e-commerce in the retail industry, and it’s early December. By reporting on their website’s November performance at face value, you’ve created a false narrative to the client built upon unreasonable expectations, failing to understand how negative skew can shape data trends without also speaking to distribution.
By being able to understand how mean, median, and mode can throw off face-value data and how the distribution of data being collected (along with the marketing brain telling you that an e-commerce taking part in Cyber Monday deals may see an uptick not because of you, but because of the calendar) will all have a hand in telling the story with fidelity.
In short: Nobody wants to have corrupted data, but even fewer would want to act upon the lessons learned from it.
R vs Python: Pick a Side and Stick with It (For Now)
Among the first things you’ll discover on your path to becoming a data science is the analysis paralysis that’ll come if you haven’t yet picked a programming language to center your efforts on.
Both R and Python frequently appear in the data science discussion, but for this exercise, let’s focus on R’s usage:
![]()
Why Use R as Your Language?
While R has a steep learning curve, once you get the hang of it, it’s quite a breeze to use. For the experienced programmer, learning R shouldn’t be much of a chore.
When it comes to data analysis, both R and Python can handle the task. Python takes advantages of a number of IDEs and libraries that take advantage of a general-purpose programming language (versus R, which is often seen as a “math language”).
Both come with strong support generated from its worldwide users and documentation notes, and while adoption rates favor Python, R usage continues to grow among a broad range of industries and data scientists.
That being said, R is:
- Easy to contribute to, with a huge number of packages that can be installed with a single line of code.
- Easier for beginners to perform exploratory work, even without the use of additional packages.
- By itself, not ideal for sharing work online, but using the R-based framework Shiny tips the scales in R’s favor.
- Ideal for heavy statistical analysis and math needs.
A Simple Exercise Using R to Display Search Console Data
Let’s put some of this knowledge to use. Follow along and I’ll explain the thought process behind each step:
First, you’ll need to download and install R. Follow the steps and go with the recommended install steps if this is your first time.
Next, I highly recommend doing the same with RStudio. This is the IDE that you’ll be working out of, and it requires an installation of R to function.
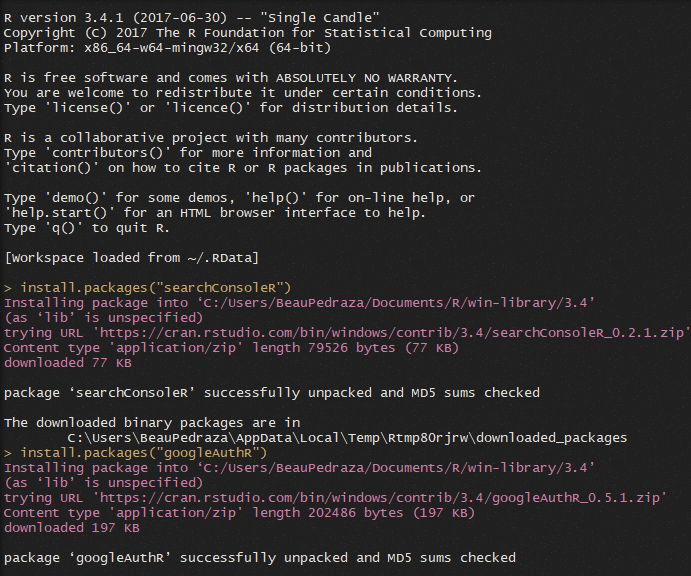
Now that you’ve got those two running, launch RStudio and install the following packages, hitting Enter after each line, where you should see a success message for each:
install.packages("searchConsoleR")
install.packages("googleAuthR")
With searchConsoleR, this is the package where we can interface R with GSC. googleAuthR is the Google API client that authenticates you with your data.
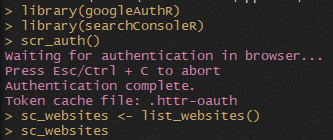
Once both packages are installed, now it’s time to load the libraries, one at a time:
library(googleAuthR)
library(searchConsoleR)
You’ll know they’ve loaded if you don’t see any error messages (and a new line appears). Now it’s time to authenticate with Google! Enter the following line, and you should have a browser window open:
scr_auth()
Verify the user that has access to the Search Console property that you’ll work with. Now, let’s see which properties that you have access to via Search Console:
sc_websites <- list_websites()
You’ve just assigned the entire list of properties to the sc_websites variable! Run the variable and see if your properties appear:
sc_websites
If you did it correctly, you should see all of your properties – verified and unverified – all listed.
Now, let’s pick one and run a basic query, where we can download the top 20 rows of queries for each page during the month of June 2017, for United States mobile web search:
usa_site_queries <-

search_analytics("https://www.example.com/",

"2017-06-01", "2017-06-30", c("query", "page"),

dimensionFilterExp = c("device==MOBILE","country==USA"),

searchType="web", rowLimit = 20)
Congratulations, you’ve just run your first data pull using R!
Now, let’s run the file, typing in the assigned variable:
usa_site_queries
Notice anything… peculiar? Perhaps the data doesn’t line up… or that you don’t have an actual file.
Well, let’s export this for public consumption in Excel:
write.csv(usa_site_queries, file = "test.csv")
You should see a new line return. But where is the file? Simply find the working directory and navigate to the folder:
getwd()

How Can Data Science Tools Benefit Your SEO Workflow?
By using resources outlined and repeated trial and error, you’ll begin to see that using data science tools like R can not only help you learn more about the growing field’s basics, but it can help automate your work once you get the hang of it.
Combining queries generated with GitHub and saving code templates will help you eventually find a manner in which you can grow and build something that can save you time and make your life easier, all while providing an educational benefit!
Image Credits
Featured Image: Pixabay
Cowgirl: Pixabay
Statistics Work: Pixabay
RStudio Logo: RStudio
Data & R Screenshots by Beau Pedraza. Taken August 2017.
