

Google Analytics is a powerful tool that can give you a great number of insights into your users, their journey through your website, and how your marketing efforts translate into business goals.
Understanding exactly what motivates your users and drives them to take the actions they do is essential for all digital marketing success.
In this column, you’ll learn how the built-in Google Analytics reports as well as some custom configurations will help you uncover these valuable user insights.
Things You Can Track in Google Analytics Out-Of-The-Box
There are plenty of reports available in Google Analytics without any additional configuration needed.
These can tell you a lot about how users navigate through your website, what content they find more interesting, and on which pages they exit.
Behavior Flow
Where to find: Behavior > Behavior Flow
Behavior flow is a visualization of users’ journeys through your website.
Here’s an example:
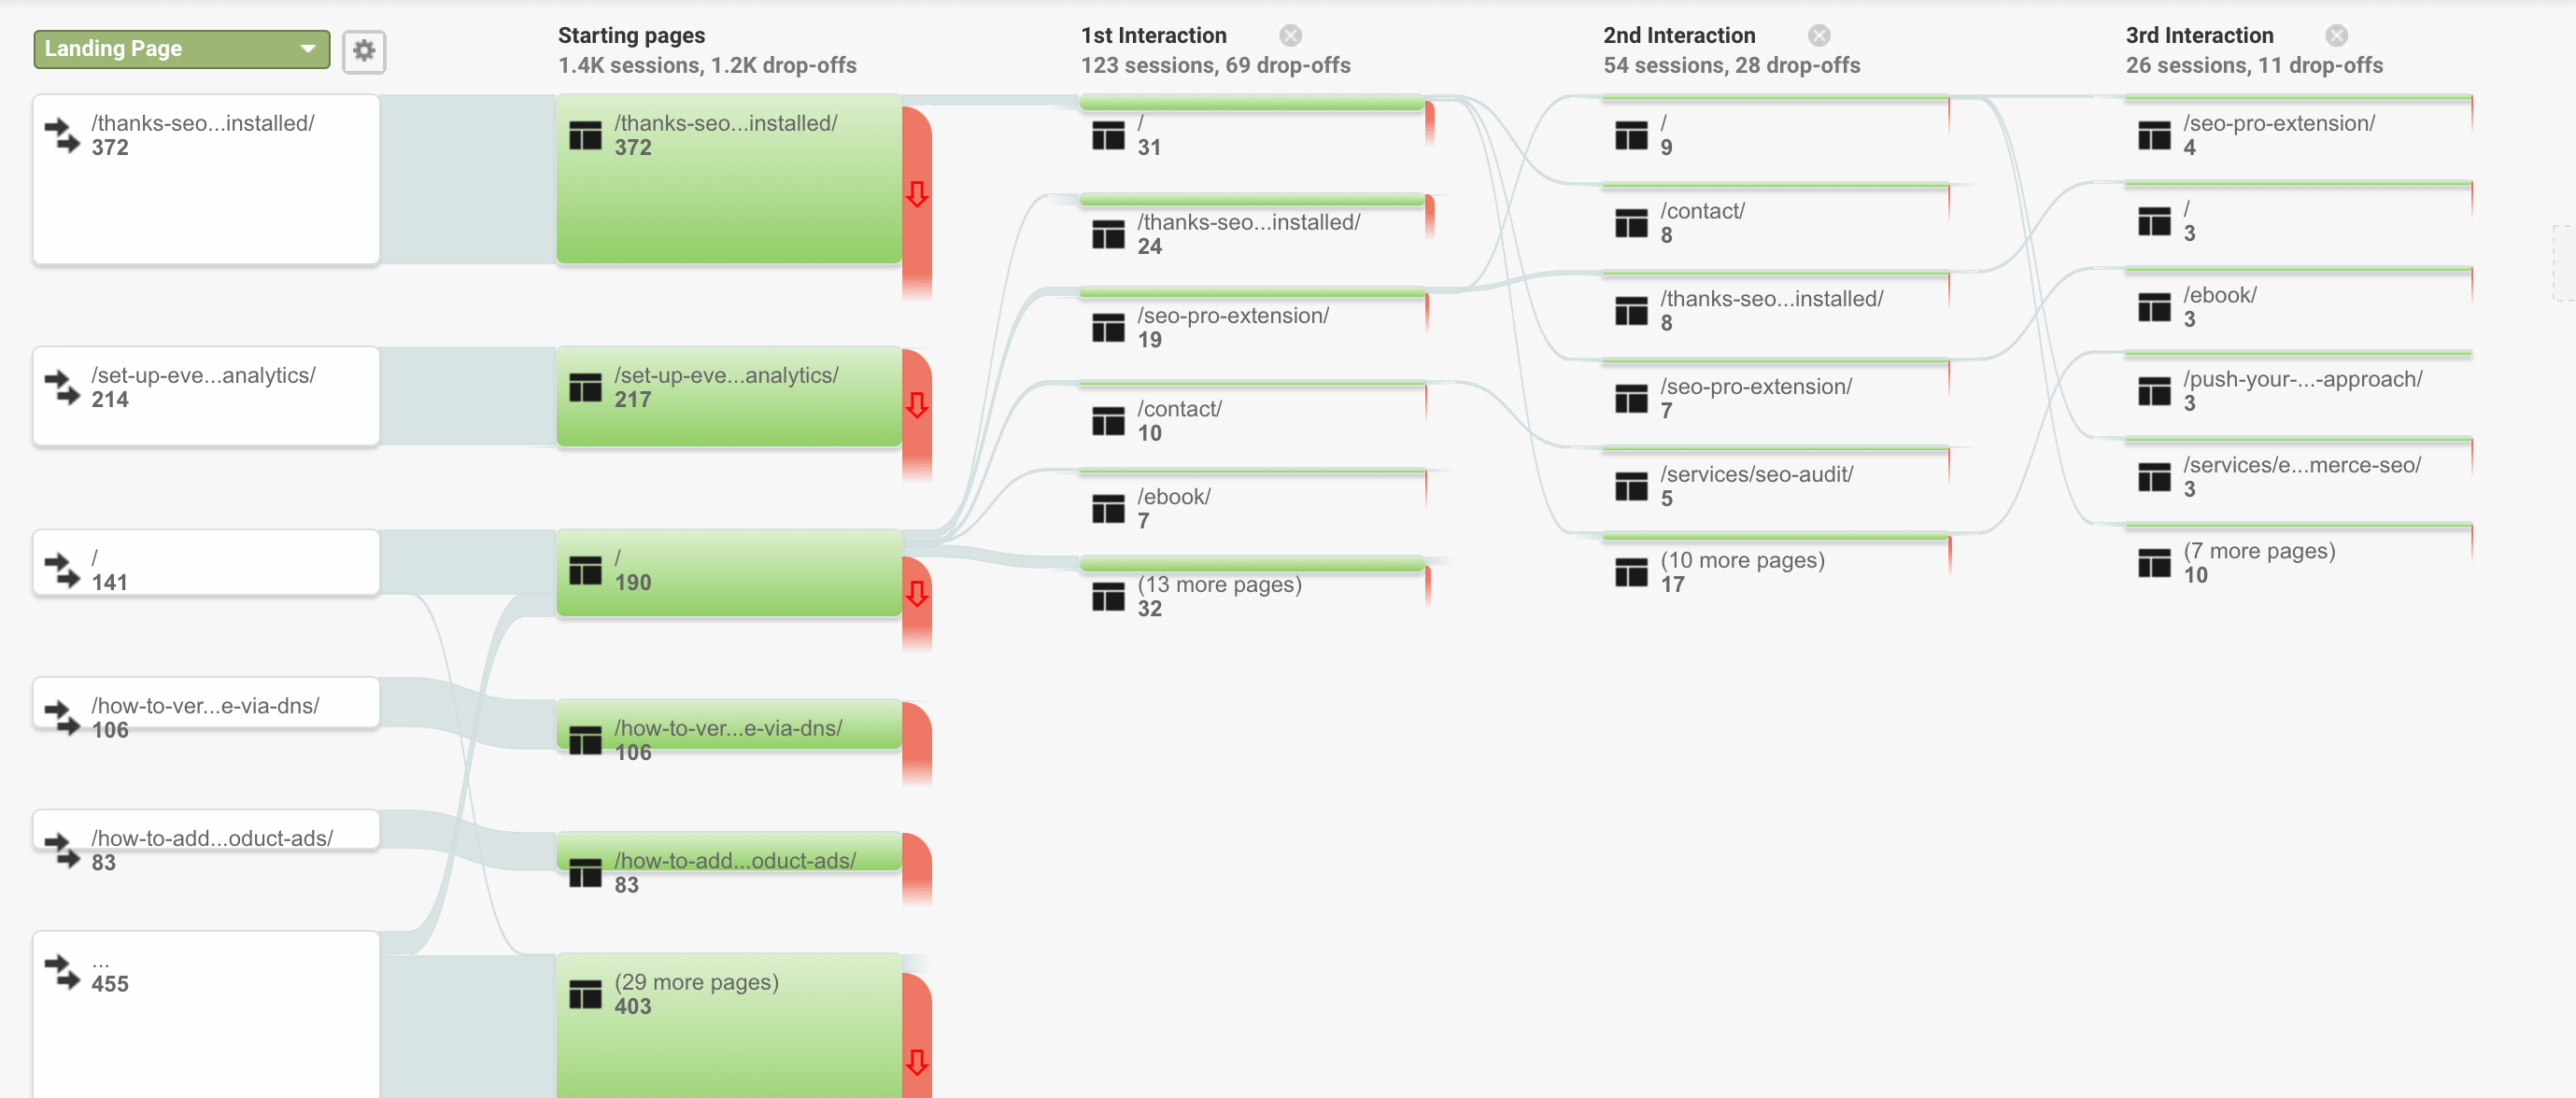
From this flow, I can see that a portion of users who install my SEO Pro extension and land on the Thank You Page, then navigate to the homepage, then to the contact page, and a few other pages.
Such a flow can give you an idea of how to place your CTAs and interlink pages so that users follow the journey you created for them.
You can also play with many settings and see the flow for the landing pages and traffic sources, events, and users.
Here are some examples of what you can discover through the Behavior Flow report:
- User journeys of people coming from Twitter/Linkedin/Facebook, etc.
- How different operating systems used by website visitors influence their behavior.
- Whether a user journey for a particular campaign worked as expected.
User Explorer
Where to find: Audience > User Explorer
While the Behavior Flow shows you aggregate user journeys, User Explorer shows you the journeys of every user.
Users are identified by a Client Id (no personally identifying information is used here).
This is what it looks like:
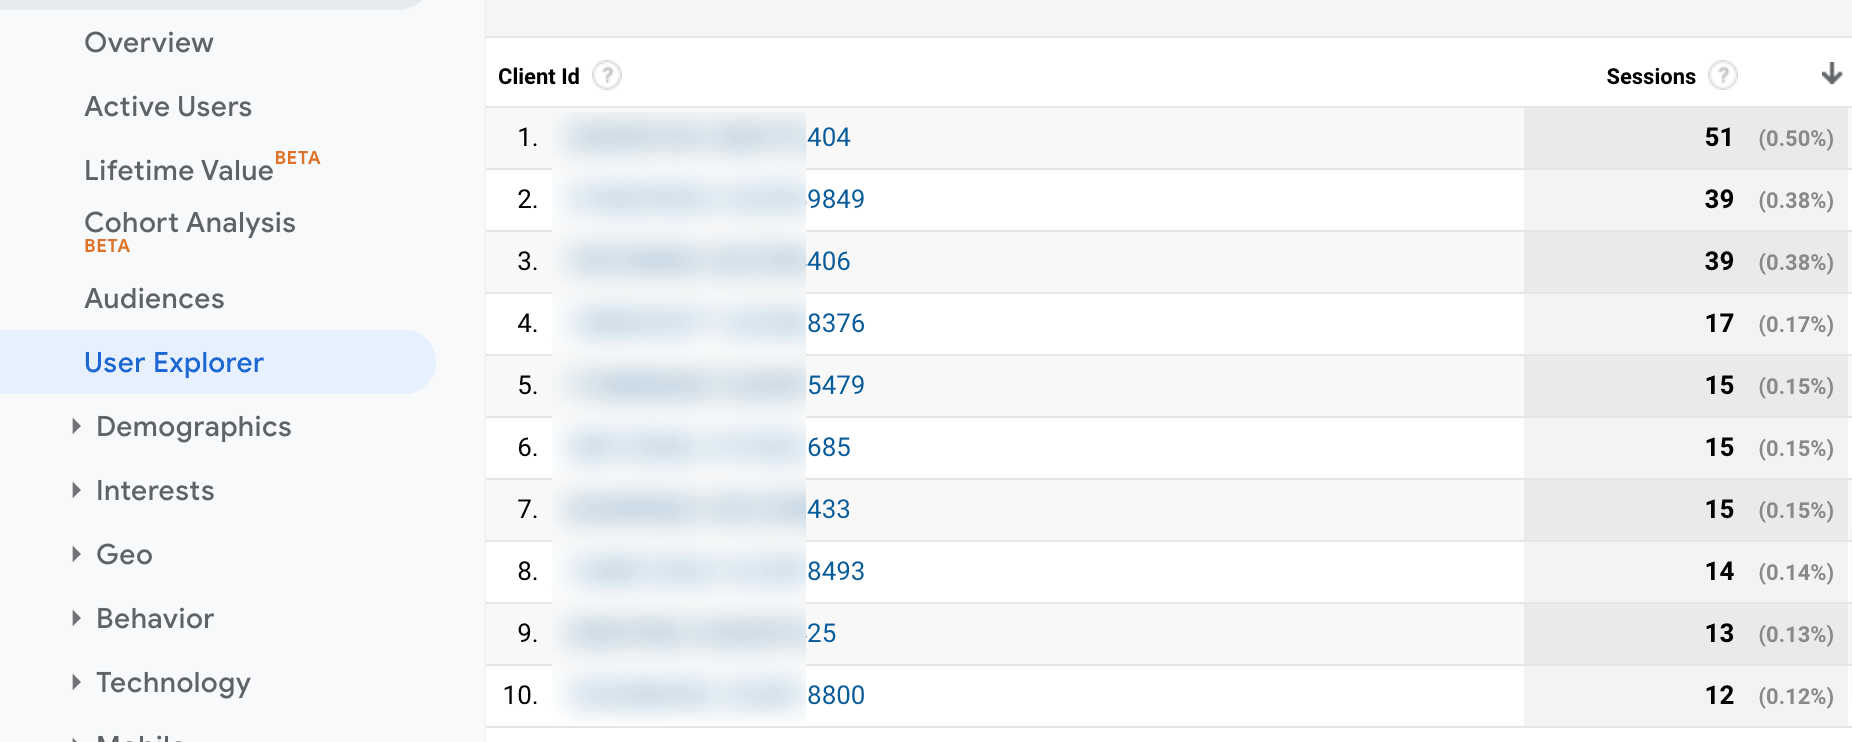
You can see the number of sessions per user. You can also drill down to each of these sessions and see what pages a user visited, events or goals triggered, traffic sources.
If you have ecommerce tracking enabled, you can also see Customer Lifetime Value here.
It’s basically a full story of how each visitor has navigated through your website:
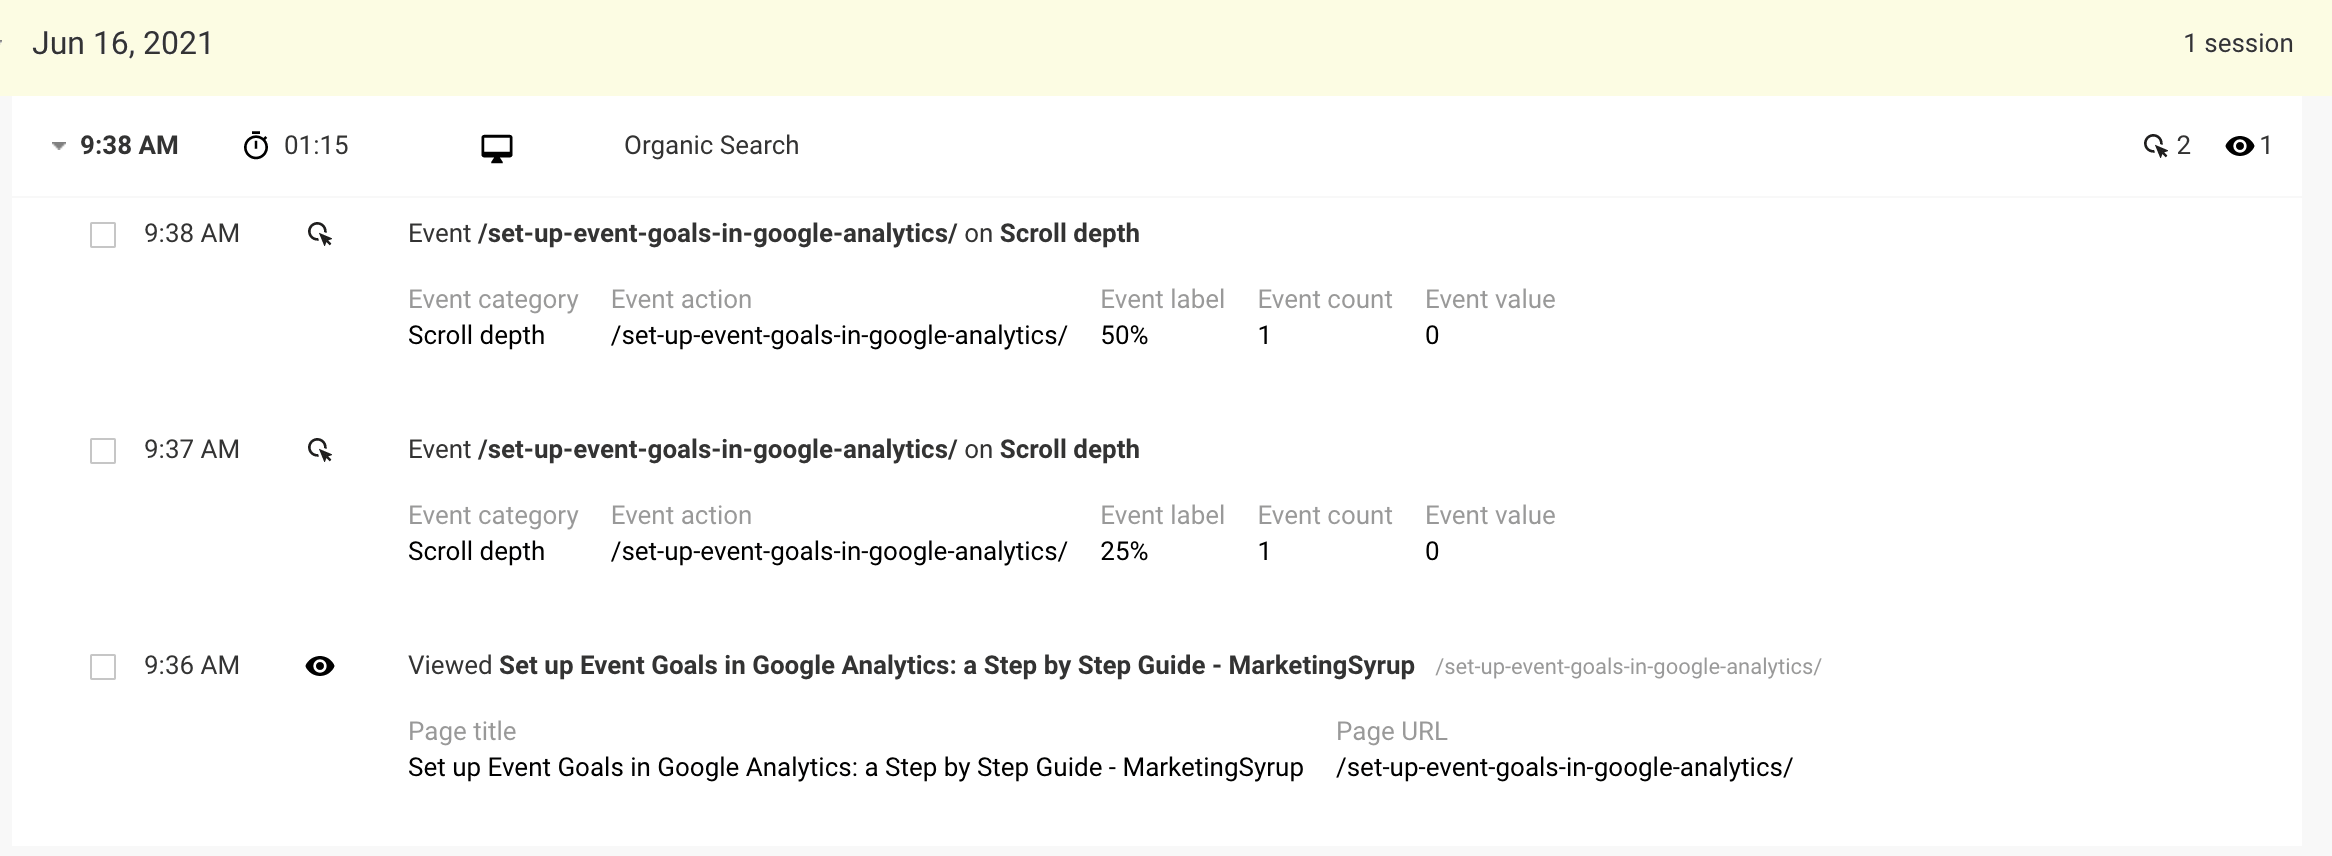
On the downside, there’s a lot of information in this report, so you need to know what you’re looking for to avoid getting overwhelmed.
Audiences
Where to find: Audience > Audiences
I love this report, as it helps to better understand particular audiences of people.
You first need to create an audience under Admin > Audience Definitions. For example, these can be people who visited particular pages of your website, or those who added a product to the cart but did not finish a transaction.
These are the same audiences you can then use in your Google Ads, too, if you connect it to Google Analytics.
Once the audience is populated, you can see detailed stats on it, such as:
- Traffic sources.
- Devices used.
- Demographics (age and gender).
- Browser.
Site Search
Where to find: Behavior > Site Search
This is the only report I included in this list that needs some configuration. But trust me, it’s really easy and will take you less than a minute.
Once you enable site search tracking, you will be able to see what people search on your website:
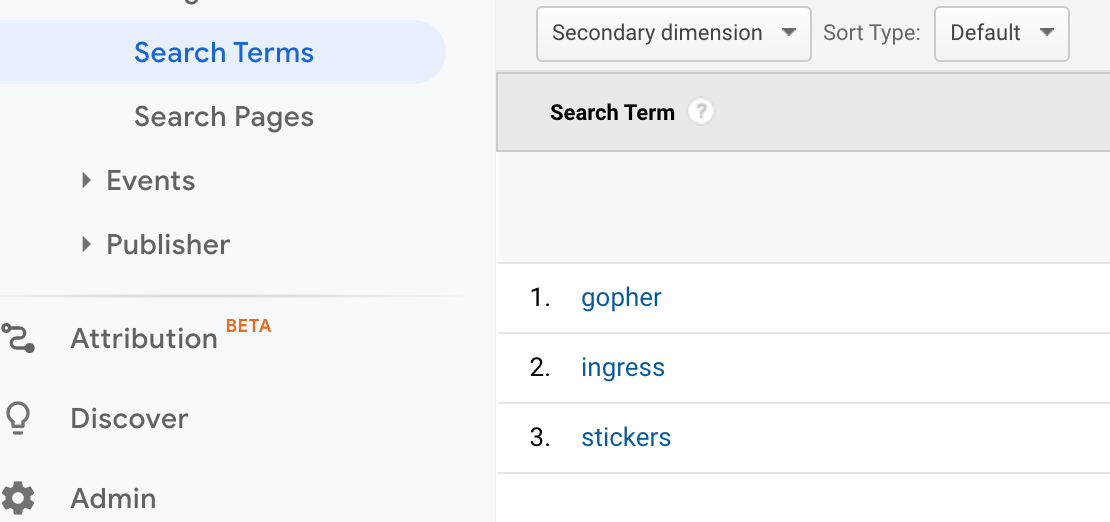
It can help you understand what content you need to create, which existing content is hard to find, etc.
Site search analysis and strategy are also important for improving conversion rates in ecommerce websites.
Traffic Sources
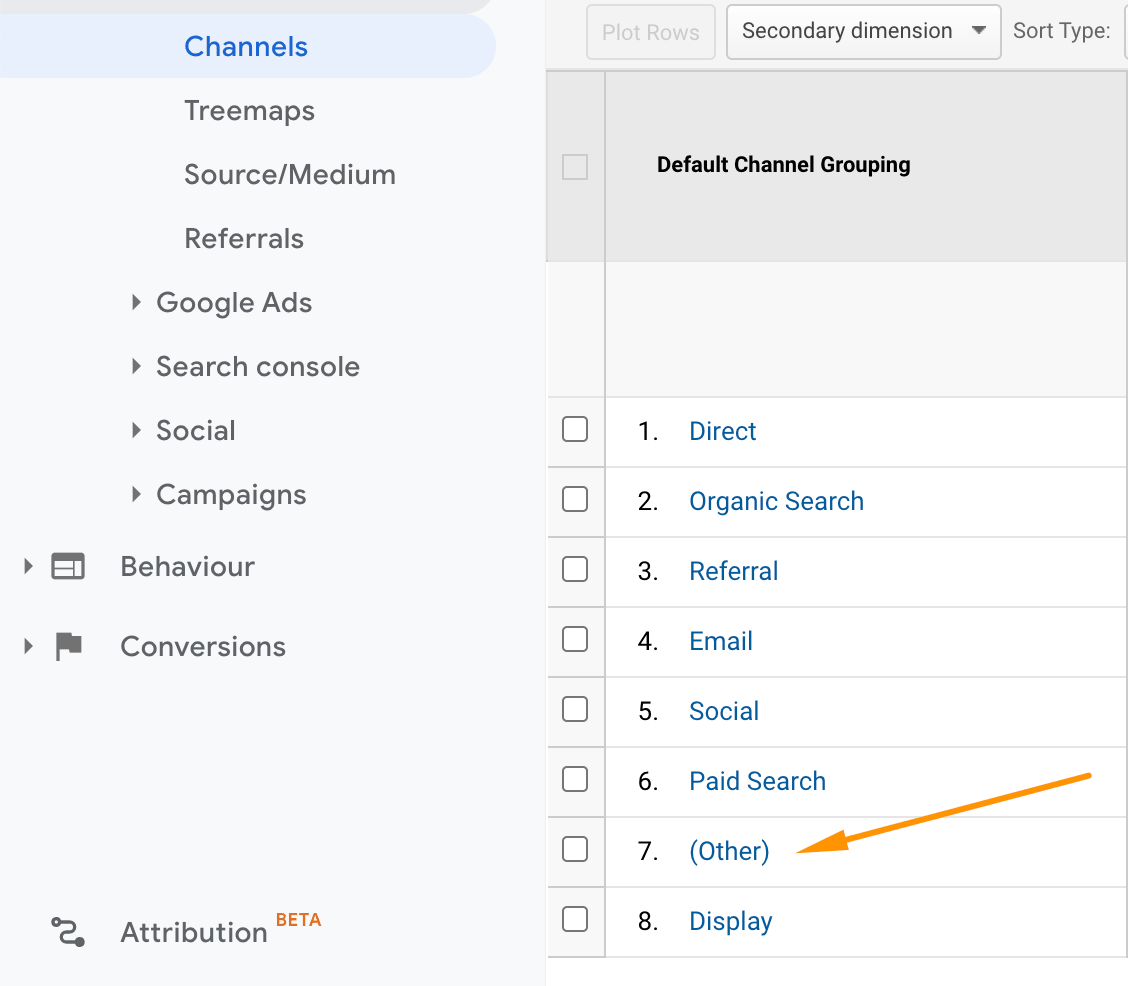
Where to find: Acquisition > All Traffic > Channels
This is one of the most popular reports. It shows sources your users came from, whether that is organic traffic, referrals, traffic from social media, etc.
You will also see that a portion of the traffic will be marked as Direct.
While part of direct traffic is returning users who know your website and type it in the browser, most of the Direct traffic is a “black box.”
When Google doesn’t know the initial source, it will report it as Direct. It might be because of some privacy settings (for example, Brave browser doesn’t allow tracking of any website interactions) or because of mistagging.
If you send many emails but don’t tag links pointing to your website from these emails, for example, the traffic will be attributed to Direct and you will not know the impact of your email marketing.
Pro tip: Always make sure that you set the right Medium in your campaigns tracked with UTM parameters so that you don’t have traffic attributed to (Other):
Bounce Rate, Pages/Session, Avg. Session Duration
Where to find: As metrics in certain reports such as Landing Pages, Traffic Sources, etc.
Bounce rate is basically a session where only 1 hit occurs.
Pages/Session shows how many pages a user visited within a single session.
Average session duration shows how long an average session lasts and is calculated the following way: total duration of all sessions (in seconds)/number of sessions.
All of these metrics are useful but you should always use them in the proper context.
For example, many people think that a high bounce rate is inherently bad. But if someone needs to visit just one page before they convert, it’s still a win.
Here’s an example: Someone searches for your company’s contact info. They land on your contact page, find your phone number, dial it and order $20,000 of your services.
Google Analytics will report the bounce rate for this session as 100%. The average session duration will be zero (as there were no other engagement hits).
All of this looks bad in Google Analytics but in reality, this session brought your company $20,000.
Additionally, such metrics as bounce rate and time on page are easy to manipulate in Google Analytics. That’s why I always recommend using these metrics as additional KPIs, not the main ones (and sometimes, you won’t use them at all).
Landing Pages and Exit Pages
Where to find: Behavior>Site Content>Landing Pages/Exit Pages
Landing pages show you where people landed first on your website. And exit pages show where users left.
These are great reports to analyze and understand if your user journeys happen as expected.
Additional Tools You Can Use to Uncover More Insights
There’s an official In-Page Google Analytics add-on that adds more insights: click tracking and heatmaps.

There’s one limitation, though. The add-on doesn’t differentiate between the link locations on a page while calculating the percentage and number of clicks.
For example, if you have the same link in the main navigation and in the footer, the add-on will show you the same numbers for both of these links. In reality, this is not correct as the link in the main navigation will likely get more clicks than the same link in the footer.
Additional Tracking You Can Configure in Google Analytics
While the default Google Analytics installation is rich in features, there are so many additional things you can track to understand your audience better.
Goals
Goals measure when users complete a particular action or reach a particular destination on your website.
There are a few goal types available in Google Analytics:
- Destination (e.g. a user visited your email subscription Thank You page).
- Duration (e.g. a user spent at least 3 minutes on your website).
- Pages per session (e.g. a user visited at least 4 pages during a single session).
- Event (e.g. a user clicked a button).
While the first three goal types can be added as goals without additional configuration, the last – Event goals – are trickier as you need an underlying event for such goals to work.
Events
Events are specific actions people perform on your website. You can turn events into event goals.
Some examples of events:
- Button clicks.
- Form fills.
- Outbound link clicks.
- Scroll depth.
Ecommerce Tracking
Ecommerce tracking is an absolute must if you sell products on your website and can add the transaction code to your Order Success page.
How to Set up Custom Event Tracking
Custom event tracking helps you see user actions that are not tracked by default.
It’s much easier to set up custom tracking if you’re using Google Tag Manager. If you’re about to move from hard-coded Google Analytics to Google Tag Manager, read this:
A Process for Defining and Setting up Custom Event Tracking
Step 1: Map out what actions need to be tracked across the website.
Step 2: Define the type of tracking needed.
Is it going to be a button, form, or something else?
Step 3: Define meaningful Labels and Actions.
You need to have more context for your events, so make sure the Category, Action, and Label make sense.
At this point, you should have something like this:
![]()
Step 4: Add all needed dataLayer codes for custom events (if needed).
You can work with developers to achieve this. But you need to give clear instructions on what dataLayer codes should be added and where they should be added.
Note that not all custom events will need additional dataLayer codes. Things like outbound link click or button click are usually easy to configure without any additional modifications.
Step 5: Create variables to pass additional data for event Labels (if needed).
There are many variables in Google Tag Manager that are already built-in (such as {{Page URL}}, {{Click URL}}, etc.).
You’ll need to create custom variables only if you’re tracking something very specific (e.g., the name of the product that is being added to the cart).
Step 6: Set up event tags in Google Tag Manager.
Make sure that you’re setting up the right event categories, actions, and labels that you’ve previously defined. You’ll see this information in Google Analytics later.
Step 7: Verify that everything is working properly.
Use the Google Tag Manager debug mode to verify that all your custom events are firing as expected.
Step 8: Celebrate.
There should always be time for fun!
Summary
Knowing how people behave when they’re on your website and how their journeys look will help you better understand what actually moves the needle for your unique audience.
Use these insights to improve conversions and inform how you structure marketing campaigns for maximum ROI and overall success.
More Resources:
- 6 Useful SEO Insights You Can Learn from Google Analytics
- 6 Types of User Behavior to Track on Your Website & the Tools to Do It
- Core Web Vitals: A Complete Guide
Image Credits
Screenshots taken by author, July 2021
