
There’s no lack of data to track.
Marketers don’t struggle with not having enough data. They struggle to pull the insights from the data already provided.
To help guide you, let’s dive into the big picture of business conversion metrics to help you determine the best KPIs to track.
1. Revenue
Revenue is the lifeblood of all businesses. It’s the total amount of money your business brings in. Your gross revenue is everything before expenses.
Revenue is the common thread that holds sales and marketing teams together. Raise your hand if you’ve heard the good ol’ saying, “Marketing doesn’t drive revenue. Sales does.”
When the marketing and sales teams align, it only benefits the bottom line.
How to track:
To track revenue, you can set-up ecommerce tracking in Google Analytics.
2. Conversion Rate
Conversion rate is the amount of visitors who have completed a goal on your website. The higher the conversion rate, the more successful your marketing campaigns.
WordStream did a study on the average conversion rate per industry stating that the average conversion rate across all industries is 2.70 percent on search networks.
Conversion rate is often tied to conversion rate optimization (CRO) which is marketing tactics like A/B testing to optimize a web page.
How to track:
To measure your conversion rate, use this formula:
Conversion rate = (conversions / total visitors) * 100%
For example, if your website had 100,000 visitors and 5,000 conversions last month, your conversion rate is 5 percent.
3. Leads Generated
Lead generation is when you attract and convert potential users interested in your company. A lead starts at the beginning of the buyer’s journey.
Lead generation is vital to success. But, to get leads you need to get traffic.
For example, ClearPivot increased monthly website traffic by 330 percent which resulted in a 57 percent increase in lead generation.
And, CSI Accounting and Payroll, increased traffic by 300 percent and saw new contacts spike to 625 percent.
How to track:
To track lead generation, I recommend setting up goals in Google Analytics. Treva Marshall goes into details about how to set up these goals.
4. Cost Per Acquisition
Cost per acquisition (CPA) is the price you pay to acquire a new customer. It’s similar to conversion rates, but with CPA, you can directly measure the impact of marketing on revenue.
If you’re using CPA for Google Ads, generally your CPA will be higher than your cost per click.
Many companies use CPA as a determining factor for their campaign direction.
Take OSN, for example. They reduced their cost per acquisition by 82 percent using Google Ads Call-Only campaigns.
And, Ebates reduced their cost per app registration by 56 percent.
How to track:
To calculate cost per acquisition, follow this formula:
Total marketing costs (MCC) / Total customers acquired (CA) = CPA
5. Order Value
Average order value (AOV) is the average dollar amount spent each time a customer orders. It is the sales per order, not per customer.
Increasing your AOV is much easier than attempting to increase your conversion rate. Why?
It’s much easier to convince a current customer to buy from you than it is to gain a new customer.
Just look at Boxed. Boxed, an online wholesaler of bulk product, used Facebook Ads to see a 14 percent increase in AOV.
How to track:
To track average order value, follow this formula:
Revenue / Number of Orders = Average Order Value (AOV)
For example, if I order three dogs bandanas that cost $10 each, my AOV is $10.
6. Customer Loyalty/Retention
Customer retention rate is how long a business keeps its paying customers over time. Harvard Business Review found that costs companies about 5-25x more to gain a new customer than it does to sell to an existing one.
Peter Drucker once said:
“Because the purpose of business is to create a customer, the business enterprise has two – and only two – basic functions: marketing and innovation.”
The point is, revenue doesn’t care where it comes from. Loyal customers spend more money and convert.
That’s why we’re seeing loyalty programs take center stage.
Virgin Atlantic’s Flying Club members earn 50 percent more points on flights. Plus, they have access to expedited check-in.
Amazon Prime members spend an average of $1,500 per year on Amazon.com. That’s compared with $625 per year spent by Amazon customers that are not Prime members.
How to track:
Customer churn rate is the best way to measure customer retention and loyalty. It gives you hard data to understand if your customers are happy or not. If you have a high churn rate, most likely your product or service doesn’t meet the needs of your customers.
Intercom uses churn rate to predict future problems in their funnel.
The email marketing folks at ConvertKit calculate churn rate like this:
Lost quantity / Number of “x” at the beginning of time = Churn
7. Lifetime Value (LTV)
Lifetime value is the revenue your business makes from a customer.
Venture capitalist, David Skok, says “the biggest reasons startups die is because their Customer Acquisition costs vs their Customer Lifetime Value costs often look like this.”
Netflix is a perfect example lifetime value. The average Netflix subscriber stays with them for 25 months. That’s a lifetime value of $291.25
How to track:
To calculate LTV, use this formula:
LTV = Average Revenue Per User (ARPU) x 1/Churn
Essentially, this formula will predict how much money you’ll make in a specific period. So, if it costs you $200 to acquire a new customer, you should create a plan to make $200 back from that customer.
8. ROI
ROI stands for Return on Investment. It’s a way for marketers to prove that marketing does impact the bottom line of the company. It’s also a good way to determine what to spend your marketing budgets on.
However, there are challenges to calculating ROI in marketing. Why? Because what you spend $5 on today may not bring a return for 5 years.
According to The CMO Survey from Duke University’s Fuqua School of Business, only 37 percent of CMOs feel they can prove the short-term impact of marketing spend.
How to track:
To track ROI, use this formula:
(Gross Profit – Marketing Investment) / Marketing Investment
For example, if you buy $100 worth of Facebook ads, then end up getting $200 back in sales, your return on investment is 100 percent.
9. ROAS
ROAS means Return on Ad Spend. Essentially, it gives marketers an idea if they spend X on this advertising campaign then you’ll receive X back in increased revenue.
As a general rule of thumb, think about a positive ROAS like this: for every $1 you spend, you should get $3 back.
However, depending on your industry, you may have different numbers.
Nielsen analyzed more than 1,400 ad campaigns from 450 CPG brands over 10 years. They discovered different ROAS across categories with baby products generating the biggest return on spend at $3.71.
How to track:
To calculate ROAS, use this formula: (Revenue – Cost) / Cost
For example, if you spend $5,000 on Google Ads and earned $10,000 from those who clicked on your ads, then your ROAS is ($5,000 – $10,000) / $5,000 equals 1, meaning 100 percent.
10. Media Mentions
Whether it’s a positive review or something not-so-sweet, tracking your mentions is part of maintaining your brand reputation. It gives you valuable feedback to your brand, product, or company.
If you’re a big company, you’re probably mentioned in the press naturally quite often. If you’re smaller, a mention could lead to a potential partnership or opportunity.
If you’re getting started, Brittany Berger, previously Head of Content and PR at Mention, suggests “monitoring your social media handles, your company name, and your website.”
How to track:
I would recommend you track your mentions monthly. You can automate a report with a tool like Moz, BuzzSumo or SEMrush Brand Monitoring.
You can also use tools like HootSuite (paid and free versions available) and Tweetdeck (free) to monitor your social mentions. These tools are good to use to track competitors also.
If you’re smaller and on a tight budget, I’d opt Google Alerts. You can set up recipes on IFTTT for free. Some of my favorite applets include tracking mentions on Twitter and Reddit.
11. Total Traffic
Total traffic gives you a bird’s eye view of the health of your website. It’s the big picture.
You can begin to track patterns to see if there’s a drop off during a specific day of the week or spike throughout the year.
How to track:
To measure total traffic, login to Google Analytics > Acquisition > All Traffic > Channels.
12. Email Subscribers
Your email subscribers are your bread and butter for any company. They are often the most engaged users.
Email had a median ROI of 122 percent — that’s more than 4x higher than social media, direct mail and paid search.
Just look at The Kewl Shop. They grew their ecommerce revenues by 22 percent in 12 months with email marketing.
Or, learn how Milk It Academy saw 187 percent increase in revenue from new email subscribers.
As you can see, increasing your email subscribers can lead to higher sales.
There are many email tools you can use to track your email list growth. At SEJ, we use MailChimp. But, there are many others like Aweber and Drip.
How to track:
If you want to track where your email subscribers are coming from, you can create form submissions in Google Analytics.
Just head over to Behavior > Events > Overview. Under the Event Category column, click on Form. Here, you can view the number of impressions and conversions. Then, click the Event Action.
13. Branded Searches
Branded searches are keywords that include your brand name or a variation of your brand name. For example, In-N-Out, In-N-Out Burgers, In-N-Out fast food, etc.
Branded searches are known for their high conversion rates.
Tom Demers, Co-Founder & Managing Partner at Measured SEM and Cornerstone Content, analyzed 50 companies to find that branded searches were worth $171 million per month.
And, Tom Capper, Senior Consultant at Distilled, published a case study on Moz to show that branded search volume is correlated to organic search ranking in Google.
I would say that’s worth the effort.
How to track:
To track branded searches, you can measure branded search impressions through Google Search Console.
If you’re getting impressions, that means people are searching for your branded terms and may help you understand what’s working and what’s not with your marketing efforts.
Also, I would recommend tracking direct traffic in Google Analytics. If people are typing your domain name into the search bar, it means people are looking for you.
Lastly, you can run a PPC campaign for your branded keyword terms to gain more accurate impression data.
14. Reviews
Reviews are your businesses social proof.
There’s proof that consumers trust each other more than they trust brands. BrightLocal found that 85 percent of consumers trust online reviews as much as personal recommendations.
This is why we’re seeing an emergence of Yelp, Google+, Facebook, and Angie’s List type of marketing strategies.
Bazaarvoice proved that 50 or more reviews per product can mean a 4.6 percent increase in conversion rates.
To monitor reviews, you can use tools like YOTPO, TrustPilot, BrightLocal, BirdEye, or ReviewTrackers, to name a few.
How to track:
With a negative review on the first page of Google, there is going to be a loss of revenue.
Harvard Business Review discovered that a one-star increase in Yelp rating leads to a 5-9 percent increase in revenue.
Ryan Erskine, Senior Brand Strategist at BrandYourself, shares his formula for calculating a bad Yelp review.
% Lost Revenue = (5 – Star Rating) * .07
So, if you have a 3 star rating, you’re 2 stars away from 5.
3 * .07 = 0.21
That’s 21 percent of lost revenue.
15. Net Promoter Score
Net Promoter Score (NPS) measures customer loyalty with a single question.
On a scale of 0-10, how likely is it that you would recommend our company?
It looks something like this.
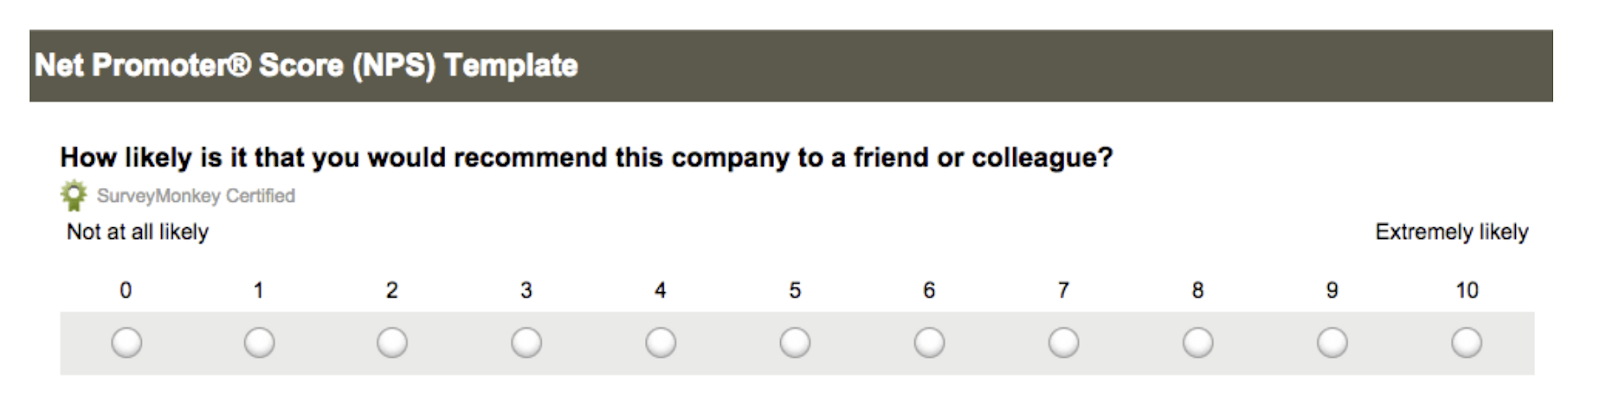
Based on the score they give you, they are bucketed into three categories:
- Promoters: 9-10.
- Passives: 7-8.
- Detractors: 6 or below.
Many companies use NPS to learn from their customers. For example, Mention cut their churn rate in half in two months with NPS surveys.
And, Airbnb found that customers who an NPS score of 10 were 13 percent more likely to rebook another stay.
Now, the million dollar question: What is a good NPS score?
In a perfect world, your NPS score would be 100. But, that’s not reality. A good NPS score depends entirely on your industry. To gauge your NPS score for your industry, head over to NPS Benchmarks.
Here is a look at some of the top companies and their NPS:
- Tesla: 97
- Southwest Airlines: 62
- Amazon: 61
- Google: 50
- Microsoft: 34
- United Airlines: 10
There are many tools to use to begin gathering your NPS score. Groove uses Delighted. HootSuite uses Wootric. And, Zapier uses Promoter.
How to track:
To calculate your NPS, subtract the percentage of Detractors from the percentage of Promoters.
(% of Promoters) – (% of Detractors) = Net Promoter Score
So, if 60 percent of respondents were Promoters and 30 percent were Detractors, your NPS is a score of 30.
Image Credits
Featured Image: Paulo Bobita
Screenshot: Taken by author
