This post was sponsored by DeBugBear. The opinions expressed in this article are the sponsor’s own.
We all want a website that’s fast and has good SEO. But there’s a long list of things to check and it’s easy to miss small issues.
Luckily, Google offers its own tool and testing playground to help you discover if your website is up to speed.
In This Guide
- 1. What Is Google Lighthouse?
- 2. Does The Lighthouse Performance Score Impact SEO?
- 3. How Do You Test Your Website With Lighthouse?
- 4. How To Run A Lighthouse Test In Chrome DevTools
- 5. Is Google Lighthouse Data Reliable?
- 6. How Can I Get More Reliable Test Results?
- 7. How To Improve Your Lighthouse Performance Score
- 8. Should You Worry About A Poor Lighthouse Score?
- 9. Google Lighthouse Troubleshooting
- 10. Set Up Continuous Monitoring For Lighthouse Scores & Core Web Vitals
Google’s Lighthouse tool is essentially a long automated checklist for your website.
Instead of manually checking your website, learn how you can generate a detailed report in less than a minute.
What Is Google Lighthouse?
Lighthouse is an automated website analysis tool that tests your website and assigns it a score across four different categories:
- Performance.
- Accessibility.
- Best Practices.
- SEO.
Each score ranges from 0 to 100, with 100 being a perfect score. Scores are made up of individual checklist items called Lighthouse audits.
In addition to these four scores, there’s also a Progressive Web App (PWA) section that looks at various features that make your website behave more like a native mobile app.
Checking your website with Lighthouse can help you ensure your website is fast and doesn’t have obvious accessibility or SEO issues.
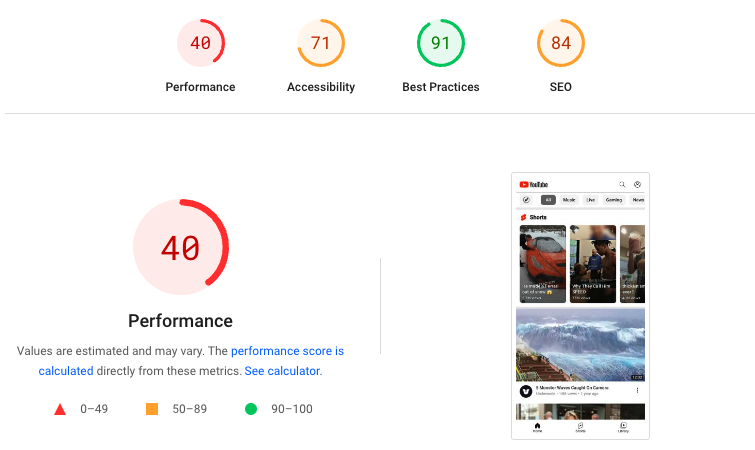 Screenshot of a Lighthouse report on PageSpeed Insights, September 2023
PageSpeed Insights Vs. Lighthouse: What’s The Difference?
Lighthouse is a free tool developed by Google with the source code publicly available.
PageSpeed Insights is just one way to run a Lighthouse test, but many other products also include it. For instance, you can also install Lighthouse directly on your computer and run it there.
The normal Lighthouse report only runs the automated speed test and doesn’t provide any real user metrics. However, if you use PageSpeed Insights or the DebugBear speed test, you get both the real user data and the Lighthouse test result.
Does The Lighthouse Performance Score Impact SEO?
No, your Lighthouse Performance score does not directly impact SEO.
However, Lighthouse does give you insights that can help you influence your website’s page speed, which is a ranking signal.
Google looks at three performance metrics called the Core Web Vitals (CWV) to help make that determination.
The underlying data for CWV is collected from real Chrome users as part of the Chrome User Experience Report (CrUX). Lighthouse, on the other hand, pulls its data a little differently; it runs its performance test in a simulated test environment.
In the end, what counts for Google is how real users experience your website. So, Lighthouse helps you improve key parts of your website that should, if done correctly, reflect in future real-user traffic.
So, a slow Lighthouse score correlates with a slow experience for real users. Lighthouse can point out valuable opportunities for page speed optimization.
The Lighthouse SEO category also looks at whether a page can be indexed or whether image alt attributes are missing. So, optimizing Lighthouse scores can still help you rank higher in Google.
How Do You Test Your Website With Lighthouse?
The easiest way to run a Lighthouse test is to use a free online tool like Google PageSpeed Insights or the DebugBear Speed Test.
Step 1: Enter Your URL
Simply enter your website URL, and start the test!
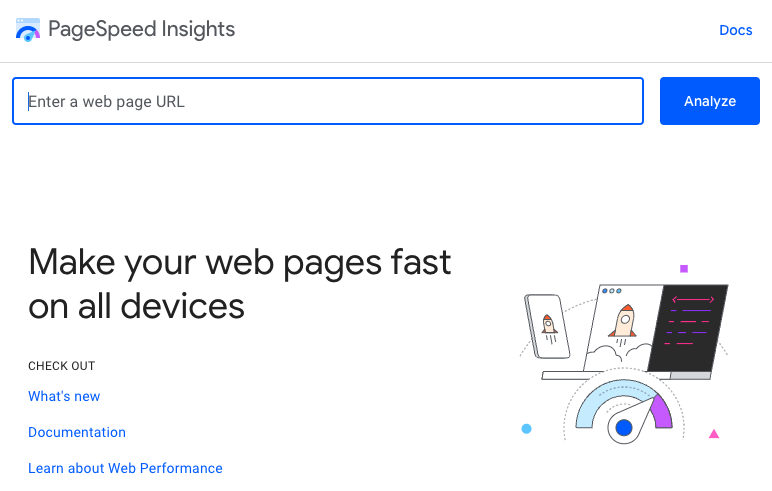 Screenshot of the PageSpeed Insights landing page, September 2023
Step 2: Get Real User Data & Lighthouse Test Results
PageSpeed Insights actually reports both the real user data we mentioned above and the Lighthouse test result.
From there, you can:
- Discover what your real users are experiencing (this refers to the CrUX data that’s collected from Chrome users).
- Diagnose performance issues (this is where the Lighthouse test data lives).
Real user data and Lighthouse test result on PageSpeed Insights, September 2023
Step 3: Aim For All Green Scores
You can find the Lighthouse Performance score and the individual page speed metrics at the top of the Lighthouse report. The score will show up as green if it’s 90 or over.
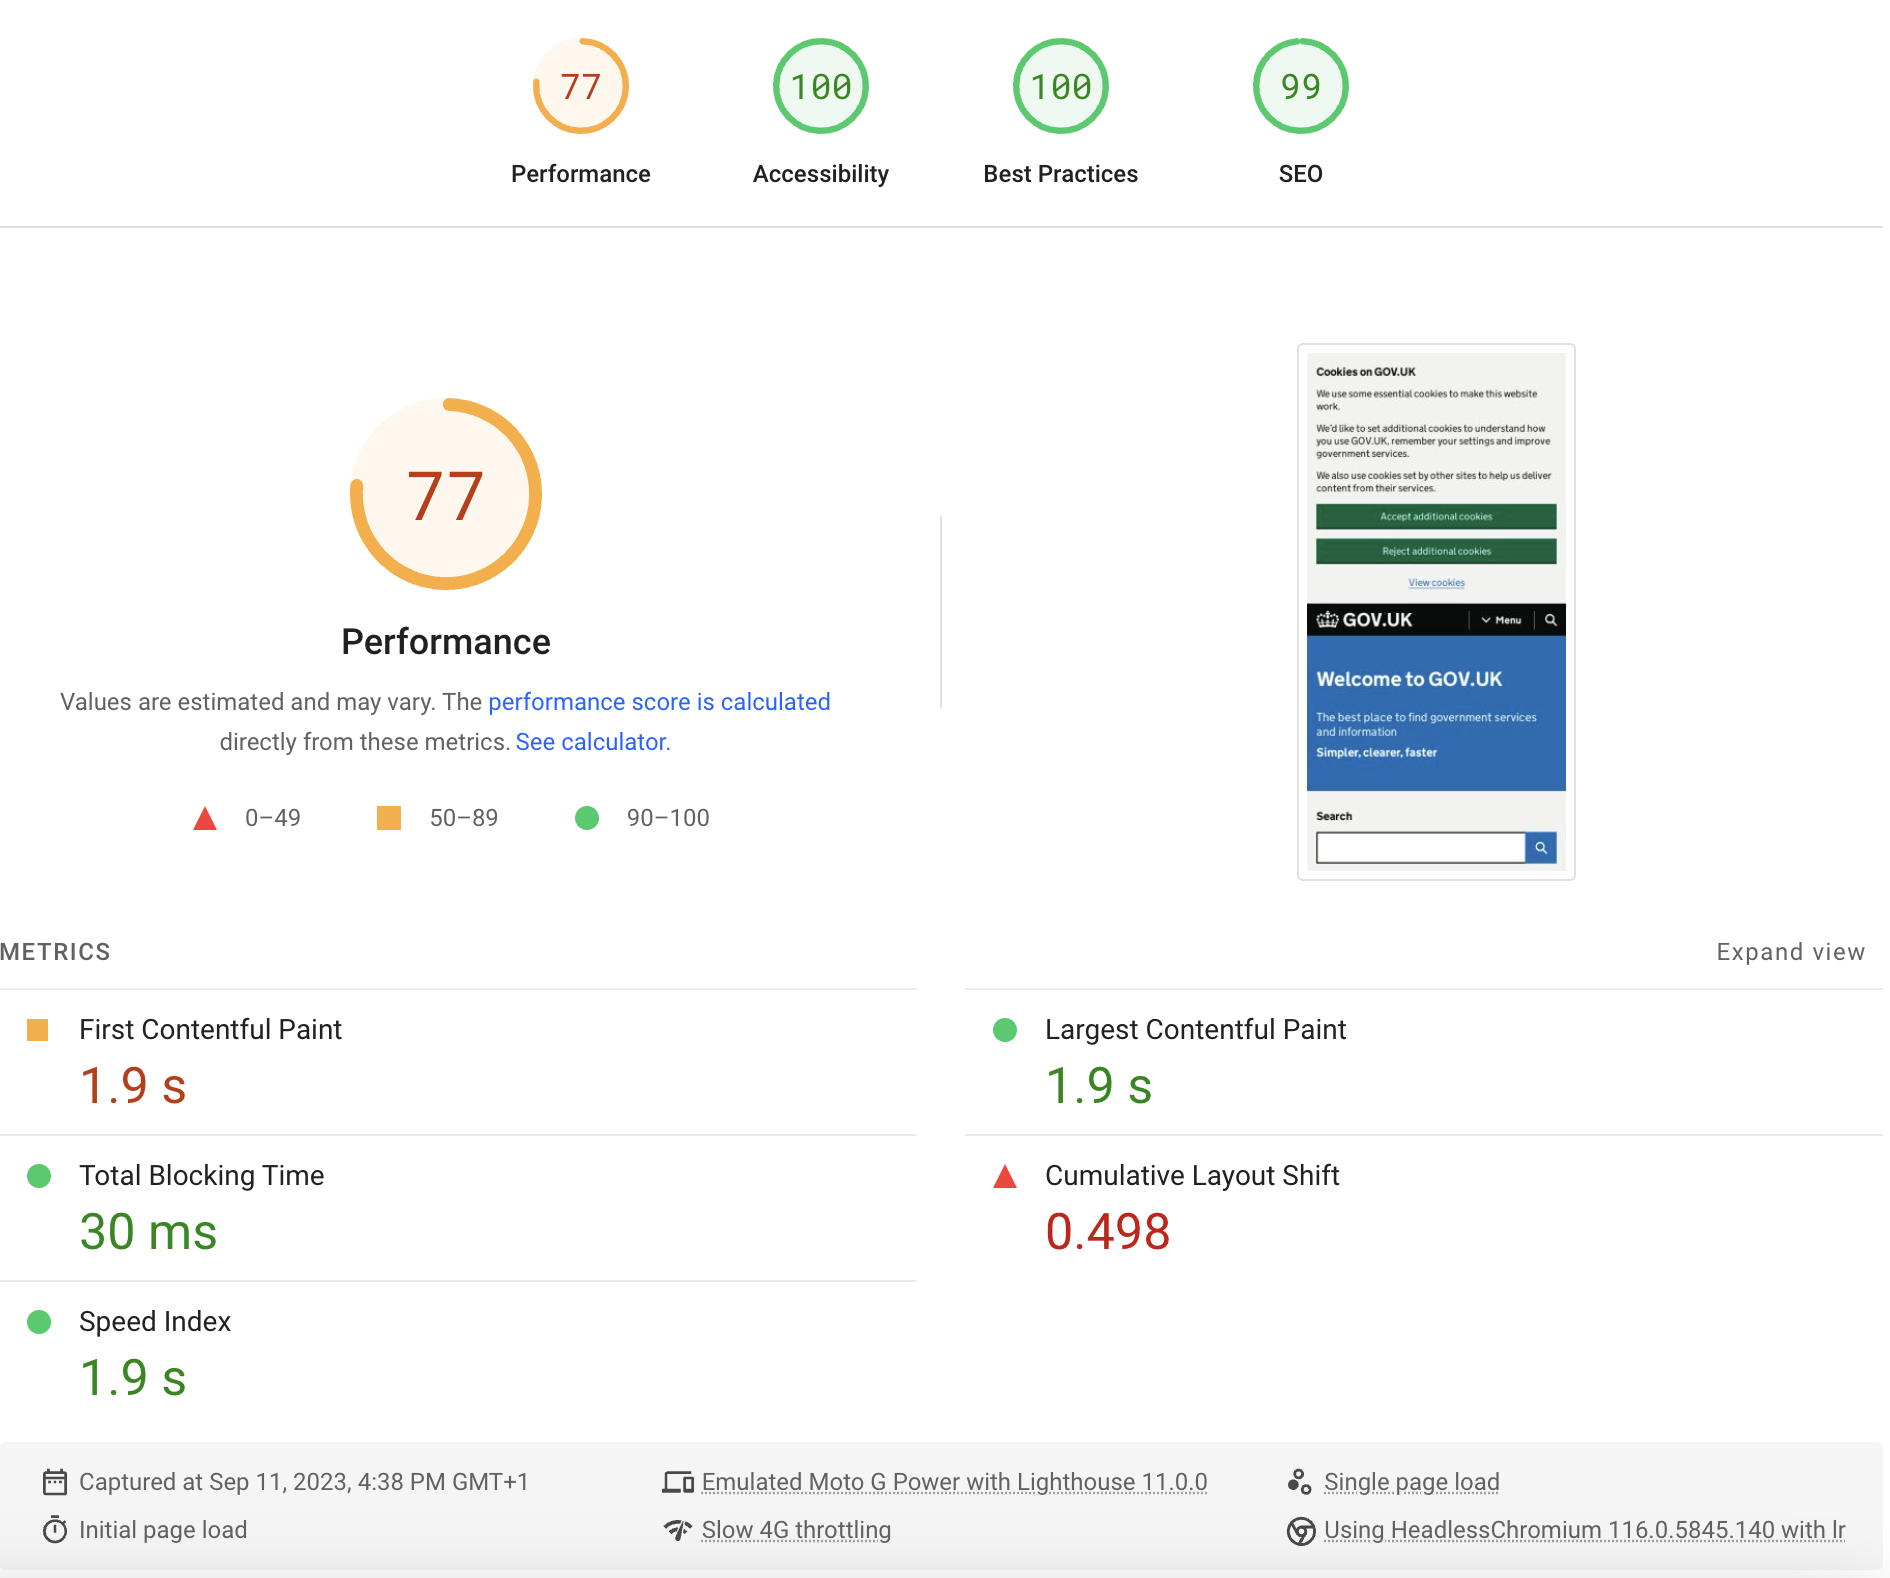 Lighthouse Performance score and metrics on PageSpeed Insights, September 2023
Pro Insight: Run Lighthouse On Both Mobile Vs. Desktop
Lighthouse tests can be run using different device configurations.
The default mobile and desktop configurations differ not just in screen size or the user agent that the device uses to identify itself. Selecting a device also controls other aspects of the test environment:
- Network latency: how long does it take for data to travel between the client and the server?
- Network bandwidth: how much data can be exchanged between client and server per second?
- CPU speed: how quickly can the browser run code or perform tasks like rendering page content?
Lighthouse uses the following default settings for desktop and mobile devices:
| Mobile | Desktop | |
| Latency | 150 milliseconds | 40 milliseconds |
| Bandwidth | 1.6 Mbps
(200 kilobytes per seconds) |
8 Mbps
(1 megabyte per second) |
| CPU Speed | 4x throttled | No throttling |
When a Lighthouse test is run on a computer with a fast internet connection then the network speed will be throttled down to those of the test configuration.
The simulated test environment is much slower on mobile than on desktop, so the mobile scores and metrics reported by Lighthouse are much worse than those of desktop tests.
How Is The Lighthouse Performance Score Calculated?
The Lighthouse Performance score is made up of five individual website performance metrics:
| Metric | Score Contribution | What It Measures |
| Total Blocking Time | 30% | Could a large amount of CPU processing on the page lead to slow user interactions? |
| Largest Contentful Paint | 25% | How quickly does the main page content show up? |
| Cumulative Layout Shift | 25% | Does page content move around after appearing and disorient the user? |
| First Contentful Paint | 10% | How quickly does the first bit of page content show up? |
| Speed Index | 10% | How long does it take for most of the page content to appear? |
Each metric is assigned a subscore and these subscores are then combined into the overall score using the weights from the table above.
For example, to get a score of 90 for the Largest Contentful Paint metric the metric value has to be below 2.5 seconds.
How Can I See A Detailed Lighthouse Performance Score Breakdown?
You can click on the “See Calculator” link in the Lighthouse report to see a detailed calculation for your website.
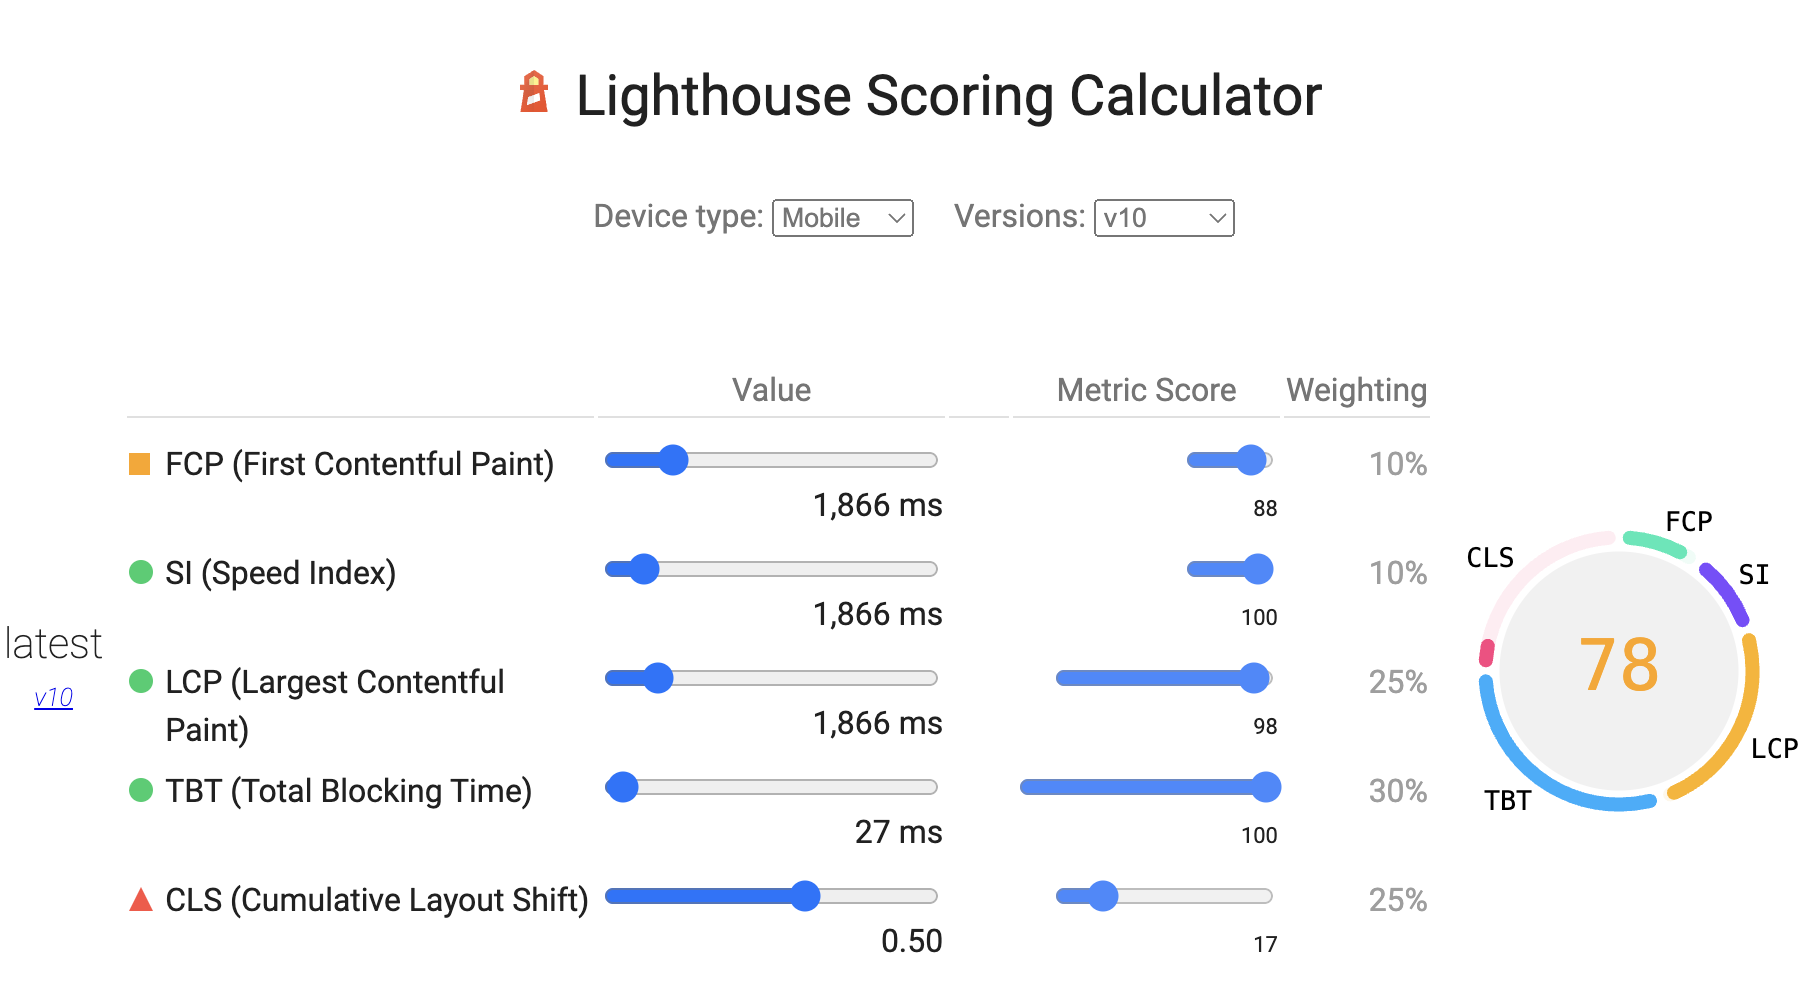 Screenshot of the Lighthouse Performance score calculator, September 2023
How To Run A Lighthouse Test In Chrome DevTools
Another way to run a Lighthouse test is using the developer tools in Google Chrome.
This is especially useful when testing sites that run on a local server, pages that require login, or to test user interaction as part of the speed test.
To run Lighthouse in Chrome you can:
- Open the website you want to test.
- Right-click on the page and select “Inspect” from the menu.
- Open the “Lighthouse” tab.
- Click on “Analyze page load”.
The page will then reload and the test result will be ready within a minute or so.
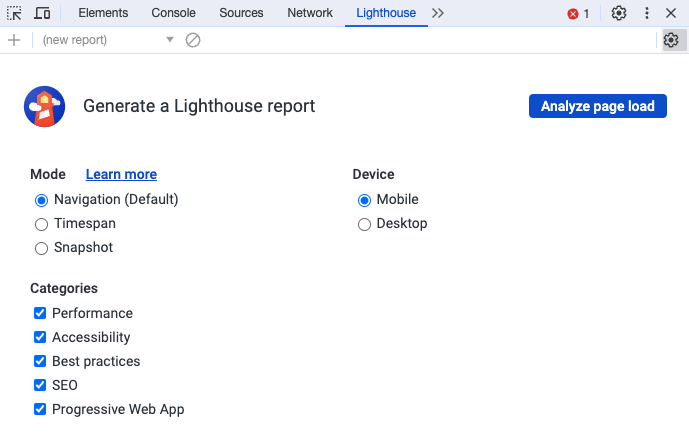 Screenshot of the Lighthouse tab in Chrome DevTools, September 2023
Lighthouse in DevTools offers three separate modes:
- Navigation: reload the page and grade performance, accessibility, and SEO.
- Timespan: collect data on a page that is already open, for example measuring how long a page interaction takes.
- Snapshot: analyze accessibility and SEO of the current page state.
The Timespan mode is especially useful as it lets you start the test, interact with the page contents, and then generate a report on the interaction. This way you can measure the Interaction to Next Paint metric that becomes one of Google’s Core Web Vitals in March 2024.
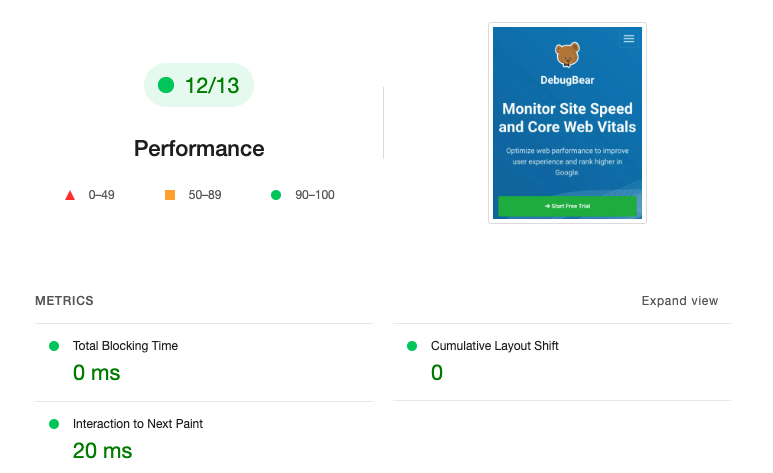 Screenshot of a Lighthouse timespan recording with a user interaction, September 2023
DevTools also provides an option to configure the throttling method. Click on the gear icon in the top right to open the advanced Lighthouse settings. By selecting the DevTools throttling option you can get more reliable data than when using the default simulated throttling.
However, using DevTools throttling is still less reliable than using a dedicated page speed tool.
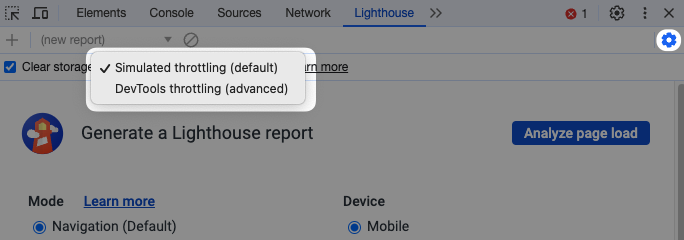 Screenshot of advanced Lighthouse settings in Chrome DevTools, September 2023
Is Google Lighthouse Data Reliable?
Lighthouse supports different operating modes and some produce more reliable results than others. The default mode that’s used by PageSpeed Insights is called simulated throttling and can sometimes result in inaccurate data.
When running a performance test PageSpeed Insights doesn’t collect data using a slow connection. Instead performance metrics are measured on a fast connection. This initial data is referred to as observed metrics.
After collecting the data Lighthouse applies a simulation that estimates how quickly the page would have loaded on a slower network connection.
This way tests can be run quickly even when using a slow device configuration. But the simulation can also introduce inaccuracies.
You can use the Site Speed Chrome extension to see both the simulated metrics and the original observed data when running a test on PageSpeed Insights.
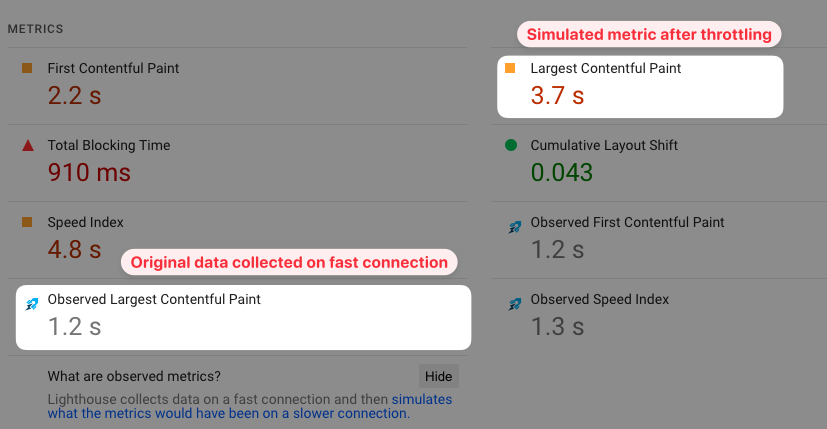 Screenshot of PageSpeed Insights with original observed metrics inserted via a Chrome extension, September 2023
You will sometimes find that the page load time is faster after slowing down the network. When this happens, this is a clear indication that the Lighthouse simulation is running into an edge case it doesn’t support.
How Can I Get More Reliable Test Results?
To get high-quality data you can use the free DebugBear website speed test. This test collects metrics directly in a throttled environment, ensuring reliable test results.
 Screenshot of the free DebugBear page speed testing tool, September 2023
How To Improve Your Lighthouse Performance Score
To get started optimizing your score, check out the opportunities section of the Lighthouse performance category.
Lighthouse automatically identifies potential improvements and ranks them by the estimated savings on your page load time.
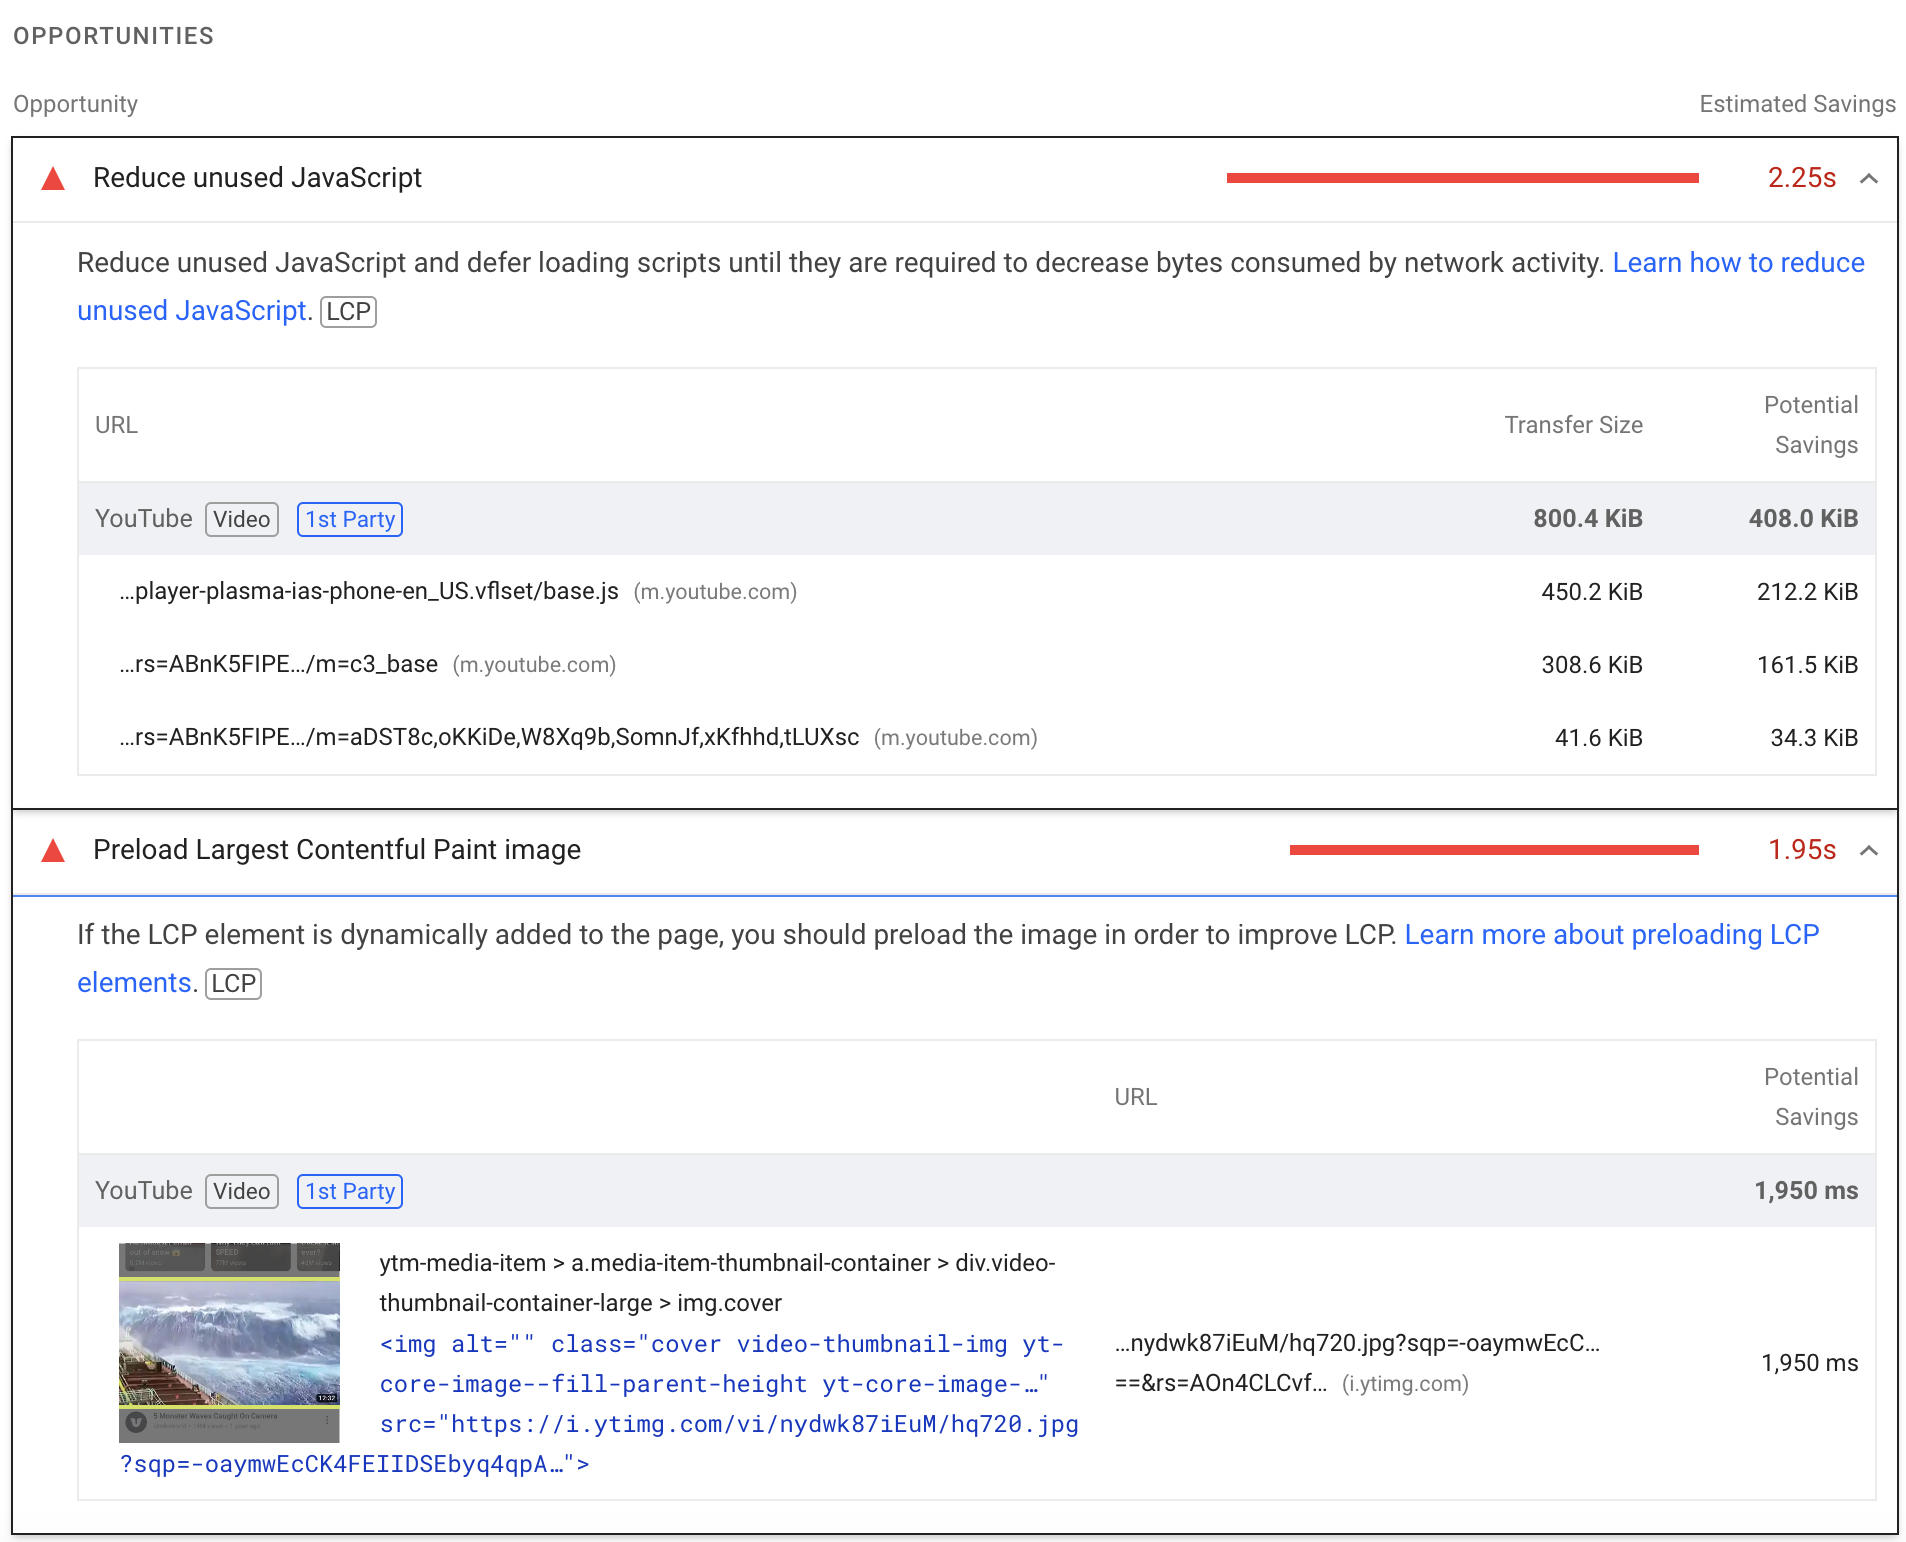 Screenshot of Lighthouse performance recommendations, September 2023
Looking at a waterfall visualization that shows what resources your website loads and when content appears also provides a lot of insight into your metrics. This allows you to understand what’s holding back each metric.
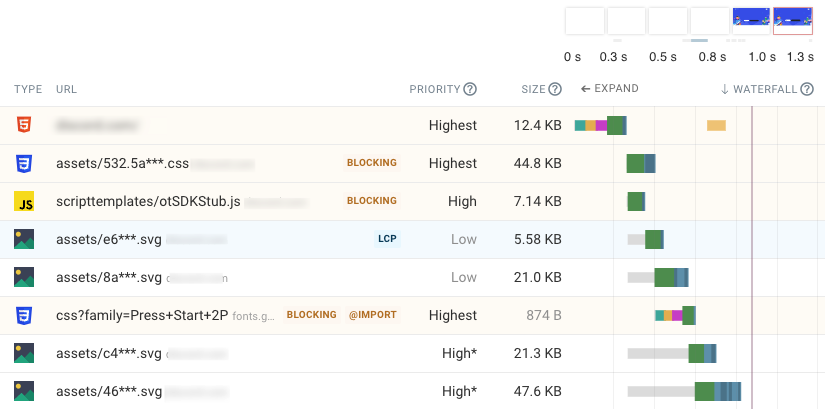 Screenshot of a DebugBear test showing what resources were loaded by a page, September 2023
You can often achieve some improvements just by removing unnecessary third-party code or reconfiguring your website theme. However, for a custom-built website you will often need help from your development team to implement fixes.
Should You Worry About A Poor Lighthouse Score?
As long as your real visitor metrics are in the green, you won’t get penalized by Google.
However, you may still wish to optimize your website further to provide a better experience to people using slower mobile devices and who have worse internet connections.
If you want to run a lab test that uses more typical settings for real users you can use DebugBear and select the “Mobile Fast” config when setting up your page.
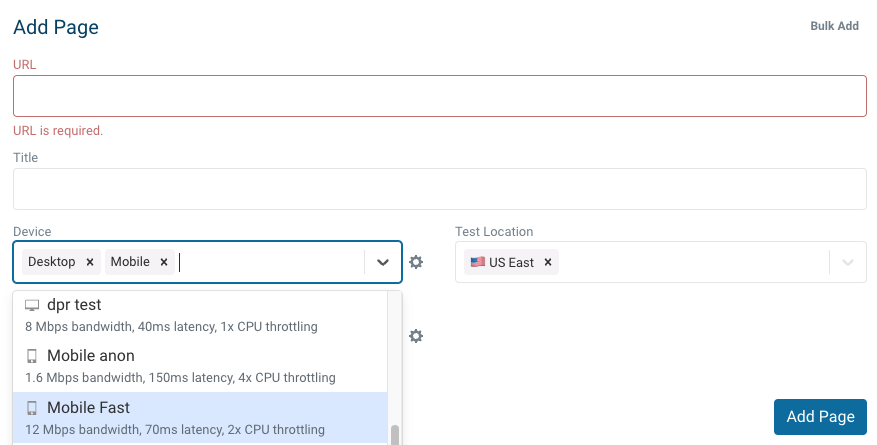 Screenshot of device and network configuration options in DebugBear, September 2023
Google Lighthouse Troubleshooting
Sometimes, the differences between Lighthouse tests and CWV tests can be striking, so let’s talk through what you may be seeing.
Why Are Lighthouse Test Results Worse Than Google’s Core Web Vitals?
When running a test on PageSpeed Insights, you’ll often find that the metrics reported by Lighthouse are noticeably worse than the real user data.
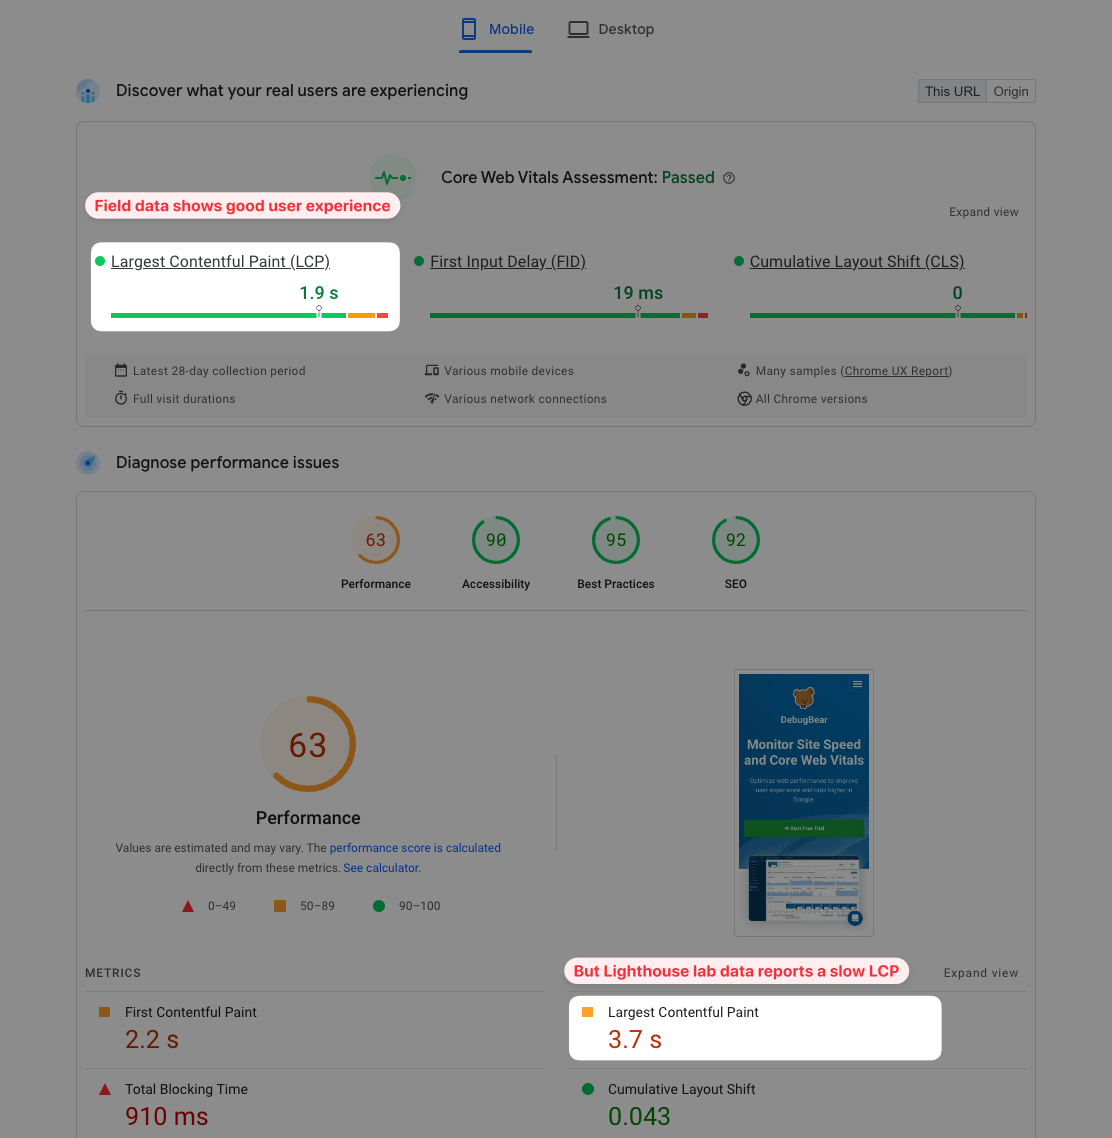 Screenshot showing a discrepancy between Lighthouse and real user data, September 2023
What’s Responsible For The Score Discrepancy?
The network conditions that Lighthouse uses are significantly worse than what a typical real user would experience.
And that results in lower page speed scores.
For example, Lighthouse uses a network latency of 150 milliseconds, while 40 milliseconds of latency is more common in the United States. Lighthouse uses a mobile latency of 1.6 megabits per second, compared to a typical real user bandwidth of 35 megabits per second.
Google looks at the 75th percentile when calculating the real user metrics. If your Largest Contentful Paint score is 3 seconds that means 75% of visitors wait less than 3 seconds and 25% wait longer than 3 seconds.
In contrast, the metrics reported by Lighthouse are more representative of the slowest 5-10% of user experiences.
Why Does The Lighthouse Performance Score Vary Between Runs?
If you run Lighthouse twice on the same website you’re likely to see two different Performance scores. What’s causing that variation?
Each Lighthouse result only provides data on a single load of your website.
No two page loads will be identical and have exactly the same load time.
There can be many reasons for this, for example:
- Random variation: your website is loading 10s or 100s of resources and the servers involved will sometimes be quick to respond and sometimes respond more slowly.
- Different content: if your page contains ads or frequently-changing content and page speed varies with the content that’s being loaded.
- Variation in background activity: if other websites are open in the background or the computer is performing other tasks this will affect your Lighthouse result.
In addition to that, Lighthouse scores that were collected in different environments – for example on PageSpeed Insights and on your own computer – will not be directly comparable. That’s because your computer may have a faster CPU than the Google server, or you might be located closer to the data center serving the website.
Set Up Continuous Monitoring For Lighthouse Scores & Core Web Vitals
Want to improve your Lighthouse scores and overall page speed? DebugBear allows you to go beyond one-off tests and test your website continuously.
With DebugBear you can:
- See how your Lighthouse scores change over time.
- Access detailed a detailed analysis that goes beyond the Lighthouse report.
- Get alerted to and understand score regressions.
- Show off the improvements that your team has implemented.
- Monitor Google CrUX metrics and collect custom real user data.
Sign up for a free 14-day trial today.
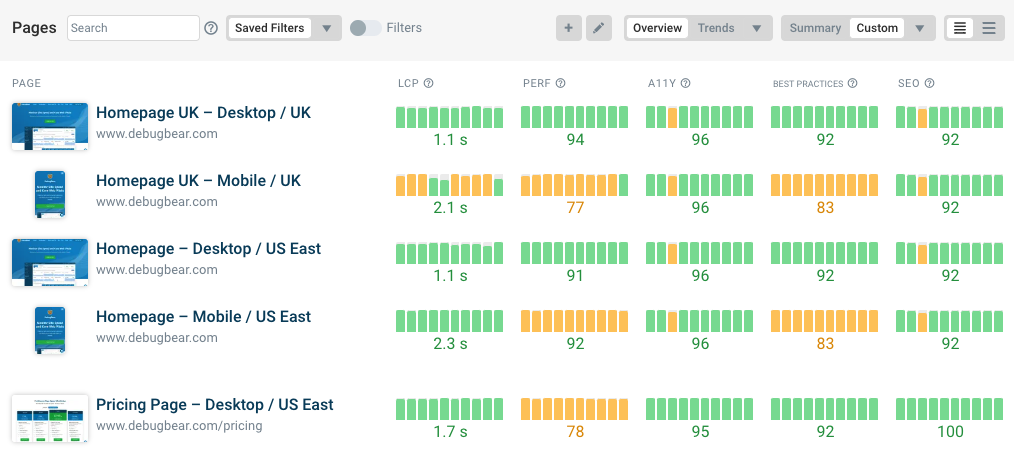 Overview of performance metrics and Lighthouse scores in DebugBear, September 2023
In addition to generating daily Lighthouse reports, DebugBear also generates custom reports to help you optimize your Core Web Vitals.
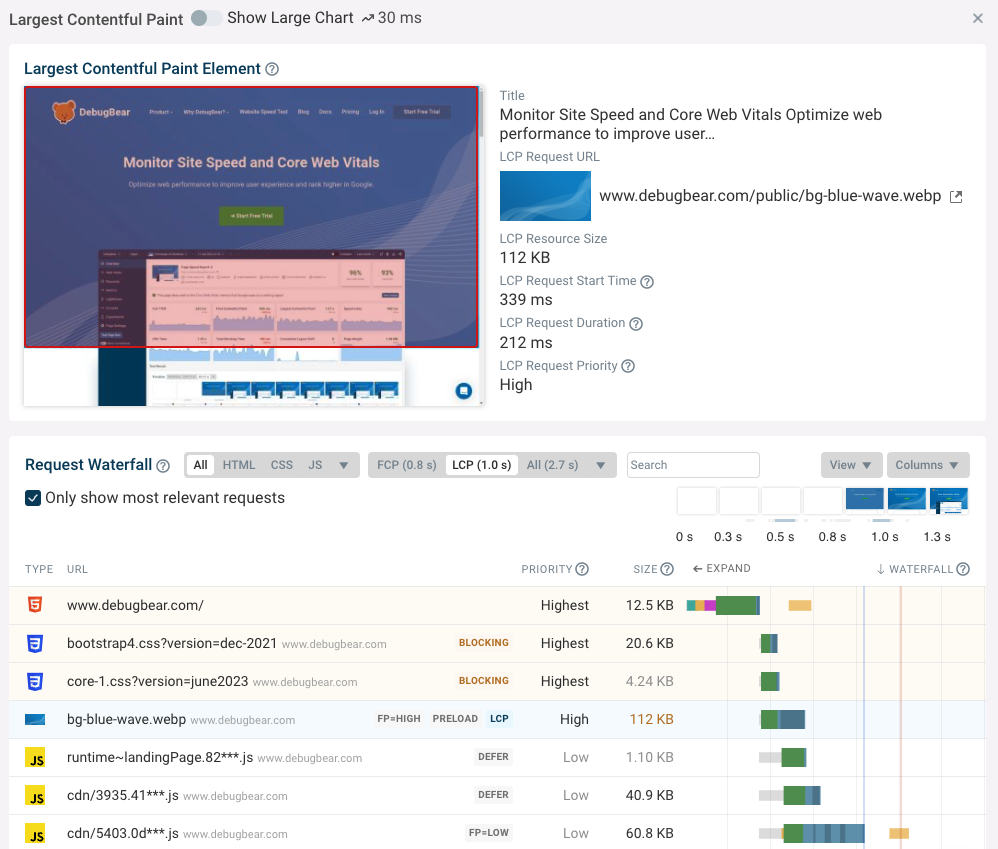 DebugBear screenshot showing debug data for the Largest Contentful Paint metric, September 2023
Seen in regression in your Lighthouse score? Compare mode allows you to see exactly what changed and identify the audit you need to fix.
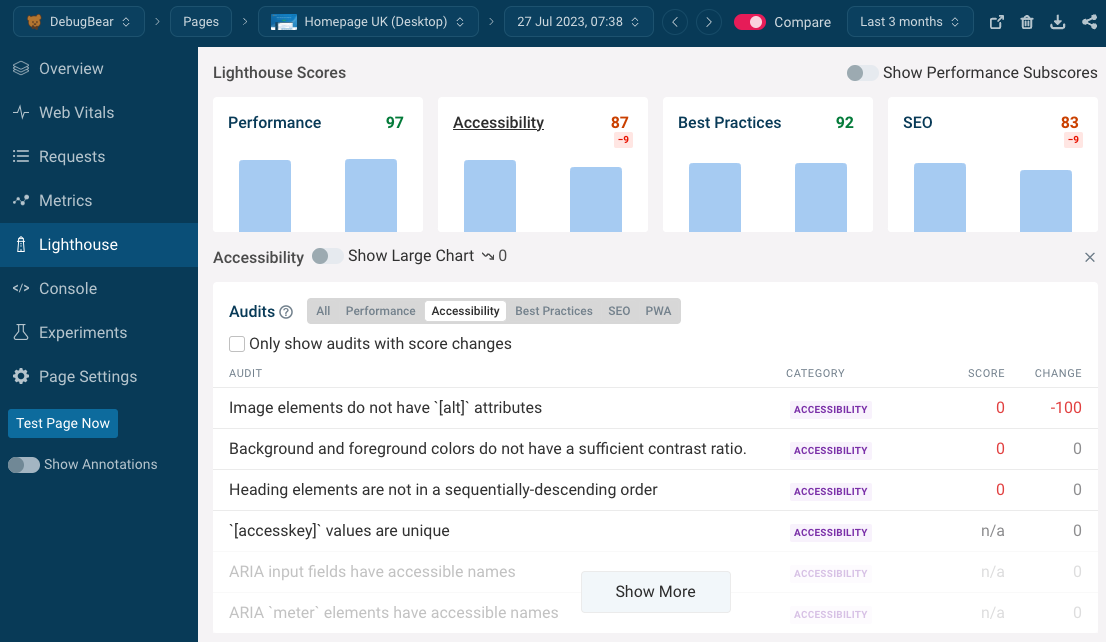 Checking a Lighthouse regression in DebugBear, September 2023
Ready to start optimizing your website? Sign up for DebugBear and get the data you need to deliver great user experiences.
Image Credits
Featured Image: Image by DeBugBear. Used with permission.

