

Over the last month, Google has announced a number of advancements to how they will be measuring user experience through key speed and performance metrics.
Coincidentally, I have been working on putting together a Python script that uses the Google PageSpeed Insights (PSI) API to collect metrics for a number of pages at a time, without needing to run the test for each individual URL.
Following the announcements from Google, I thought now would be the perfect time to share it, as well as explain how you can create this beginner-friendly Python script.
The best thing about the script is, that once you have the foundations set up, you will be able to extract a number of different metrics that can be found in the page speed test, as well as the Lighthouse analysis.
An Introduction to Web Vital Metrics
At the beginning of May, Google introduced Core Web Vitals which are a subset of its key Web Vitals metrics.
These metrics are used to provide guidance around the quality of user experience on a website.
Google has described them as a way to “help quantify the experience of your site and identify opportunities to improve,” further highlighting their shift towards focusing on user experience.
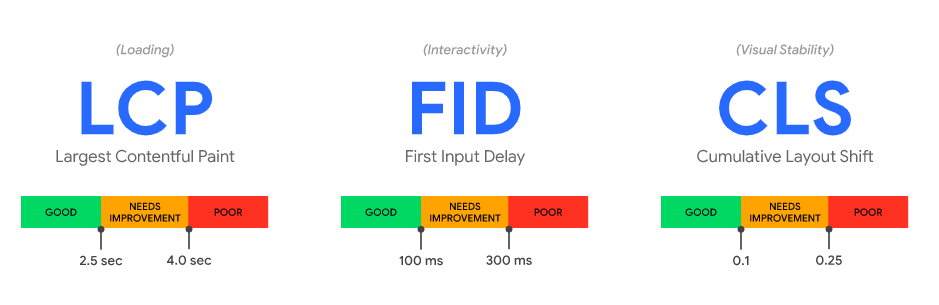
Core Web Vitals are real-world, user-centric metrics that measure the key aspects of a user’s experience; load time, interactivity, and stability.
I won’t go into too much detail explaining these in this post – you can find out more here – but these new metrics are:
- Largest Contentful Paint.
- First Input Delay.
- Cumulative Layout Shift.
In addition to this, Google announced last week that they will be introducing a new search ranking signal which will combine these metrics together with existing page experience signals, such as mobile-friendliness and HTTPS security, to ensure they continue to serve high-quality websites to users.
Monitoring Performance Metrics
This update is expected to roll out in 2021 and Google has confirmed that no immediate action is needed to be taken.
However, in order to help us prepare for these changes, they have updated the tools used to measure page speed including PSI, Google Lighthouse, and the Google Search Console Speed Report.
Where Does the Pagespeed Insights API Come Into This?
Google’s PageSpeed Insights is a useful tool to view a summary of a web page’s performance, and uses both field and lab data to generate results.
It is a great way to gain an overview of a handful of URLs, as it is used on a page-per-page basis.
However, if you are working on a large site and wish to gain insights at scale, the API can be beneficial to analyze a number of pages at a time, without needing to plug in the URLs individually.
A Python Script for Measuring Performance
I have created the following Python script to measure key performance metrics at scale, in order to save time spent manually testing each URL.
This script uses Python to send requests to the Google PSI API in order to collect and extract the metrics which are displayed within both PSI and Lighthouse.
I decided to write this script in Google Colab as it is a great way to get started writing Python and allows for easy sharing, so this post will run through the setup using Google Colab.
However, it can also be run locally, with a few tweaks to the uploading and downloading of data.
It’s important to note that some steps may take some time to complete, particularly when each URL is run through the API, in order to not overload it with requests.
Therefore, you can run the script in the background and come back to it when the steps have been completed.
Let’s walk through the steps needed to get this script up and running.
Step 1: Install the Required Packages
Before we start writing any code, we need to install some Python packages which are required before we can use the script. These are easy to install using the import function.
The packages we will need are:
- urllib: For working with, opening, reading and parsing URLs.
- json: Allows you to convert a JSON file to Python or a Python file to JSON.
- requests: An HTTP library to send all kinds of HTTP requests.
- pandas: Mainly used for data analysis and manipulation, we’re using it to create DataFrames.
- time: A module for working with times, we’re using it to provide a time break between requests.
- files: From Google Colab, this will allow you to upload and download files.
- io: The default interface used to access files.
# Import required packages
import json
import requests
import pandas as pd
import urllib
import time
from google.colab import files
import io
Step 2: Set up an API Request
The next step is to set up the API request. Full instructions can be found here, but essentially the command will look like this:
https://www.googleapis.com/pagespeedonline/v5/runPagespeed?url={yourURL}/&strategy=mobile/&key={yourAPIKey}
This will allow you to append your URL, strategy (desktop or mobile), and API key.
To use it with Python, we will use the urllib request library urllib.request.urlopen and add it to a variable called result so that we can store the results and use them again within the script.
# Define URL
url = 'https://www.example.co.uk'

# API request url
result = urllib.request.urlopen('https://www.googleapis.com/pagespeedonline/v5/runPagespeed?url={}/&strategy=mobile'\
.format(url)).read().decode('UTF-8')

print(result)
Step 3: Testing the API
In order to test the API is set up correctly, as well as gain an understanding of what is generated during the test, I ran one URL through the API using the simple urllib.request method.
Once this had completed, I then converted the result to a json file and downloaded it, in order to view the outcome.
# Convert to json format
result_json = json.loads(result)

print(result_json)

with open('result.json', 'w') as outfile:
  json.dump(result_json, outfile)

files.download('result.json')
(Please note this method is for converting and downloading JSON files in Google Colab.)
Step 4: Read the JSON File
The JSON file will typically look something like this, when opened in your code editor of choice.
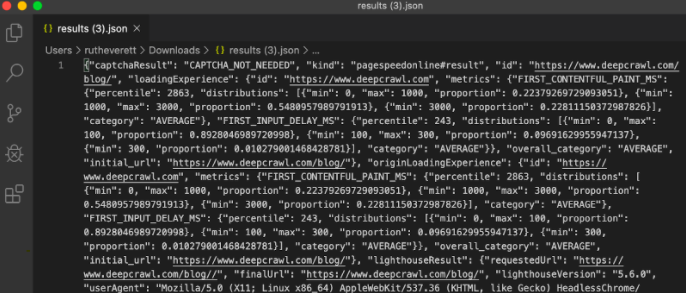
It’s fairly difficult to understand, but using an online JSON viewer will enable you to convert it to a readable Tree View.
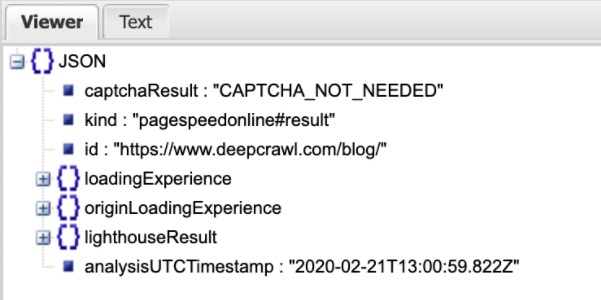
The JSON file displays Field Data, which is stored under loadingExperience, and Lab Data which you can find under lighthouseResult.
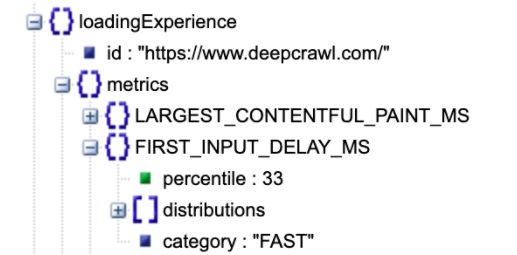
In order to extract the desired metrics, we can utilize the format of the JSON file, as we are able to see which metric sits under each section.
For example, First Input Delay is found under loadingExperience.
While First Contentful Paint is found under lighthouseResult.
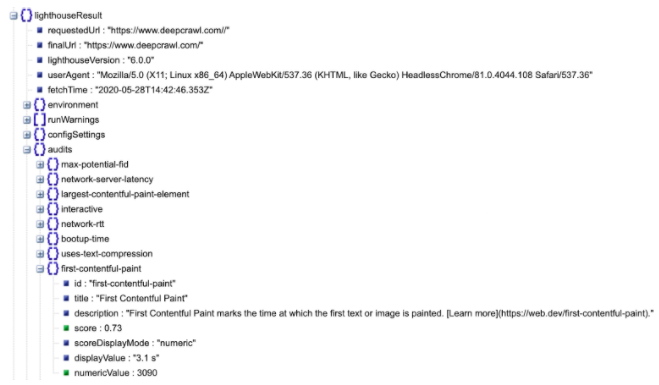
There are a lot of other metrics stored under the lighthouseResult audits, such as:
- Speed Index.
- First Contentful Paint.
- Cumulative Layout Shift.
Step 5: Upload a CSV & Store as a Pandas Dataframe
The next step is to upload a CSV file of URLs that we want to run through the PSI API. You can generate a list of your site’s URLs from a crawling tool, such as DeepCrawl.
As we are using the API, I would recommend using a smaller sample set of URLs here, especially if you have a large site.
For example, you could use pages with the highest levels of traffic, or pages that generate the most revenue. Alternatively, if your site has templates it would be great for testing sets of these.
You can also add a column-header variable here, which we will use when iterating through the list. Ensure this matches the column header name in the CSV file you upload:
uploaded = files.upload()
#if your column header is something other than 'url' please define it here
column_header='url'
(Please note this method is for uploading CSV files in Google Colab.)
Once this has been uploaded, we will then use the Pandas library to turn the CSV into a DataFrame, which we can iterate through in the following steps.
# Get the filename from the upload so we can read it into a CSV.
for key in uploaded.keys():
filename = key
# Read the selected file into a Pandas Dataframe
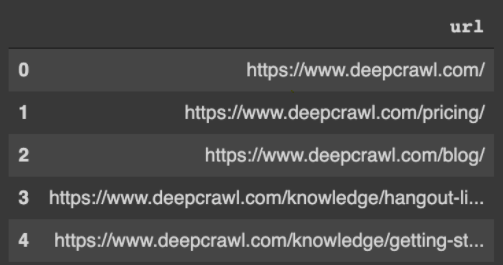
df = pd.read_csv(io.BytesIO(uploaded[filename]))
df.head()The DataFrame will look like this, starting with zero-indexing.
Step 6: Save the Results to a Response Object
The next step involves using a for loop to iterate the DataFrame of URLs we have just created through the PSI API.
A for loop allows us to iterate through the list we have uploaded and execute the command for each item. Then we can save the results into a response object and convert it into a JSON file.
response_object = {}

# Iterate through the df
for x in range(0, len(df)):

        # Define request parameter
        url = df.iloc[x][column_header]

        # Make request
        pagespeed_results = urllib.request.urlopen('https://www.googleapis.com/pagespeedonline/v5/runPagespeed?url={}&strategy=mobile'.format(url)).read().decode('UTF-8')

        # Convert to json format
        pagespeed_results_json = json.loads(pagespeed_results)

        # Insert returned json response into response_object
        response_object[url] = pagespeed_results_json
        time.sleep(30)

        print(response_object[url])
We will be using x in range here, which will represent the URLs that we are running through the loop, as well as (0, len) which allows the loop to run through all the URLs in the DataFrame, no matter how many are included.
The response object prevents the URLs from overriding each other as you loop through and allows us to save the data for future use.
This is also where we will use the column header variable to define the URL request parameter, before converting it to a JSON file.
I have also set the time to sleep here to 30 seconds, to reduce the number of API calls made consecutively.
Alternatively, you can append an API key to the end of the URL command if you wish to make quicker requests.
Indentation is also important here because, as each step is a part of the for loop, they must be indented within the command.
Step 7: Create a Dataframe to Store the Responses
We also need to create a DataFrame that will store the metrics we want to extract from the response object.
A DataFrame is a data structure similar to a table, with columns and rows that store data. We simply need to add a column for each metric and name it appropriately, as so:
# Create dataframe to store responses
df_pagespeed_results = pd.DataFrame(columns=
          ['url',
          'Overall_Category',
          'Largest_Contentful_Paint',
          'First_Input_Delay',
          'Cumulative_Layout_Shift',
          'First_Contentful_Paint',
          'Time_to_Interactive',
          'Total_Blocking_Time',
          'Speed_Index'])

print(df_pagespeed_results)
For the purpose of this script, I have used the Core Web Vital metrics, together with the additional loading and interactivity metrics used in the current Lighthouse version.
These metrics each have different weights which are then used in the overall performance score:
- Largest Contentful Paint (LCP)
- First Input Delay (FID)
- Cumulative Layout Shift (CLS)
- First Contentful Paint (FCP)
- Time to Interactive (TTI)
- Total Blocking Time (TBT)
You can find out more about each metric, together with how to interpret the scores, on their individual landing pages which are linked above.
I have also chosen to include the Speed Index and the overall category which will provide either a slow, average, or fast score.
Step 8: Extract the Metrics From the Response Object
Once we have the response object saved, we can now filter this and extract just the metrics we want.
Here we will once again use a for loop to iterate through the response object file and set up a sequence of list indexes to return just the specific metrics.
For this, we will define the column name from the DataFrame, as well as the specific category of the response object we will be pulling each metric from, for each URL.
for (url, x) in zip(
    response_object.keys(),
    range(0, len(response_object))
):

        # URLs
        df_pagespeed_results.loc[x, 'url'] =\
            response_object[url]['lighthouseResult']['finalUrl']

        # Overall Category
        df_pagespeed_results.loc[x, 'Overall_Category'] =\
            response_object[url]['loadingExperience']['overall_category']

        # Core Web Vitals

        # Largest Contentful Paint
        df_pagespeed_results.loc[x, 'Largest_Contentful_Paint'] =\
        response_object[url]['lighthouseResult']['audits']['largest-contentful-paint']['displayValue']

        # First Input Delay
        fid = response_object[url]['loadingExperience']['metrics']['FIRST_INPUT_DELAY_MS']
        df_pagespeed_results.loc[x, 'First_Input_Delay'] = fid['percentile']

        # Cumulative Layout Shift
        df_pagespeed_results.loc[x, 'Cumulative_Layout_Shift'] =\
        response_object[url]['lighthouseResult']['audits']['cumulative-layout-shift']['displayValue']

        # Additional Loading Metrics

        # First Contentful Paint
        df_pagespeed_results.loc[x, 'First_Contentful_Paint'] =\
        response_object[url]['lighthouseResult']['audits']['first-contentful-paint']['displayValue']

        # Additional Interactivity Metrics

        # Time to Interactive
        df_pagespeed_results.loc[x, 'Time_to_Interactive'] =\
        response_object[url]['lighthouseResult']['audits']['interactive']['displayValue']

        # Total Blocking Time
        df_pagespeed_results.loc[x, 'Total_Blocking_Time'] =\
        response_object[url]['lighthouseResult']['audits']['total-blocking-time']['displayValue']

        # Speed Index
        df_pagespeed_results.loc[x, 'Speed_Index'] =\
        response_object[url]['lighthouseResult']['audits']['speed-index']['displayValue']
I have set this script up to extract the key metrics I mentioned above so you can use it straight away to collect this data.
However, it is possible to pull out a number of other useful metrics that can be found in both the PSI tests, as well as the Lighthouse analysis.
This is where the JSON file is useful for reviewing where each metric sits in the list.
For example, when extracting metrics from the Lighthouse audits, such as the display value of Time to Interactive, you would use the following:
df_pagespeed_results.loc[x, 'Time_to_Interactive'] =\
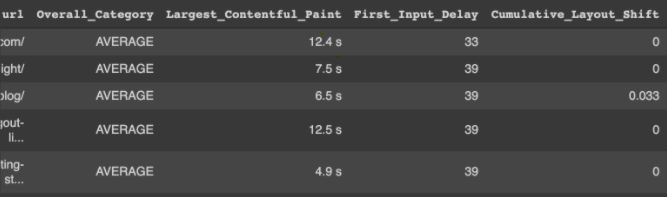
response_object[url]['lighthouseResult']['audits']['interactive']['displayValue']Once again, it’s important to make sure each of these sit within the loop, otherwise they will not be included within the iteration and only one result will be generated for one URL.
Our final DataFrame will look like this;
Step 9: Turn the DataFrame Into a CSV file
The final step is to create a summary file to collect all of the results, so we can turn this into a format that we can easily analyze, for example, a CSV file.
summary = df_pagespeed_results

df_pagespeed_results.head()

#Download csv file
summary.to_csv('pagespeed_results.csv')
files.download('pagespeed_results.csv')
(Please note this method is for converting and downloading CSV files in Google Colab.)
Exploring the Data Further
All of the metrics we have exported are currently stored as strings which is a Python datatype for text and characters.
As some of the metrics we are extracting are actually numeric values, you may wish to turn the strings into numerical datatypes, such as integers and floating point numbers.
Integers, also known as int, are the datatype for whole numbers, such as 1 and 10.
Floating point numbers, also known as float, are decimal point numbers such as 1.0 and 10.1.
There are two steps we need to take in order to convert our strings to numbers, the first is to replace the ‘s’ character (used to represent seconds) with a blank space.
We do this by using the .str.replace method on each column.
#Replace the 's' with a blank space so we can turn into numbers
df_pagespeed_results['Largest_Contentful_Paint'] = df_pagespeed_results.Largest_Contentful_Paint.str.replace('s', '')
df_pagespeed_results['First_Contentful_Paint'] = df_pagespeed_results.First_Contentful_Paint.str.replace('s', '')
df_pagespeed_results['Time_to_Interactive'] = df_pagespeed_results.Time_to_Interactive.str.replace('s', '')
df_pagespeed_results['Total_Blocking_Time'] = df_pagespeed_results.Total_Blocking_Time.str.replace('ms', '')
df_pagespeed_results['Speed_Index'] = df_pagespeed_results.Speed_Index.str.replace('s', '')
We will then use the .astype() method to convert the strings into either integers or floating point numbers:
#Turn strings into intergers or floats
df_pagespeed_results['Largest_Contentful_Paint'] = df_pagespeed_results.Largest_Contentful_Paint.astype(float)
df_pagespeed_results['Cumulative_Layout_Shift'] = df_pagespeed_results.Cumulative_Layout_Shift.astype(int)
df_pagespeed_results['First_Contentful_Paint'] = df_pagespeed_results.First_Contentful_Paint.astype(float)
df_pagespeed_results['Time_to_Interactive'] = df_pagespeed_results.Time_to_Interactive.astype(float)
df_pagespeed_results['Speed_Index'] = df_pagespeed_results.Speed_Index.astype(float)
Once we have done this, you can use a number of different methods to evaluate the data further.
For example, you can use data visualization libraries such as matplotlib or seaborn to visualize the metrics, as well as to measure how they change over time and group results into slow, medium, and fast buckets.
I won’t cover these in this article, as we have already covered a lot, but please feel free to reach out if you would like to find out more.
In Conclusion
This script has ultimately helped me to measure key page speed and performance metrics for a group of URLs, as well as visualize the results in order to identify pages where improvements need to be made.
It also allows you to monitor the results over time and quantify the improvements that have been made.
I also created a script specifically to measure the percentiles and categories for the three Core Web Vitals. You can find that here.
I hope this has been helpful for anyone looking to automate their performance testing and explore the PSI API further.
Please feel free to save a copy of this Colab file and use it to help measure and monitor your page speed, or follow the steps to write your own. You can access all of the code snippets I shared in this post here.
More Resources:
- An Introduction to Python for Technical SEO
- A 10-Step Process for Understanding Site Performance & Automating Speed Testing
- How to Build Speed Dashboards in Google Data Studio
Image Credits
All screenshots taken by author, June 2020
