

The Google Analytics API provides access to Google Analytics (GA) report data such as pageviews, sessions, traffic source, and bounce rate.
The official Google documentation explains that it can be used to:
- Build custom dashboards to display GA data.
- Automate complex reporting tasks.
- Integrate with other applications.
You can access the API response using several different methods, including Java, PHP, and JavaScript, but this article, in particular, will focus on accessing and exporting data using Python.
This article will just cover some of the methods that can be used to access different subsets of data using different metrics and dimensions.
I hope to write a follow-up guide exploring different ways you can analyze, visualize, and combine the data.
Setting Up The API
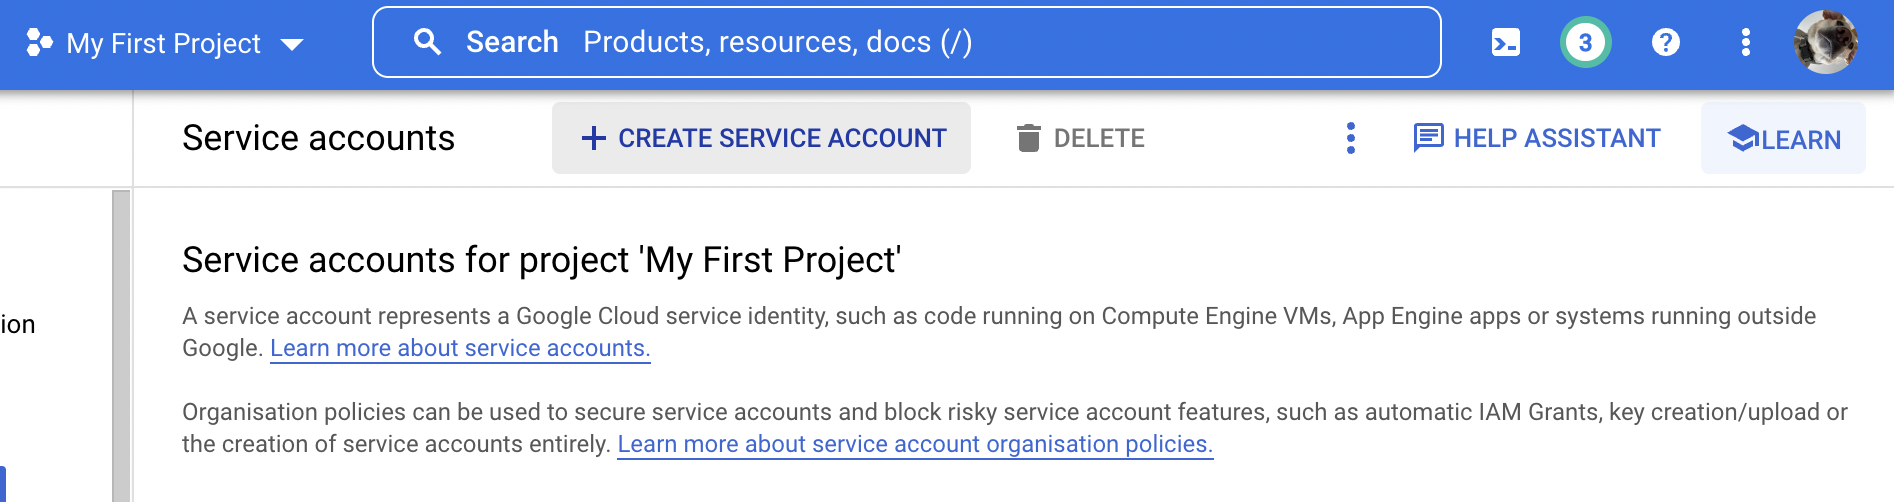
Creating A Google Service Account
The first step is to create a project or select one within your Google Service Account.
Once this has been created, the next step is to select the + Create Service Account button.
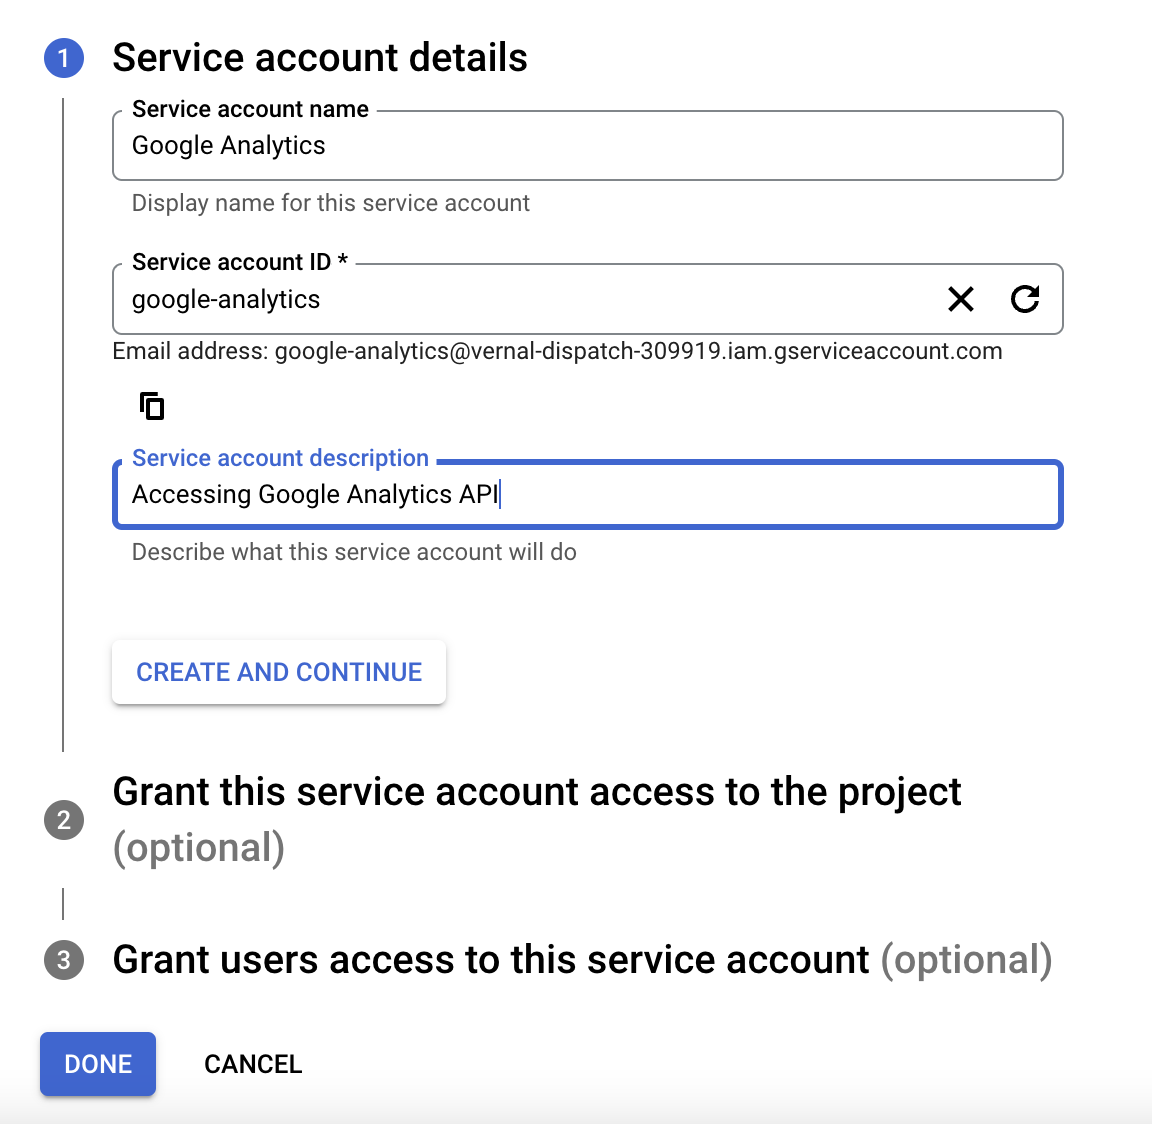
You will then be promoted to add some details such as a name, ID, and description.
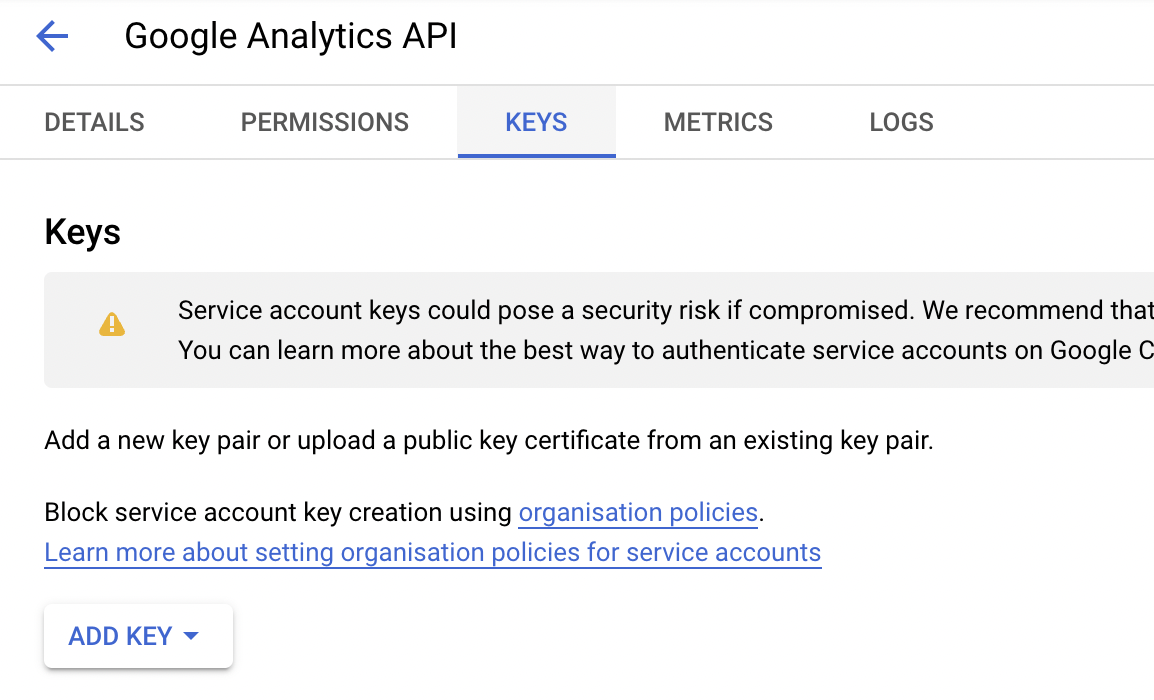
Once the service account has been created, navigate to the KEYS section and add a new key.
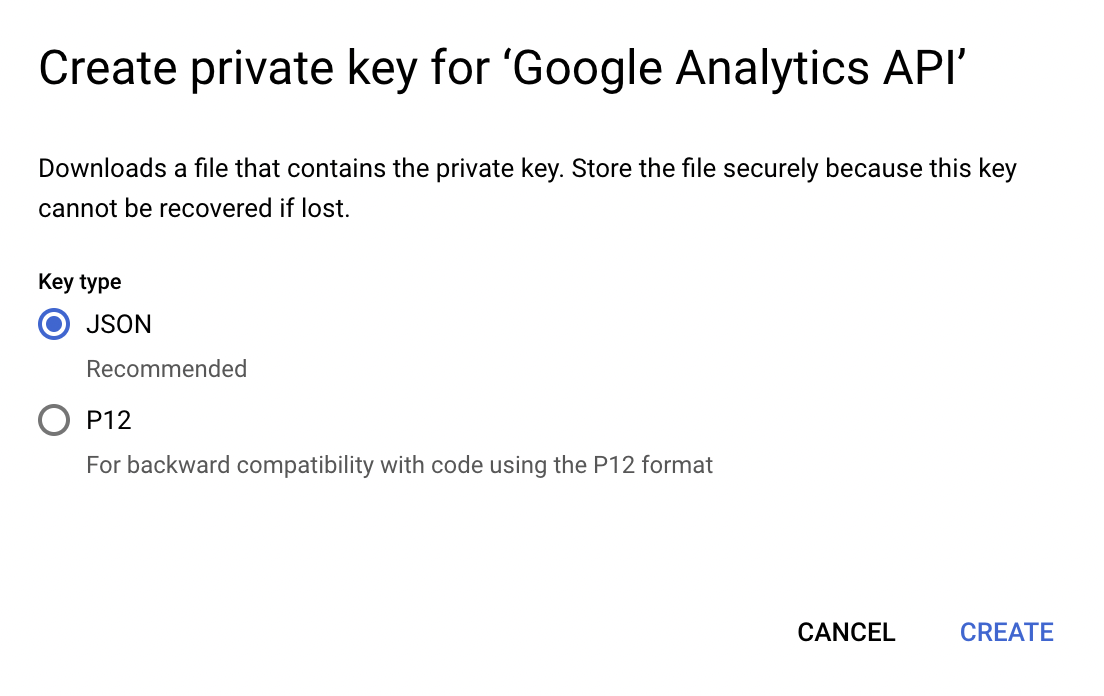
This will prompt you to create and download a private key. In this instance, select JSON, and then create and wait for the file to download.
Add To Google Analytics Account
You will also want to take a copy of the email that has been generated for the service account – this can be found on the main account page.
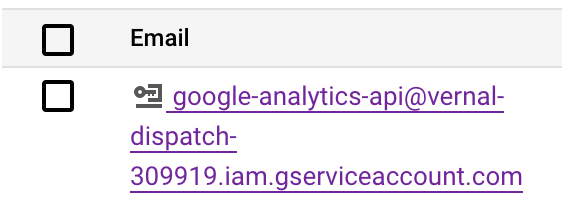
The next step is to add that email as a user in Google Analytics with Analyst permissions.

Enabling The API
The final and arguably most important step is ensuring you have enabled access to the API. To do this, ensure you are in the correct project and follow this link to enable access.
Then, follow the steps to enable it when promoted.
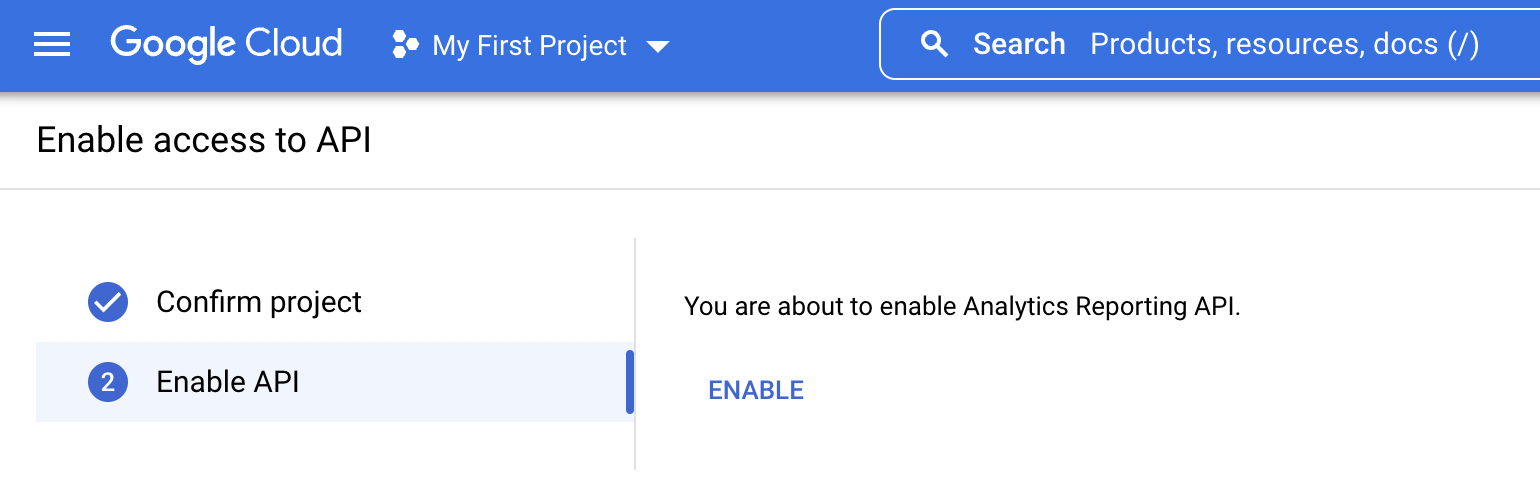
This is needed in order to access the API. If you miss this step, you will be prompted to complete it when first running the script.
Accessing The Google Analytics API With Python
Now everything is set up in our service account, we can start writing the script to export the data.
I chose Jupyter Notebooks to create this, but you can also use other integrated developer environments (IDEs) including PyCharm or VSCode.
Installing Libraries
The first step is to install the libraries that are needed to run the rest of the code.
Some are unique to the analytics API, and others are useful for future sections of the code.
!pip install --upgrade google-api-python-client
!pip3 install --upgrade oauth2client
from apiclient.discovery import build
from oauth2client.service_account import ServiceAccountCredentials
!pip install connect
!pip install functions
import connect
Note: When using pip in a Jupyter notebook, add the ! – if running in the command line or another IDE, the ! isn’t needed.
Creating A Service Build
The next step is to set up our scope, which is the read-only analytics API authentication link.
This is followed by the client secrets JSON download that was generated when creating the private key. This is used in a similar way to an API key.
To easily access this file within your code, ensure you have saved the JSON file in the same folder as the code file. This can then easily be called with the KEY_FILE_LOCATION function.
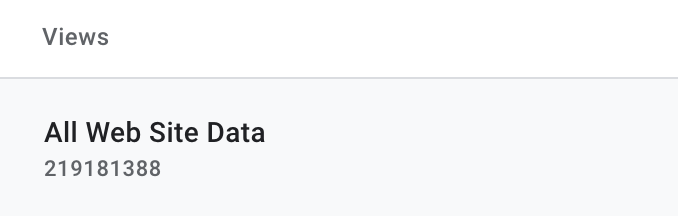
Finally, add the view ID from the analytics account with which you would like to access the data.
Altogether this will look like the following. We will reference these functions throughout our code.
SCOPES = ['https://www.googleapis.com/auth/analytics.readonly']
KEY_FILE_LOCATION = 'client_secrets.json'
VIEW_ID = 'XXXXX'
Once we have added our private key file, we can add this to the credentials function by calling the file and setting it up through the ServiceAccountCredentials step.
Then, set up the build report, calling the analytics reporting API V4, and our already defined credentials from above.
credentials = ServiceAccountCredentials.from_json_keyfile_name(KEY_FILE_LOCATION, SCOPES)
service = build('analyticsreporting', 'v4', credentials=credentials)
Writing The Request Body
Once we have everything set up and defined, the real fun begins.
From the API service build, there is the ability to select the elements from the response that we want to access. This is called a ReportRequest object and requires the following as a minimum:
- A valid view ID for the viewId field.
- At least one valid entry in the dateRanges field.
- At least one valid entry in the metrics field.
View ID
As mentioned, there are a few things that are needed during this build stage, starting with our viewId. As we have already defined previously, we just need to call that function name (VIEW_ID) rather than adding the whole view ID again.
If you wanted to collect data from a different analytics view in the future, you would just need to change the ID in the initial code block rather than both.
Date Range
Then we can add the date range for the dates that we want to collect the data for. This consists of a start date and an end date.
There are a couple of ways to write this within the build request.
You can select defined dates, for example, between two dates, by adding the date in a year-month-date format, ‘startDate’: ‘2022-10-27’, ‘endDate’: ‘2022-11-27’.
Or, if you want to view data from the last 30 days, you can set the start date as ‘30daysAgo’ and the end date as ‘today.’
Metrics And Dimensions
The final step of the basic response call is setting the metrics and dimensions. Metrics are the quantitative measurements from Google Analytics, such as session count, session duration, and bounce rate.
Dimensions are the characteristics of users, their sessions, and their actions. For example, page path, traffic source, and keywords used.
There are a lot of different metrics and dimensions that can be accessed. I won’t go through all of them in this article, but they can all be found together with additional information and attributes here.
Anything you can access in Google Analytics you can access in the API. This includes goal conversions, starts and values, the browser device used to access the website, landing page, second-page path tracking, and internal search, site speed, and audience metrics.
Both the metrics and dimensions are added in a dictionary format, using key:value pairs. For metrics, the key will be ‘expression’ followed by the colon (:) and then the value of our metric, which will have a specific format.
For example, if we wanted to get a count of all sessions, we would add ‘expression’: ‘ga:sessions’. Or ‘expression’: ‘ga:newUsers’ if we wanted to see a count of all new users.
With dimensions, the key will be ‘name’ followed by the colon again and the value of the dimension. For example, if we wanted to extract the different page paths, it would be ‘name’: ‘ga:pagePath’.
Or ‘name’: ‘ga:medium’ to see the different traffic source referrals to the site.
Combining Dimensions And Metrics
The real value is in combining metrics and dimensions to extract the key insights we are most interested in.
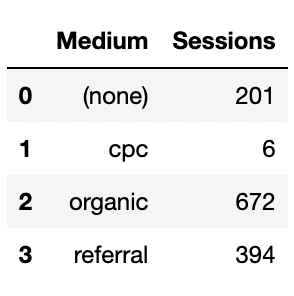
For example, to see a count of all sessions that have been created from different traffic sources, we can set our metric to be ga:sessions and our dimension to be ga:medium.
response = service.reports().batchGet(
    body={
        'reportRequests': [
        {
          'viewId': VIEW_ID,
          'dateRanges': [{'startDate': '30daysAgo', 'endDate': 'today'}],
          'metrics': [{'expression': 'ga:sessions'}],
          'dimensions': [{'name': 'ga:medium'}]
        }]
      }
  ).execute()
Creating A DataFrame
The response we get from the API is in the form of a dictionary, with all of the data in key:value pairs. To make the data easier to view and analyze, we can turn it into a Pandas dataframe.
To turn our response into a dataframe, we first need to create some empty lists, to hold the metrics and dimensions.
Then, calling the response output, we will append the data from the dimensions into the empty dimensions list and a count of the metrics into the metrics list.
This will extract the data and add it to our previously empty lists.
dim = []
metric = []

for report in response.get('reports', []):

columnHeader = report.get('columnHeader', {})
dimensionHeaders = columnHeader.get('dimensions', [])
metricHeaders = columnHeader.get('metricHeader', {}).get('metricHeaderEntries', [])
rows = report.get('data', {}).get('rows', [])

for row in rows:

dimensions = row.get('dimensions', [])
dateRangeValues = row.get('metrics', [])

for header, dimension in zip(dimensionHeaders, dimensions):
dim.append(dimension)

for i, values in enumerate(dateRangeValues):
for metricHeader, value in zip(metricHeaders, values.get('values')):
metric.append(int(value))
Adding The Response Data
Once the data is in those lists, we can easily turn them into a dataframe by defining the column names, in square brackets, and assigning the list values to each column.
df = pd.DataFrame()
df["Sessions"]= metric
df["Medium"]= dim
df= df[["Medium","Sessions"]]
df.head()
More Response Request Examples
Multiple Metrics
There is also the ability to combine multiple metrics, with each pair added in curly brackets and separated by a comma.
'metrics': [
              {"expression": "ga:pageviews"},
              {"expression": "ga:sessions"}
          ]
Filtering
You can also request the API response only returns metrics that return certain criteria by adding metric filters. It uses the following format:
if {metricName} {operator} {comparisonValue}
   return the metric
For example, if you only wanted to extract pageviews with more than ten views.
response = service.reports().batchGet(
    body={
        'reportRequests': [
        {
          'viewId': VIEW_ID,
          'dateRanges': [{'startDate': '30daysAgo', 'endDate': 'today'}],
          'metrics': [{'expression': 'ga:pageviews'}],
          'dimensions': [{'name': 'ga:pagePath'}],

"metricFilterClauses": [{
"filters": [{
"metricName": "ga:pageviews",
"operator": "GREATER_THAN",
"comparisonValue": "10"
}]
}]
}]
}
).execute()
Filters also work for dimensions in a similar way, but the filter expressions will be slightly different due to the characteristic nature of dimensions.
For example, if you only want to extract pageviews from users who have visited the site using the Chrome browser, you can set an EXTRACT operator and use ‘Chrome’ as the expression.
response = service.reports().batchGet(
    body={
        'reportRequests': [
        {
          'viewId': VIEW_ID,
          'dateRanges': [{'startDate': '30daysAgo', 'endDate': 'today'}],
          'metrics': [{'expression': 'ga:pageviews'}],
          "dimensions": [{"name": "ga:browser"}],
          "dimensionFilterClauses": [
        {
          "filters": [
            {
              "dimensionName": "ga:browser",
              "operator": "EXACT",
              "expressions": ["Chrome"]
            }
          ]
        }
      ]
    }
  ]
}
).execute()
Expressions
As metrics are quantitative measures, there is also the ability to write expressions, which work similarly to calculated metrics.
This involves defining an alias to represent the expression and completing a mathematical function on two metrics.
For example, you can calculate completions per user by dividing the number of completions by the number of users.
response = service.reports().batchGet(
    body={
        'reportRequests': [
        {
          'viewId': VIEW_ID,
          'dateRanges': [{'startDate': '30daysAgo', 'endDate': 'today'}],
          "metrics":
      [
        {
          "expression": "ga:goal1completions/ga:users",
          "alias": "completions per user"
        }
      ]
    }
  ]
}
).execute()
Histograms
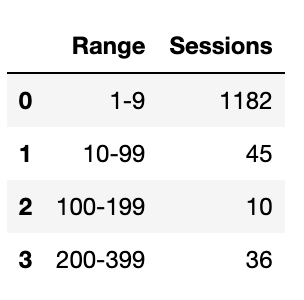
The API also lets you bucket dimensions with an integer (numeric) value into ranges using histogram buckets.
For example, bucketing the sessions count dimension into four buckets of 1-9, 10-99, 100-199, and 200-399, you can use the HISTOGRAM_BUCKET order type and define the ranges in histogramBuckets.
response = service.reports().batchGet(
    body={
        'reportRequests': [
        {
          'viewId': VIEW_ID,
          'dateRanges': [{'startDate': '30daysAgo', 'endDate': 'today'}],
          "metrics": [{"expression": "ga:sessions"}],
          "dimensions": [
        {
              "name": "ga:sessionCount",
              "histogramBuckets": ["1","10","100","200","400"]
        }
      ],
         "orderBys": [
        {
              "fieldName": "ga:sessionCount",
              "orderType": "HISTOGRAM_BUCKET"
        }
      ]
    }
  ]
}
).execute()
In Conclusion
I hope this has provided you with a basic guide to accessing the Google Analytics API, writing some different requests, and collecting some meaningful insights in an easy-to-view format.
I have added the build and request code, and the snippets shared to this GitHub file.
I will love to hear if you try any of these and your plans for exploring the data further.
More resources:
- A Guide To Google’s Knowledge Graph Search API For SEO
- How To Build A Google Analytics 4 Landing Page Report In Less Than 4 Minutes
- Google Analytics 4: Three Metrics You Should Know To Optimize Google Ads
Featured Image: BestForBest/Shutterstock
