
“Which of my Shopify customers are most valuable?”
If you’ve ever taken advantage of an email signup coupon only to never shop from that online store again, you can understand the importance of that question.
Identifying your most valuable customers enables you to fine-tune your marketing efforts to increase profitability while reducing the cost of deal seekers.
Your Shopify dashboard provides an overview of sales and product data, but be wary of using these insights alone to make major marketing decisions.
These prepackaged reports are available to hundreds of thousands of online shop owners. Your competitors are likely basing their strategy around the same bare-bone insights.
Basic reports will not give you a competitive edge.
If you are investing in SEO, content marketing, and/or paid advertising for your Shopify store, you need more robust business intelligence to guide you.
You need Google Analytics.
In this guide, you’ll learn how to gather expert-level insights in minutes using Google Analytics 4, even if you’re not an analytics expert.
You’ll discover reports to solve these common Shopify analytics challenges:
- What Shopify Marketing Efforts Are Driving the Most Sales?
- Which Organic Landing Pages Are Driving the Most Sales.
- What Organic Landing Pages Have the Greatest Potential to Increase Sales.
- Where Potential Are Customers Dropping Off.
- How to Calculate Lifetime Value (LTV) Accurately in Shopify.
- Defining Who Is Most Interested in Your Product.
1. What Shopify Marketing Efforts Are Driving the Most Sales?
For a high-level view, you can quickly see what marketing efforts are driving the most sales with a Google Analytics acquisition report.
This report shows how users first end up on your site. You’ll be able to see how each acquisition channel measures up when broken down by metrics like revenue, average order value, and conversion rate.
With this report, you can quickly identify what specific channels to increase (or decrease) marketing efforts in.
Acquisition Report in GA4, Step-by-Step
- Sign in to GA4 Account.
- Click Acquisition – located under Life Cycle in the left-hand column.
- Click User acquisition.
- Set Date Range.
- Set segment to First user…

Note: In step 5, segmentation will depend on how you’ve set up your marketing campaigns. For example, “First user medium” will show the medium that first brought the user to your store.
If you are running Google Ads or manual campaigns, “First user campaign” will display the marketing campaign that first acquired the user.
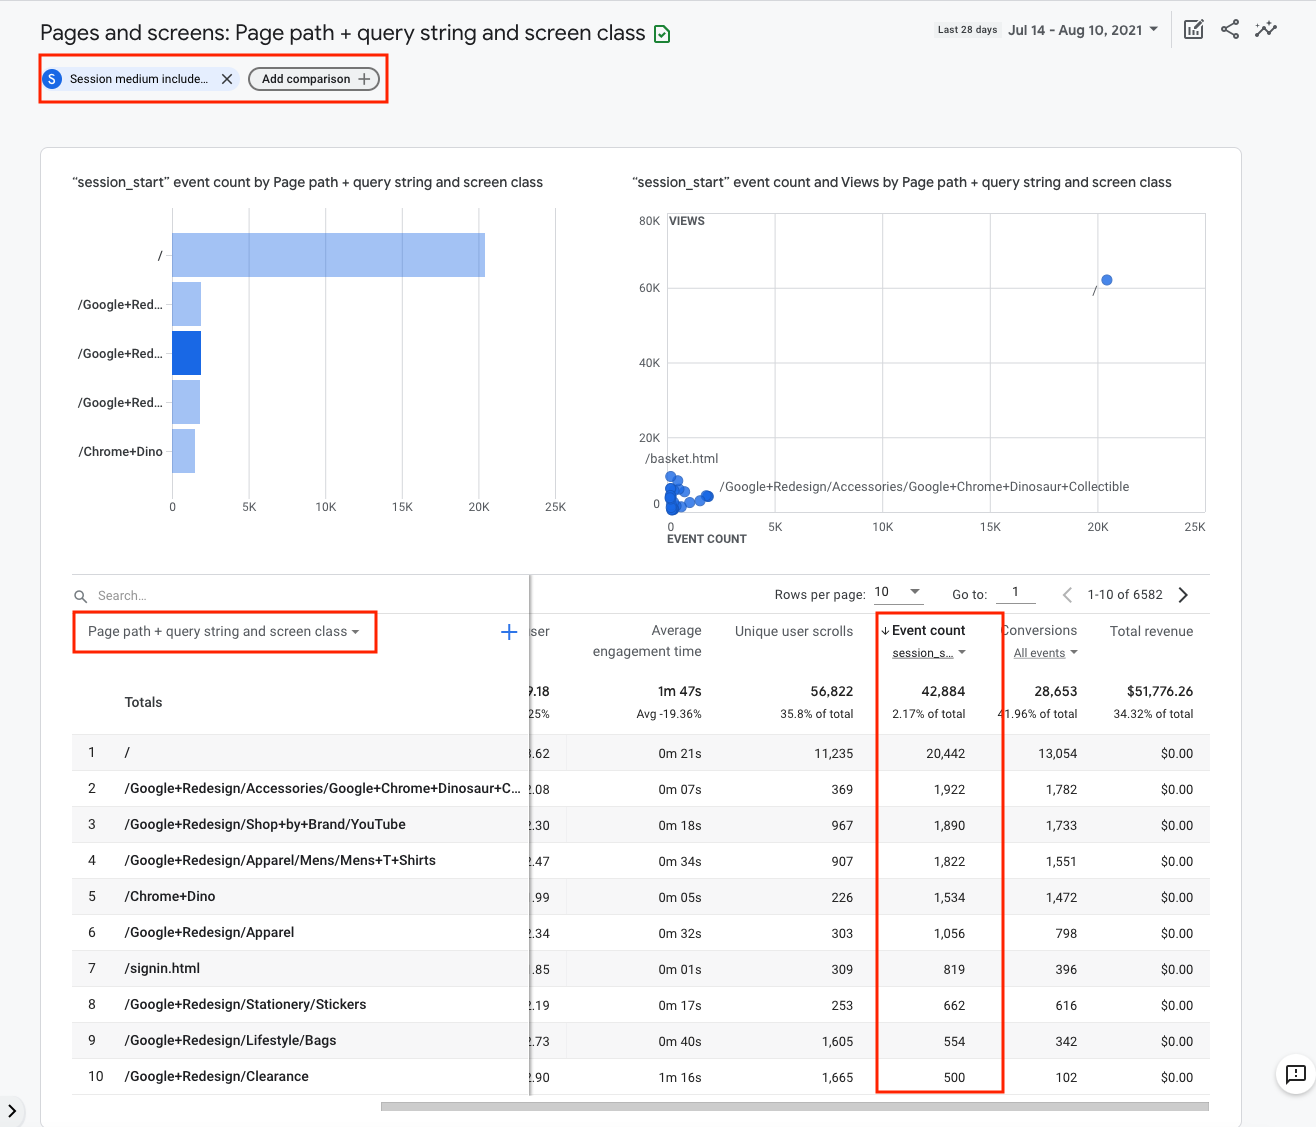
2. Which Organic Landing Pages Are Bringing the Most Traffic?
The Organic Traffic Landing Page report allows you to see which organic landing pages are bringing the most traffic.
With this data, you’ll be able to improve your content marketing funnel.
Organic Traffic Landing Page Report in GA4, Step-by-Step
- Sign in to GA4 Account.
- Click Engagement – located under Life Cycle in the left-hand column.
- Click Pages and Screens.
- Add comparison: Create a dimension to include session medium: organic.
- Set Date Range.
- Change Page Title to Page path + query string and screen class.
- Change Event Count All Events to session_start.
- Filter by session_start by clicking on the Event Count header.
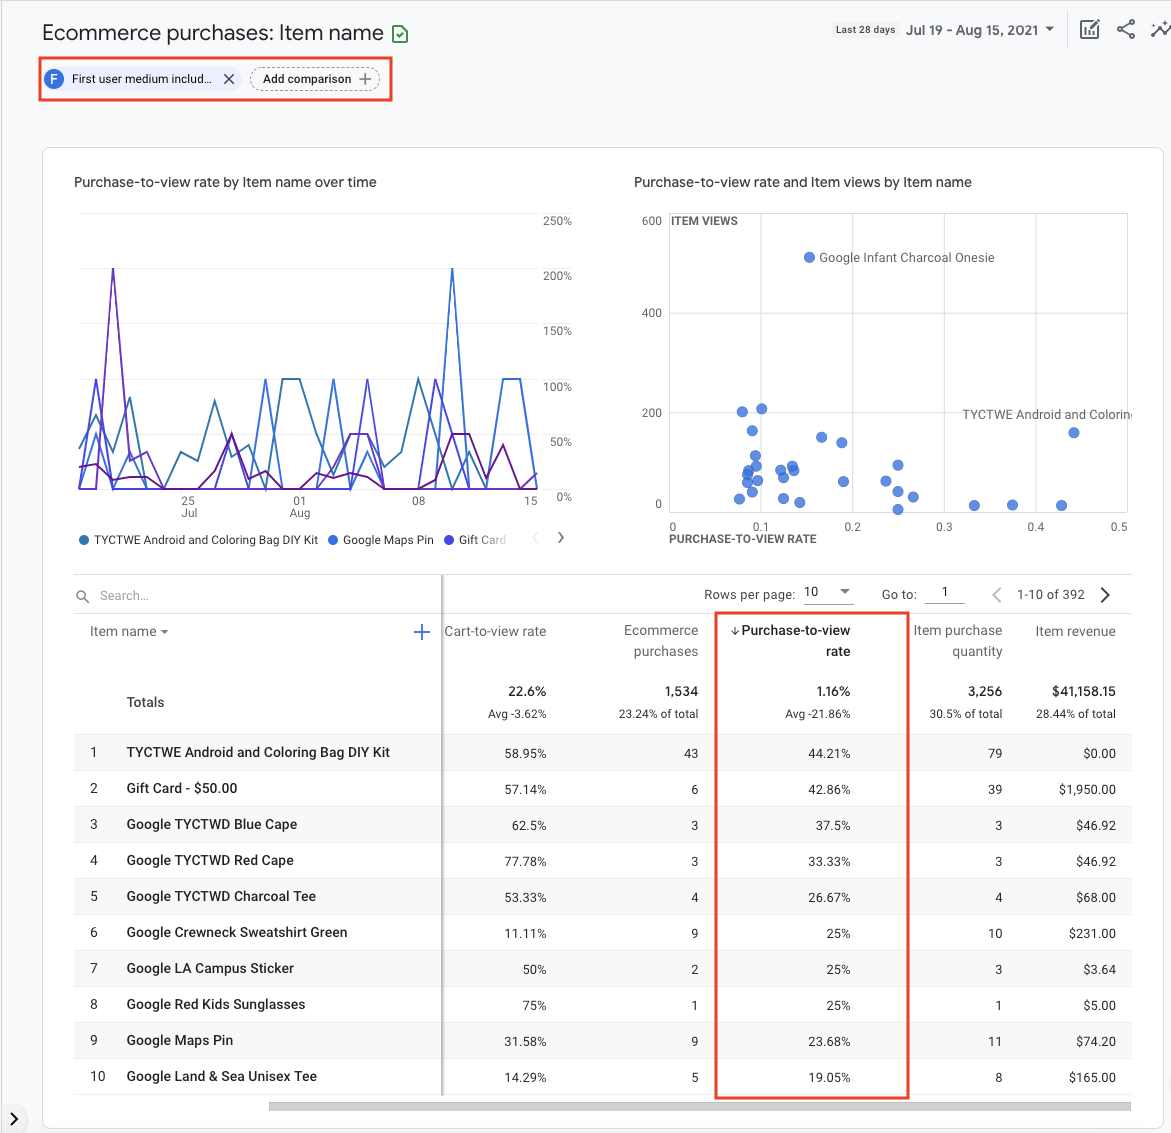
3. What Organic Landing Pages Have the Greatest Potential to Increase Sales?
SEO success, at its most basic level, is measured by increasing organic traffic to high-value pages by a specific percent.
Often, marketers will open the All Pages report and sort by revenue. This is an okay place to start – but there is a better metric for determining what organic landing pages will increase sales.
The buy-to-detail rate (or Purchase-to-view rate) report shows the conversion rate from product detail views to unique purchases.
Simply put, increasing relevant traffic to product pages with a high purchase-to-view rate has the greatest potential to increase sales.
Purchase-to-View Rate Report in GA4, Step-by-Step
- Sign in to GA4 Account.
- Click Monetization.
- Click Ecommerce purchases.
- Add comparison: Create a dimension to include session medium: organic.
- Set Date Range.
- Table is organized by item name.
- Click on the header, Purchase-to-view rate.
4. Where Potential Customers Are Dropping Off
The conversion funnel visualization report will help you understand where potential customers are dropping off.
Here, you’ll see where users are exiting the checkout flow and what actions they’re taking instead. These insights can be used to improve CVR efforts.
Previously, in Universal Analytics, we had to set up a conversion funnel in our client’s Analytics account.
Not anymore. With GA4 there is a new type of report in Explore (previously Analysis Hub) that is retroactive. If you’ve set up event and conversion data in GA4, the report will populate.
Conversion Funnel Visualization Report in GA4, Step-by-Step
- Sign in to GA4 Account.
- Click Explore – located in the far left-hand column.
- Select Funnel exploration – displays a sample report.
- Remove Steps.
- Click Pencil Icon.
- Step 1: view_item.
- Step 2: add_to_cart.
- Step 3: purchase.

Within Funnel Exploration in GA4, there are a lot of report features such as visualizing trends over time, seeing how long it takes users to complete each step, and seeing what users who drop out of your funnel are doing.
Here is what that looks like.
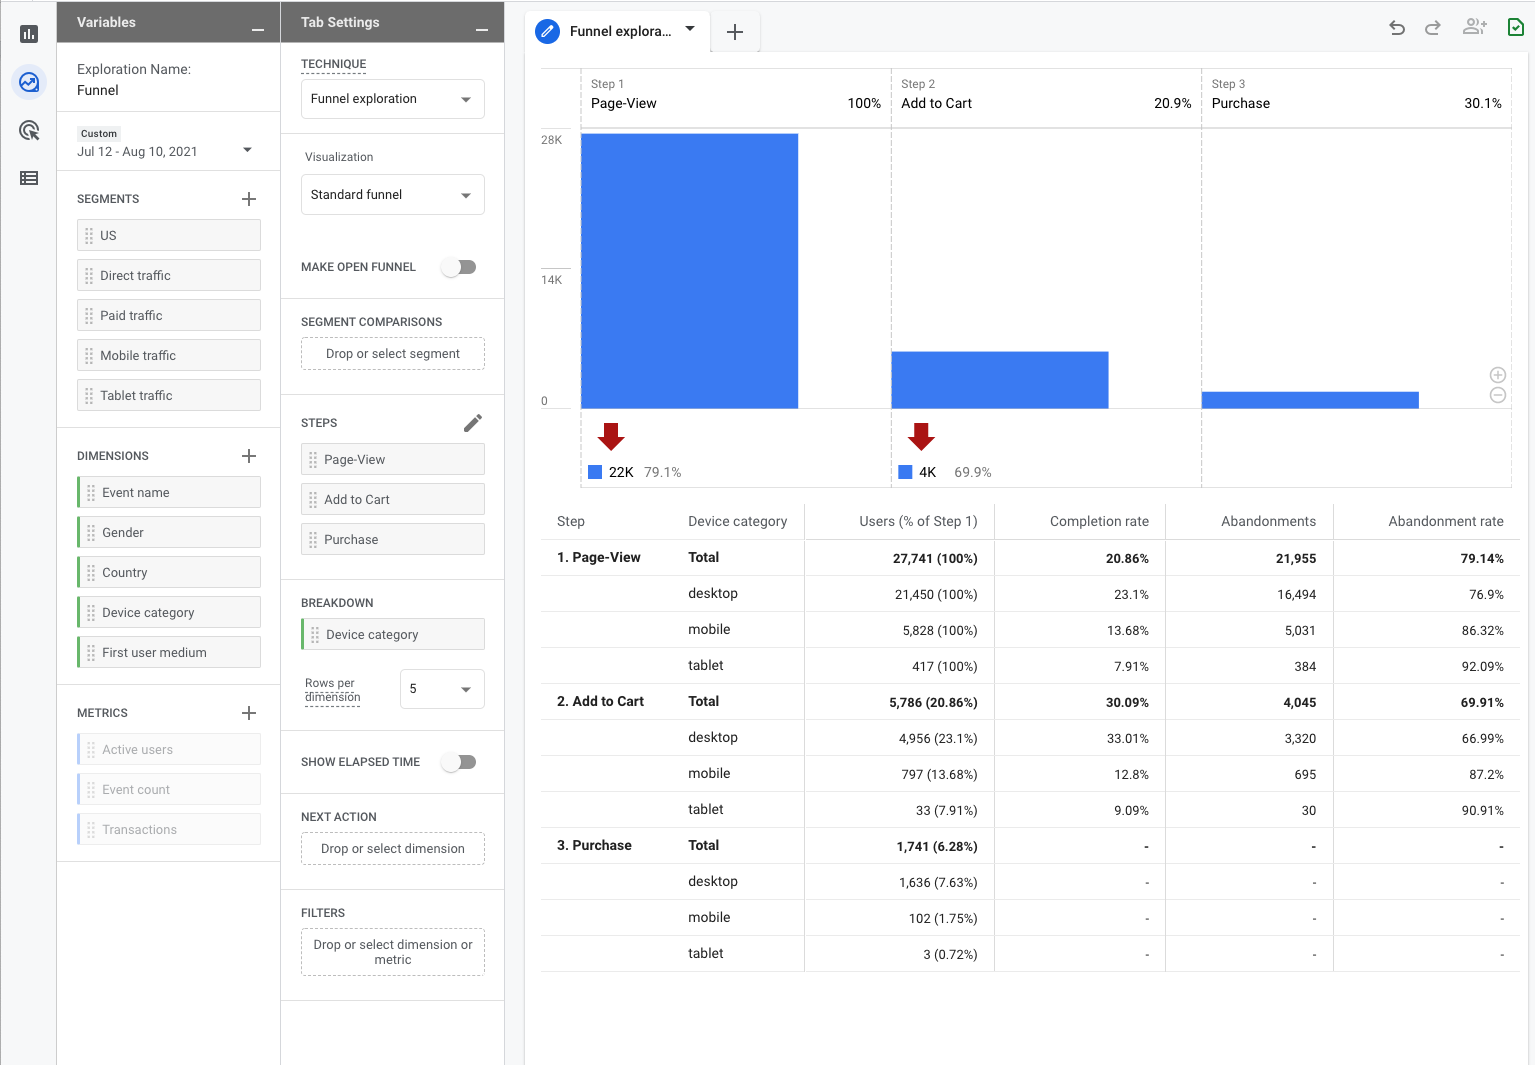
I highly encourage you to play around with segment comparisons and the wide array of advanced features.
If you see a large drop-off in add to cart or purchase, you may be wondering, “Where are they going – or what are they doing instead?”
Within the funnel exploration report, you can add a secondary dimension for next action of event name. Then, when you right-click on that step in your visualization, it will show the percent of events the user took when they dropped off.
5. How to Calculate Lifetime Value (LTV) Accurately in Shopify
Calculating the average lifetime value of your users makes it easy to set CPA goals and ROI goals per user.
For example, if the average customer of your Shopify store spends $1200 per year on their subscription and stays a customer for an average of three years, the total lifetime value is $3600.
You can reasonably spend $360-720 to acquire a new customer because their value pays off in the long run.
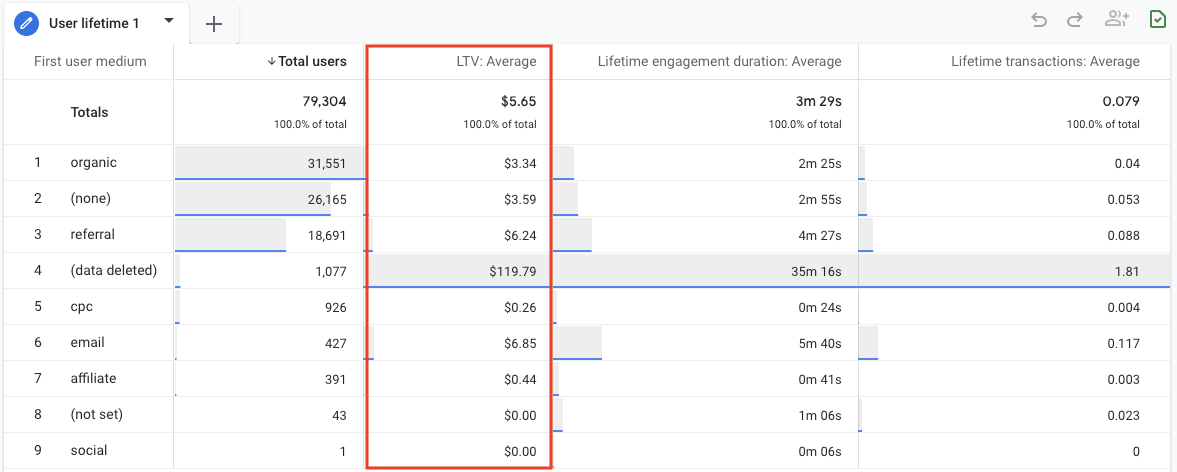
The Lifetime Value Report available in GA4 will help you determine which campaigns are performing within target CPA and ROI goals per user.
Lifetime Value Report in GA4, Step-by-Step
- Sign in to GA4 Account.
- Click Explore – far left menu.
- Click Template Gallery.
- Select the User lifetime template.
Defining Who Is Most Interested in Your Product
A custom user journey report will show you the users most interested in buying your product and how the marketing channels work together to usher users from that first touchpoint to the finish line.
This one simple report quickly visualizes which channels are driving top-of-funnel events and how those factor into lower-funnel activities.
Earlier this month, I had the opportunity to chat with Elevar founder, Brad Redding. Elevar is a tagging and tracking software that has helped hundreds of thousands of Shopify owners set up their GTM.
In doing so, they have collected insights on over $1 billion in revenue from their customers and Brad shared that, “Maybe 5% of all accounts we look at utilize this report and the setup is super simple.”
To create a custom user journey report we will be kicking it old school in Universal Analytics (GA standard.)
You will need to have created custom metrics in your GA property settings and to be sending those hits to GA using Google Tag Manager.
Custom User Journey Report in GA4, Step-by-Step
- Sign in to GA4 Account.
- Click Custom Reports.
- Click Create New Report.
- Title Report: “Custom User Journey Report”
- Add a Report Tab.
- Name: Report Tab.
- Type: Flat Table
- Dimensions: Source/Medium
- Metrics: Sessions, Custom Metrics, Transactions, Ecommerce CVR, Buy-to-detail rate.
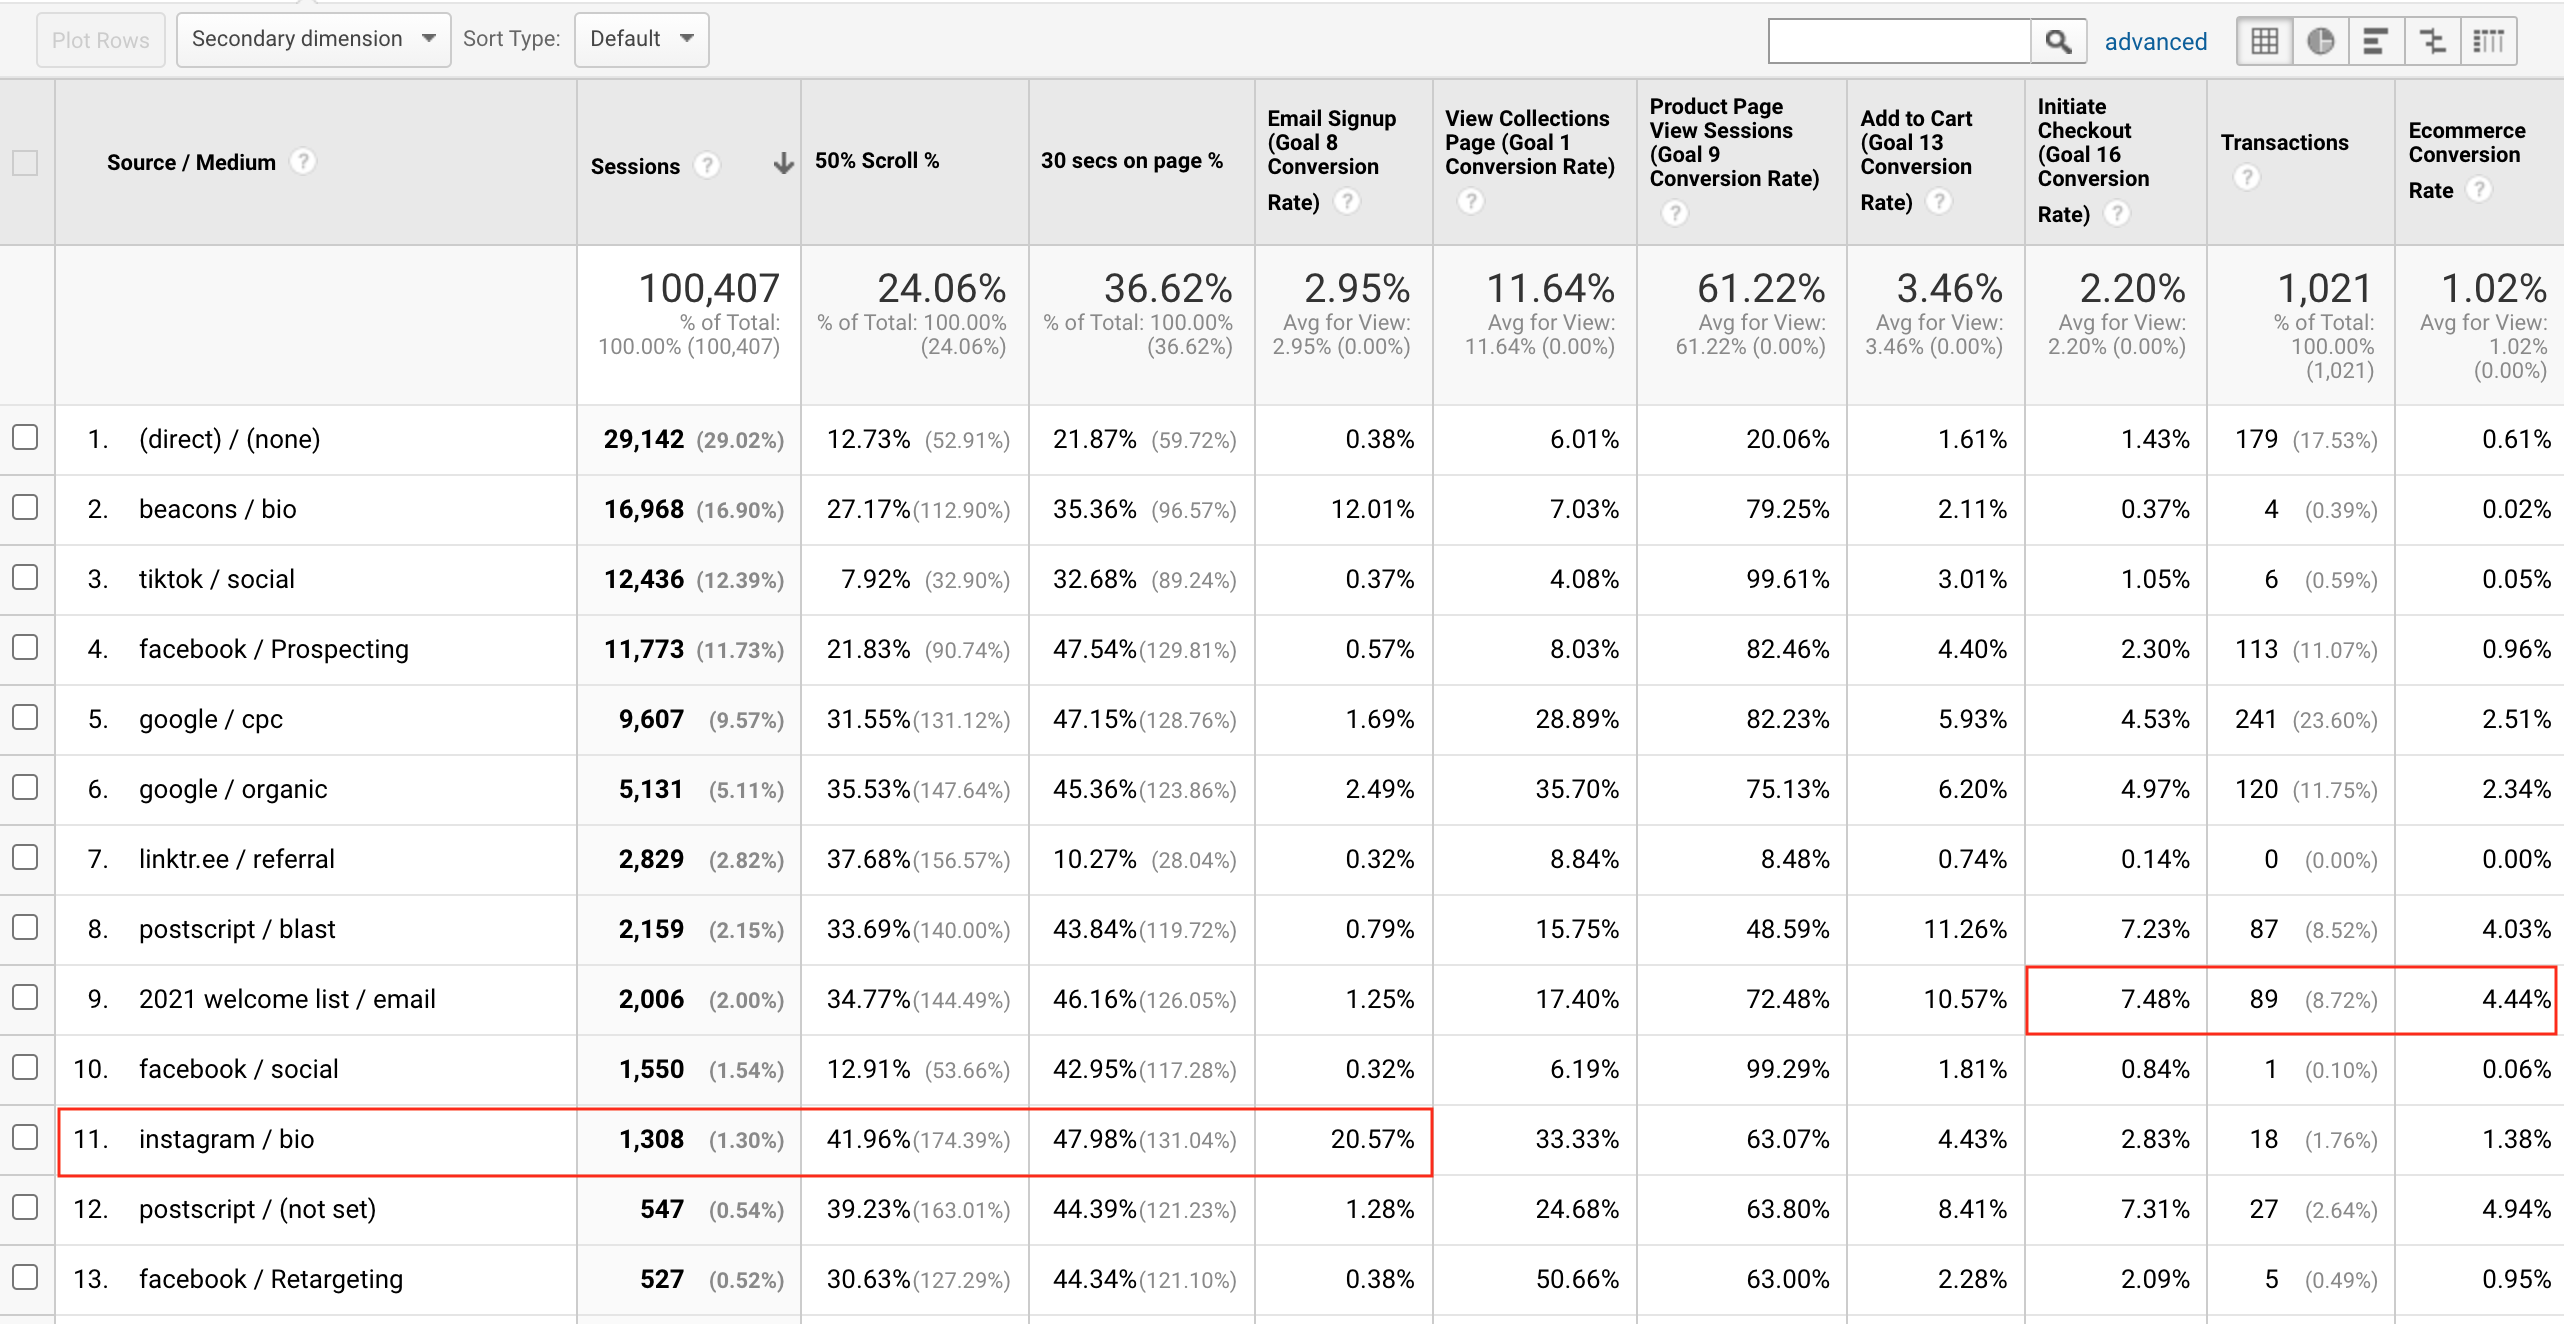
Brad shares the expert technique here is to:
“Look at percent-based metrics, not solely raw event values.”
This means to include the conversion rate of the custom metric, not the goal completion number.
You may learn, for example, that users from Instagram/bio referral have high email signups and that emails have a much higher % to initiate checkout.
Therefore, you may want to invest more resources into furthering developing your Instagram > email marketing funnel.
Final Thoughts
Your customers leave an abundance of information behind as they navigate your site. By harnessing their digital footprint, you can make strategic marketing decisions easily.
Using Google Analytics for Shopify may seem like a daunting task, but you don’t need an entire analytics team to do it.
Use the reports in this article for great insights into how buyers arrive on your site, why potential buyers are dropping off and how to create a customer journey that attracts your best customers.
More Resources:
- Shopify SEO – How to Optimize Your Shopify Site for Google
- 5 of the Best Ecommerce Tools Every Merchant Needs
- Ecommerce Marketing: The Definitive Guide
Image Credits
Featured image created by author
Image 7: Elevar
All screenshots taken by author, August 2021
