

Since the announcement of the Page Experience update and its full rollout last September 2021, many SEO professionals worldwide have turned their attention to improving Core Web Vitals for the websites they manage.
Making sure that you have a good user experience across all browsers and devices is important from a business standpoint.
However, as SEO experts, we need to understand not only how users experience our site, but how Google is measuring Core Web Vitals and whether there is a way to get access to this data, as well.
That way, we not only benefit our users but know how Google judges our websites – and our competitors’ – within this specific area. This ultimately enables us to prioritize fixes based on this information.
With that in mind, in this article we’re exploring:
- What data Google uses to measure Core Web Vitals.
- What sources are available to extract this data and their limitations.
- Which are the best sources for SEO purposes (from my point of view).
- How to access these data sources, with examples.
What Data Is Google Using To Measure Core Web Vitals?
Based on the information Google has provided, they are using the data collected in the Chrome User Experience Report to measure Core Web Vitals for Search.
They have announced this on multiple occasions, including John Mueller’s “Core Web Vitals & SEO” session at the Chrome Dev Summit in 2020 and most recently during the Web Vitals AMA session at Google I/O 2021.
-
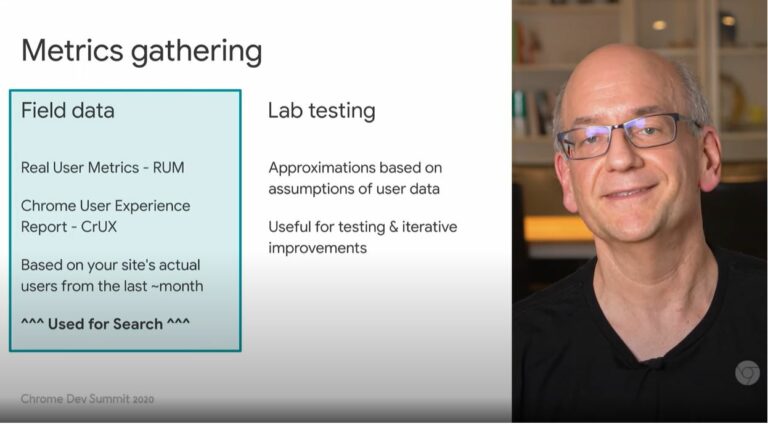 Core Web Vitals and SEO, Google Chrome Developers, December 2020
The Chrome User Experience Report, or CrUX for short, gathers loading performance information from URLs visited by real Chrome users that meet specific criteria.
To put this in context, when looking at Core Web Vitals measurement purely from Google’s point of view, they are looking at a segmented subset of your whole user base.
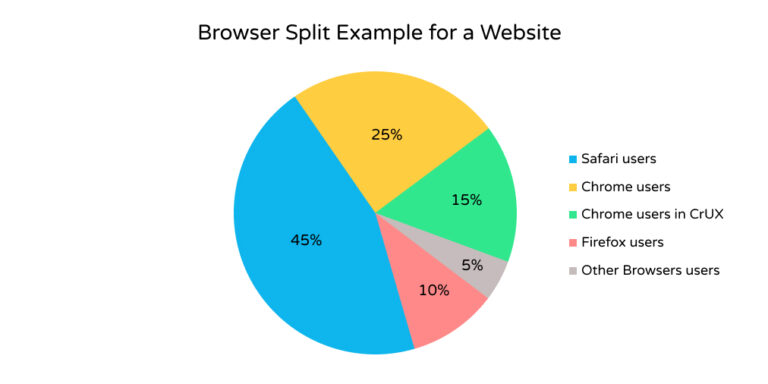 Image created by author, December 2021
Obviously, we can’t know what percentage of Chrome users are part of the CrUX report for any given website, as this is not disclosed by Google. Also, how big or small this subset is will depend entirely on your users.
In an ideal world, you should track Core Web Vitals on your site for all users with a third-party tool or using Google’s own web vitals library. However, the data in CrUX is the best information we have that it’s publicly available.
What Sources Are Available To Extract Core Web Vitals From The CrUX Database?
Knowing that Google is using CrUX data for Search, the next step is understanding how to get your hands on this data.
There are six ways of extracting Core Web Vitals from CrUX directly from Google:
- CrUX API.
- PageSpeed Insights API.
- CrUX Data Studio Dashboard.
- PageSpeed Insights Tool.
- CrUX BigQuery project.
- Google Search Console.
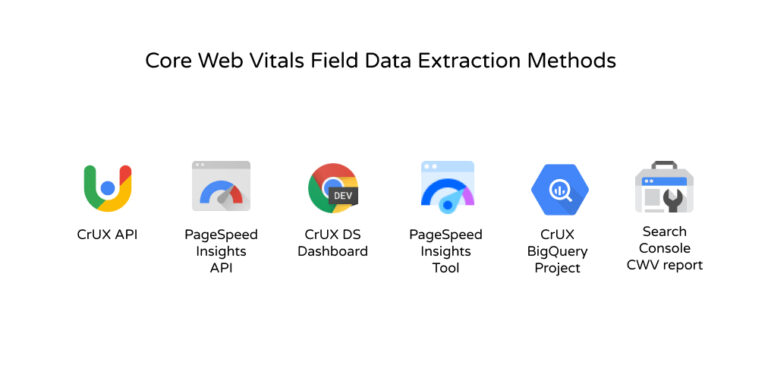 Image created by author, December 2021
Each of these sources has its benefits and drawbacks. I’ve created a small framework to classify which one is best for the type of analysis you would normally do for SEO.
The metrics included in this framework are:
- URL Extraction: Can we extract CWV data for a specific URL (if available)?
- Domain/Origin: Can we extract CWV data for a specific domain (if available)?
- Devices: Can we segment the data by Mobile, Desktop, or Tablet?
- Network Connection: Can we segment the data by the users’ network speed?
- Fresh data: Do we get the most recent available data (last 28-days from the day of extraction)?
- Historic data: Can we access data from previous months/years?
- Cost-free: Can we access the data without paying?
- Scalability: Can we extract this data easily for 1000s of URLs or domains?
- UI Access: Does this data source have an easy-to-use user interface?
Ranking Of The Best Sources To Extract CrUX Data For SEO
Although this list might be a bit biased because I like to use programmatic solutions for my day-to-day work, I have tried all these methods before.
Hence, all the information here is based on my experience working on solving and monitoring Core Web Vitals issues for real clients.
Here is the list of methods to extract Core Web Vitals from Google and how they compare against each other based on my comparison framework.
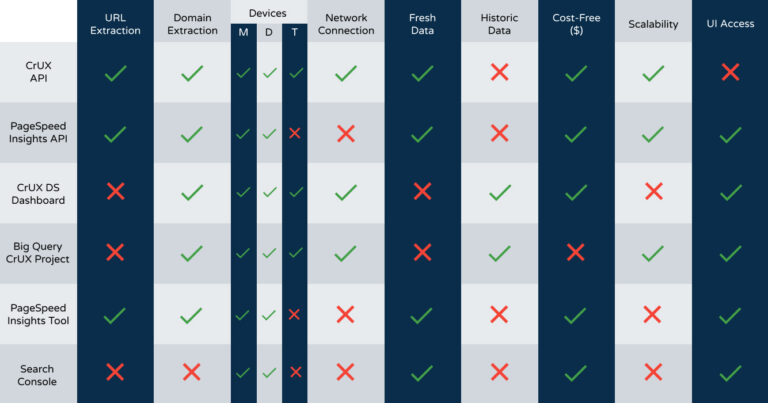 Image created by author, December 2021
1. The CrUX API
The CrUX API is, in my opinion, the easiest and most complete API to extract Core Web Vitals from CrUX overall.
It is fairly straightforward to use and it contains all the information you might need to understand, report and monitor CWV issues for your websites.
 Screenshot by author, December 2021
Pros
- Both URL and Origin-level data are accessible through the API when these are available.
- You can segment all three devices (Mobile, Desktop, and Tablet).
- Network connection information is available. You can extract data for 4G, 3G, 2G, slow-2G, and offline.
- You can extract the freshest available data which is the average aggregated data from the previous 28-days from the last complete day. This is (in theory) what Google Search uses to assess Core Web Vitals for a website.
- It is completely free to use and easily scalable. The only quota limit is on the number of queries per minute which is 150. Additionally, it has a really fast response time in comparison to other APIs like the PageSpeed Insights API.
Cons
- At the moment, there is no available access to historic data. Hence, you can only access the aggregation of the previous 28-days. However, this can be circumvented by storing the data daily for future access.
- There is no easily accessible user interface for the API for now.
How To Access CWV Data With The CrUX API
My weapon of choice when it comes to API extraction is JavaScript, specifically Node.js. Therefore, the examples I’ll show you will mostly be in JavaScript.
If you don’t know how to run it, this short post explains how to install Node.js on your laptop so you can try these examples in your own time.
// Create an index.js file, paste the code below & run `npm install axios` in your terminal

/* Modules */
const axios = require('axios');

/* Script Variables */
const apiKey = 'YOUR-API-KEY-HERE' // Get your key here https://developers.google.com/web/tools/chrome-user-experience-report/api/guides/getting-started#APIKey
const cruxEndpoint = `https://chromeuxreport.googleapis.com/v1/records:queryRecord?key=${apiKey}`;

// Custom function to call the CruX API
const getApiData = async (type, url) => {
  // Create request body
  const req = {}
  req[type] = url

  // Send API Request
  const { data } = await axios(cruxEndpoint, {
    method: 'POST',
    headers: {
      'Content-Type': `application/json`,
    },
    data: JSON.stringify(req)
  });
  return data
}

// Run script (IIFE) - Change 'type' & 'URL'
(async () => {
  const testOrigin = await getApiData('origin', 'https://builtvisible.com')
  const testURL = await getApiData('url', 'https://builtvisible.com')
  console.log(testOrigin, testURL);
})()
If you would like me to share a fully-fetched version that loops through all possible devices & connections for a list of URLs, let me know on Twitter.
2. The PageSpeed Insights API
The PageSpeed Insights API is a close second when it comes to extracting field data from CrUX.
It gives us very useful information but there are a few missing dimensions compared to the CrUX API that could be helpful when diagnosing CWV issues for your sites.
 Screenshot by author, December 2021
Pros
- Both URL and Origin-level data is accessible through the API when these are available.
- You can segment the data by Mobile & Desktop.
- Same as the CrUX API, you can extract the freshest available data which is the average aggregated data from the previous 28-days from the last complete day.
- It is completely free to use and easily scalable. There is a quota limit of 240 requests per minute and 25,000 per day.
- You can access this API through an easy-to-use user interface with the PageSpeed Insights Tool from Google (although it’s not that scalable).
Cons
- You can’t segment the data by Tablet users.
- No network connection information is available. Hence, all the different connections are aggregated when extracting CWV data.
- At the moment, there is no available access to historic data. Hence, you can only access the aggregation of the previous 28-days. This can be solved by storing the data daily for future access.
- This service runs Lighthouse in the background to get lab metrics in the same requests. Hence, the API response is a bit slower than the CrUX API.
How To Access CWV Data With The PageSpeed Insights API
Here is a small example of how you can extract CWV data from the PageSpeed Insights API. If you want a plug-and-play script to run you can download my repository from Github.
// Create an index.js file, paste the code below & run `npm install axios` in your terminal

/* Modules */
const axios = require('axios');

/* Script Variables */
const apiKey = 'YOUR-API-KEY-HERE' // Get your key here https://developers.google.com/speed/docs/insights/v5/get-started#APIKey

// Custom function to extract data from PageSpeed API
const getApiData = async (url) => {
  const endpoint = 'https://www.googleapis.com/pagespeedonline/v5/runPagespeed';
  const apiResponse = await axios(`${endpoint}?url=${url}&key=${apiKey}`); // Create HTTP call
  const urlCWV = apiResponse.data.loadingExperience; // Extract URL field
  const domainCWV = apiResponse.data.originLoadingExperience; // Extract domain field data

  console.log(urlCWV, domainCWV); // Log URL field data and Domain Field data if available
  return { urlCWV, domainCWV };
};

// Call your custom function
getApiData('https://www.searchenginejournal.com/category/seo/');
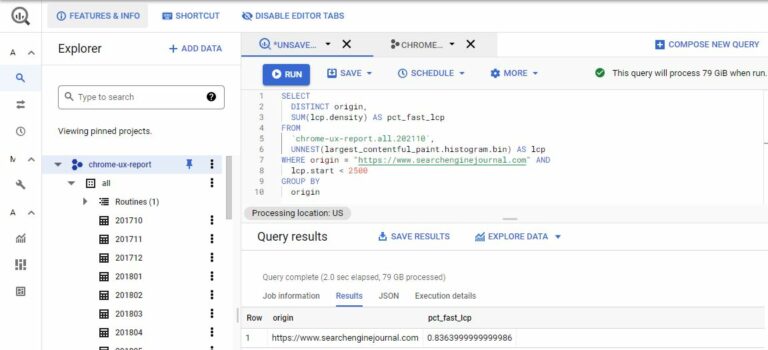
3. The CrUX BigQuery Project
The CrUX BigQuery project is a huge database of real user metrics records that dates back to October 2017. This huge project is full of great information. But like any other source, it has pros and cons.
Pros
- You can access origin-level data.
- You can segment all three devices (Mobile, Desktop, and Tablet).
- You can extract data for all types of network connections when available (4G, 3G, 2G, slow-2G and offline).
- You can extract historic data beyond the last available month up until October 2017.
- You can scale this for as many projects as you want and the data is very flexible with the potential to create your own custom tables if you wish.
- There are additional metrics and dimensions that could be useful for your analysis but are not available in the CrUX API or PageSpeed Insights APIs like “Time To First Byte” or country-level segmentation.
Cons
- You cannot access URL-level data.
- This dataset is updated every second Tuesday of the month for the previous month. Hence, if you want to monitor CWV more regularly this wouldn’t be the right source.
- You need a working understanding of SQL to dig into the data.
- It costs money to run. Although there is a free usage tier on BigQuery, you will need to add billing details within Google Cloud Platform in order to use it. Don’t get discouraged by this. For small to medium-scale reporting, you should be within the free tier.
How To Access CWV Data With The CrUX BigQuery Project
If you already have a Google Cloud Platform account, you can access the project using this link.
You’ll need to enable the BigQuery API. Once enabled you can access the data straight from your SQL editor.
-
 Screenshot by author, December 2021
You don’t have to be an expert on SQL but a bit of familiarity would take you a long way.
Here are two fantastic resources that will help you kick-start your journey when analyzing this data: Rick Viscomi’s CrUX Cookbook and Paul Calvano’s Biguery for CrUX tutorial.
Until now, I’ve only explained data sources that require a bit of programming knowledge. But you don’t need to know how to code in order to get your hands on Core Web Vitals data from the CrUX report.
The next three methods will allow you to access Core Web Vitals data from CrUX without programming knowledge.
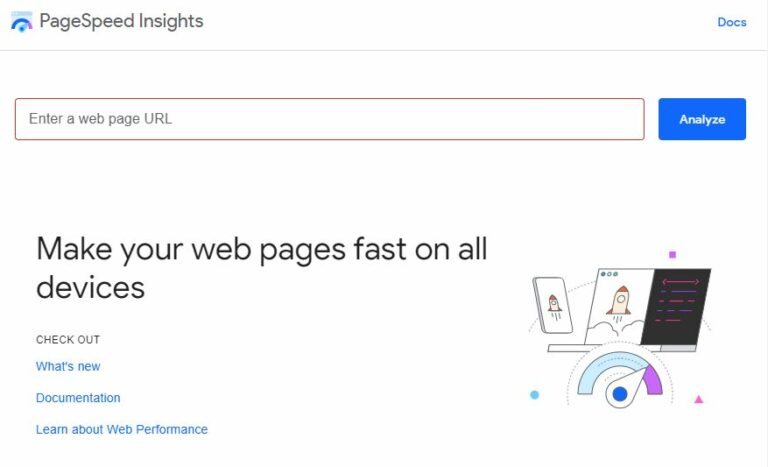
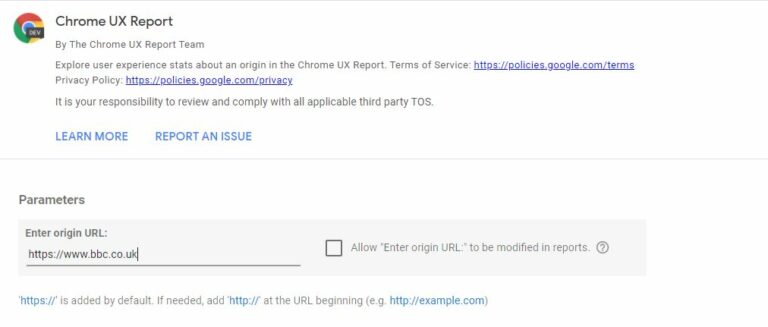
4. The PageSpeed Insights Tool
The PageSpeed Insights Tool from Google is a perfectly good “no-code” alternative to get access to CruX data.
 Screenshot by author, December 2021
The benefits are exactly the same as the ones for the PageSpeed Insight API but the only drawback is that this method is not very scalable.
In order to get data from multiple URLs, you will need to manually input each URL into the tool.
How To Access CWV Data With The PageSpeed Insights Tool
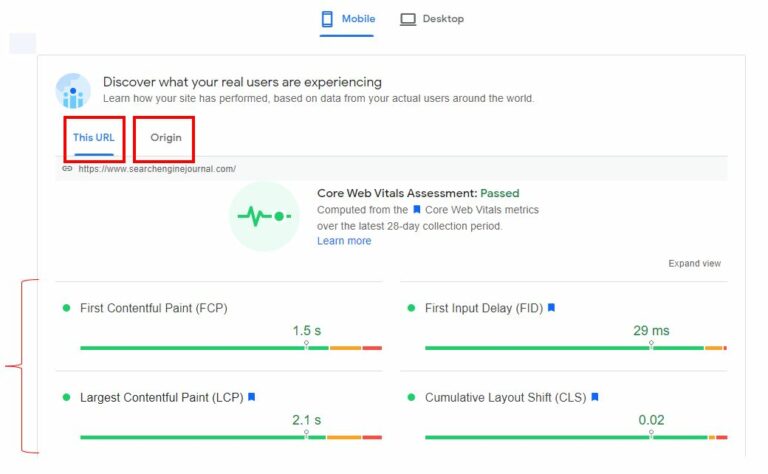
Input the URL/domain that you would like to get data from in the PageSpeed Insights Tool.
If there is available information for both the URL or the domain (origin), you will find it at the top of the results shown after the tool has finished running.
 Screenshot by author, December 2021
5. The CrUX Data Studio Dashboard
The CrUX Data Studio Dashboard is a fantastic tool built by Rick Viscomi to access the CrUX Big Query project very easily with a nice user interface.
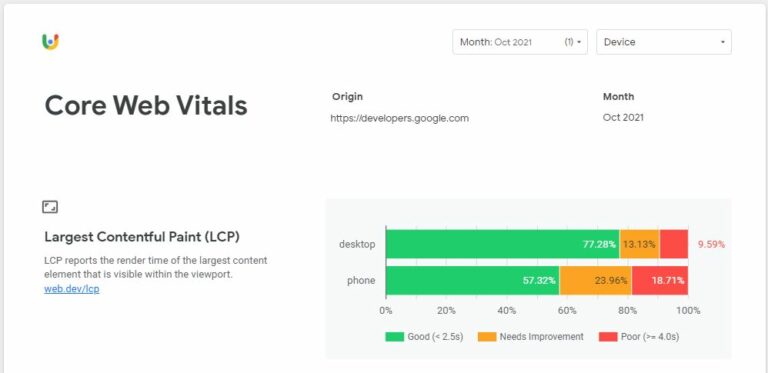 Screenshot by author, December 2021
Pros
- You can access Origin-level data.
- You can segment all three devices (Mobile, Desktop, and Tablet).
- You can extract data for all types of network connections when available (4G, 3G, 2G, slow-2G and offline).
- You can extract historic data beyond the last available month.
- It is completely free to build.
- It is very easy to set up and has a simple user interface.
- There are additional metrics that could be useful for your analysis but are not available in the other APIs like Time To First Byte.
Cons
- You cannot access URL-level data.
- This report is tied to the data available in the Big Query project which is updated every second Tuesday of the month for the previous month. Hence, if you want to monitor CWV data more regularly it’s not possible through this data source.
- This method is not really scalable if you are planning to monitor more than a few domains.
How To Access CWV Data With The CrUX Data Studio Dashboard
Create a copy of the template directly on Data Studio through g.co/chromeuxdash.
You can then add the domain you are interested in, hit “Create report” and you will get the report from the latest available month.
 Screenshot by author, December 2021
If you receive an error, make sure you have added the domain name correctly.
Alternatively, it might be that your domain isn’t included in the BigQuery dataset. You can find more information about how this report works in Rick Viscomi’s post on web.dev.
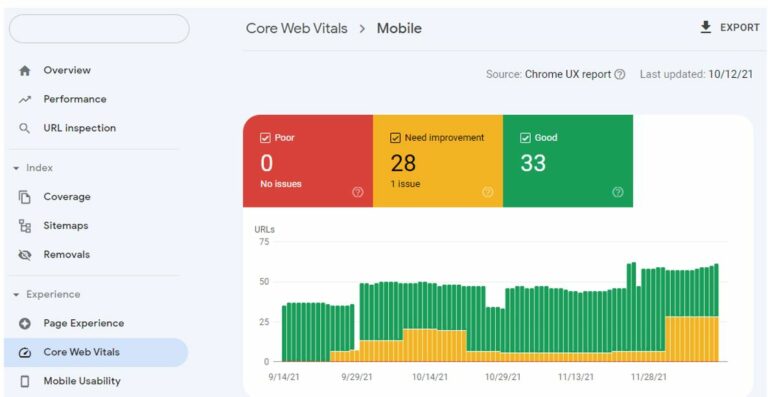
6. Search Console’s Core Web Vitals Report
Search Console’s Core Web Vitals Report is a relatively new addition to the GSC platform. It is useful but quite unique in terms of the metrics it displays per property.
 Screenshot by author, December 2021
Pros
- You can access data at template-level which is a unique approach to the rest of the methodologies. This is a really good idea and in many cases, the aggregation works as expected.
- You can segment the data by Mobile & Desktop.
- In principle, you can extract the freshest available data which is the average aggregated data from the previous 28-days from the last complete day.
- There is 90-days worth of data but only by the number of affected URLs per group (good metric, needs improvement metric, poor metric)
- The GSC user interface is very easy to use.
Cons
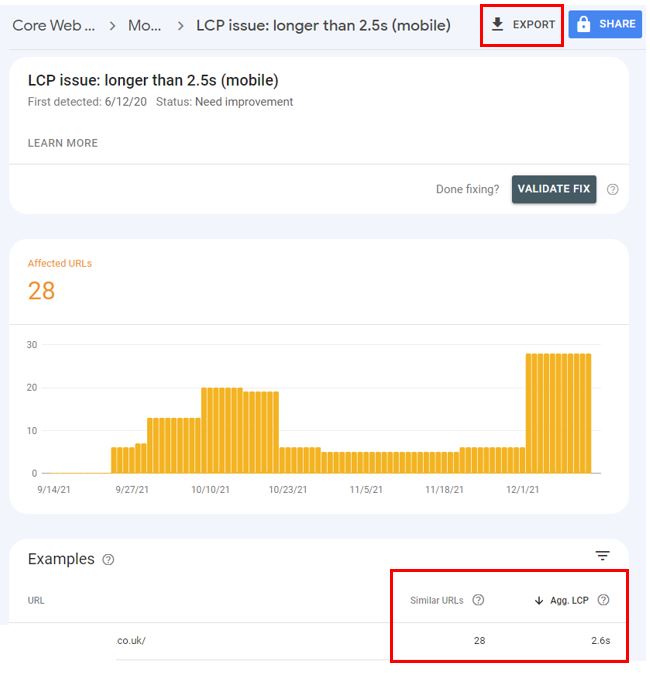
- You cannot access URL-level data or origin-level data. The data is aggregated by “similar URLs” and “Aggregated metric” value which is good but it’s harder to track individual URL progress.
- You cannot download the individual URLs matched as “similar”, only the total number.
- You can’t segment the data by Tablet users.
- No network connection information is available.
- At the moment, there is no available access to historic data beyond the previous 90 days.
How To Access CWV Data With Search Console
The only way to extract the data is through the user interface for now. The report is divided between “Mobile” and “Desktop”.
Each device cateogry contains individual “Poor”, “Needs Improvement” and “Good” reports for each of the Core Web Vital metrics (LCP, CLS, FID).
 Screenshot by author, December 2021
Each report has an export function (CSV, Excel, or Google Sheet) that will allow you to download a table with the “base URL,” the number of “Similar URLs” and the “aggregated metric” value per group.
It also allows the number of URLs affected within that subsection for the last 90 days.
Final Thoughts
Regardless of your coding skills, there are many ways to extract Core Web Vitals data from CrUX to monitor your websites and competitors.
If you are comfortable with a little bit of programming and looking to monitor Core Web Vitals on a regular basis at scale, the CrUX API will be your best solution.
Alternatively, if you are more focused on general domain trends and don’t need the data that often without needing to track lots of different domains, the CrUX Data Studio Dashboard would be the most comfortable solution.
Remember that measuring how our websites are performing against Google’s CWV benchmarks is the first step towards improving them. Because without a goal, you can’t score.
Keep in mind though, that as our Technical Director William Nye always tells us, “Strategy is important but execution is everything.”
More resources:
- Advanced Core Web Vitals: A Technical SEO Guide
- Google’s Page Experience Update & Core Web Vitals with Martin Splitt [Podcast]
- Advanced Technical SEO: A Complete Guide
Featured Image: FFFLOW/Shutterstock
