

Real humans want good web experiences. What does that look like in practice?
Well, one recent study cited by Google in a blog post about Core Web Vitals found that mobile web users only kept their attention on the screen for 4-8 seconds at a time.
Read that again.
You have less than 8 seconds to deliver interactive content and get a user to complete a task.
Enter Core Web Vitals (CWV). These three metrics are designed to measure site performance in human experience. The open-source Chromium project announced the metrics in early May 2020 and they were swiftly adopted across Google products.
How do we qualify performance in user-centric measurements?
- Is it loading?
- Can I interact?
- Is it visually stable?
Fundamentally, Core Web Vitals measure how long it takes to complete the script functions needed to paint the above-the-fold content. The arena for these Herculean tasks is a 360 x 640 viewport. It fits right in your pocket!
This war-drum for unaddressed tech debt is a blessing to a lot of product owners and tech SEO professionals who have been backlogged in favor of new features and shiny baubles.
Is the Page Experience update going to be Mobileggedon 4.0?
Probably not.
But when your page passes CWV assessments, users are 24% less likely to abandon page loads. These efforts benefit every source and medium, and most importantly – real humans.
The Page Experience Update
For all the buzz, CWV will be elements in a ranking signal. Expected to roll out gradually mid-June through August 2021, the Page Experience Ranking will be comprised of:
- Core Web Vitals.
- Mobile-Friendly.
- Safe Browsing.
- HTTPS.
- No Intrusive Interstitials.
Updated documentation clarifies that the rollout will be gradual and that “sites generally should not expect drastic changes.”
Important things to know about the update:
- Page Experience is evaluated per URL.
- Page experience is based on a mobile browser.
- AMP is no longer required for Top Stories carousels.
- Passing CWV is not a requirement to appear in Top Stories carousels.
A New Page Experience Report In Search Console
Search Console now includes a Page Experience report. The fresh resource includes backdated data for the last 90 days.
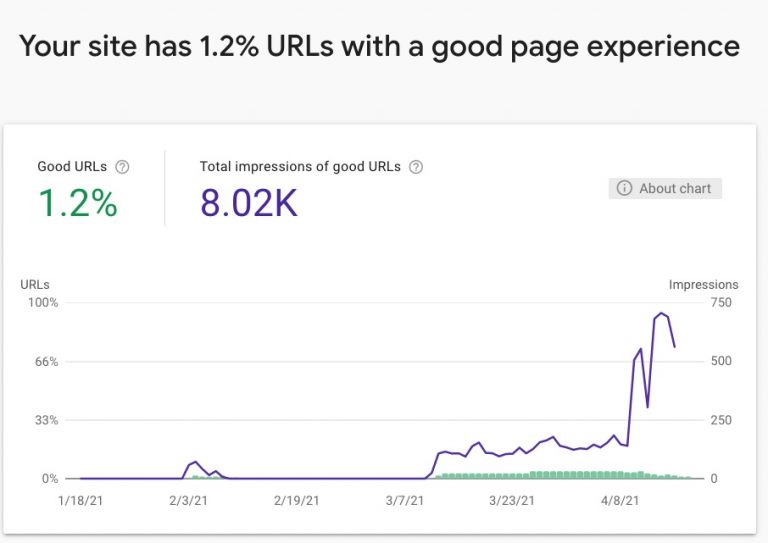
In order for a URL to be “Good,” it must meet the following criteria:
- The URL has Good status in the Core Web Vitals report.
- The URL has no mobile usability issues according to the Mobile Usability report.
- The site has no security issues.
- The URL is served over HTTPS.
- The site has no Ad Experience issues, or the site was not evaluated for Ad Experience.
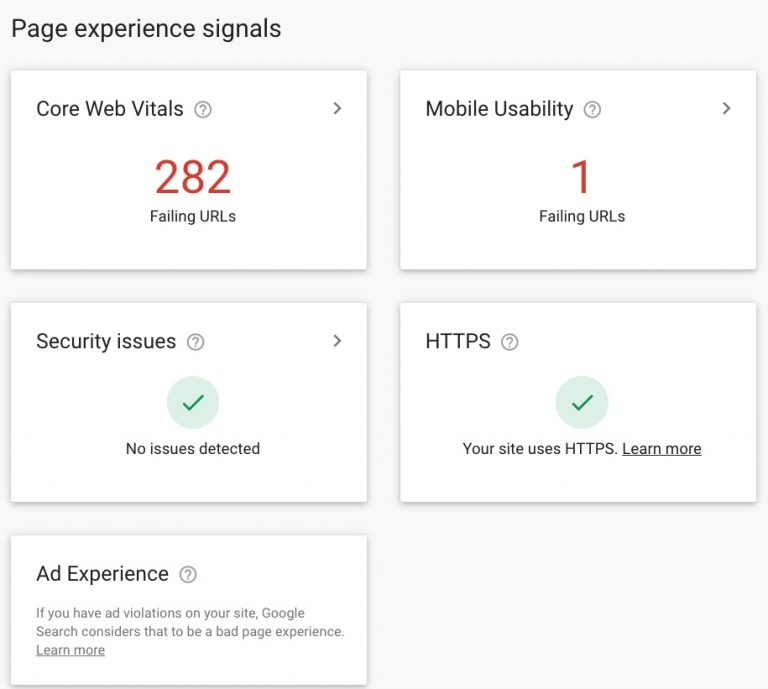
The new report offers high-level widgets linking to reports for each of the five “Good” criteria.
Workflow For Diagnosing & Actioning CWV Improvements
First, an important caveat regarding Field vs Lab data.
Field Data is performance data collected from real page loads your users are experiencing in the wild. You may also hear Field Data referred to as Real User Monitoring.
Core Web Vitals assessments and the Page Experience Ranking Signal will use Field Data gathered by the Chrome User Experience Report (Crux).
Which Users Are Part Of The Chrome User Experience Report?
Crux data is aggregated users who meet three criteria:
- The user opted-in to syncing their browsing history.
- The user has not set up a Sync passphrase.
- The user has usage statistic reporting enabled.
Crux is your source of truth for Core Web Vitals Assessment.
You can access Crux data using Google Search Console, PageSpeed Insights (page-level), Public Google BigQuery project, or as an origin-level dashboard in Google Data Studio.
Why would you use anything else? Well, CWV Field Data is a restricted set of metrics with limited debugging capabilities and requirements for data availability.
Why Doesn’t My Page Have Data Available From Crux?
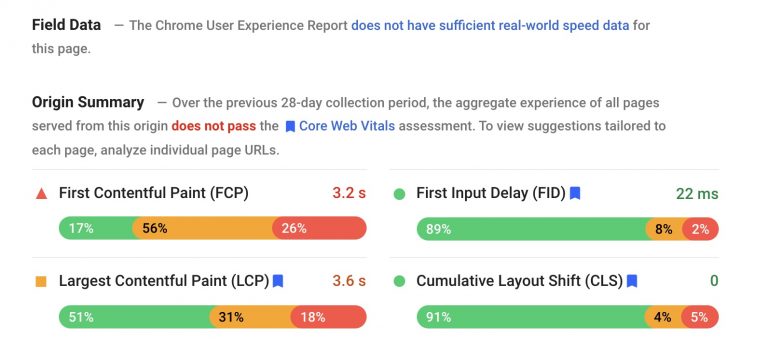
When testing your page, you may see “The Chrome User Experience Report does not have sufficient real-world speed data for this page.”
This is because Crux data is anonymized. There must be enough page loads to report without the reasonable possibility of the individual user being identified.
Web Core Vitals are best identified using field data and then diagnosed/QAed using lab data.
Lab Data allows you to debug performance with end-to-end and deep visibility into UX. It’s called “lab” as this emulated data is collected within a controlled environment with predefined device and network settings.
You can get lab data from PageSpeed Insights, web.dev/measure, Chrome DevTool’s Lighthouse panel, and Chromium-based crawlers like a local NodeJS Lighthouse or DeepCrawl.
Let’s dive into a workflow process.
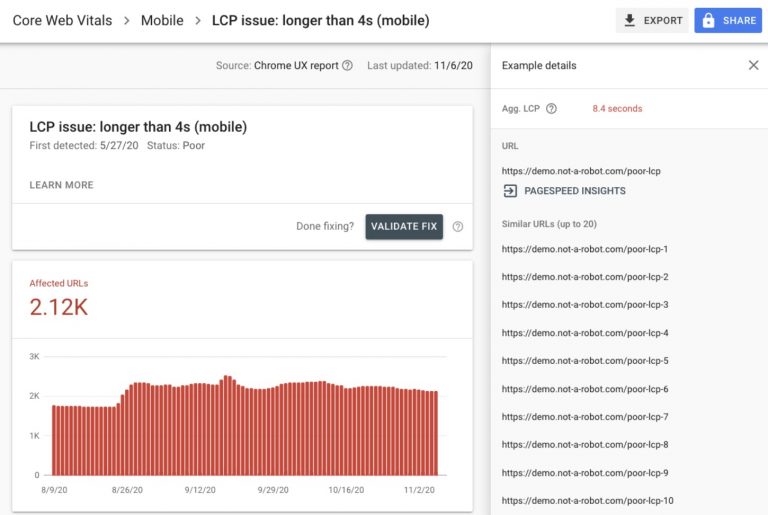
1. Identify Issues With Crux Data Grouped By Behavior Patterns In Search Console.
Start with Search Console’s Core Web Vitals report to identify groups of pages that require attention. This data set uses Crux data and does you the kindness of grouping together example URLs based on behavior patterns.
If you solve the root issue for one page, you’re likely to fix it for all pages sharing that CWV woe. Typically, these issues are shared by a template, CMS instance, or on-page element. GSC does the grouping for you.
Focus on Mobile data, as Google is moving to a Mobile-First Index and CWV is set to affect mobile SERPs. Prioritize your efforts based on the number of URLs impacted.
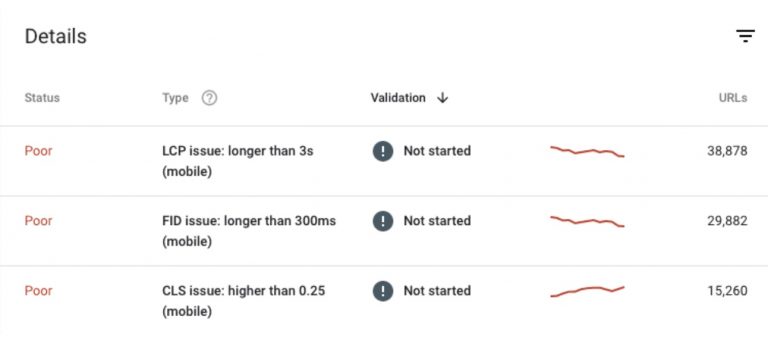
Click into an issue to see example URLs that exhibit the same behavior patterns.
Save these example URLs for testing throughout the improvement process.
2. Use PageSpeed Insights To Marry Field Data With Lab Diagnostics.
Once you’ve identified pages that need work, use PageSpeed Insights (powered by Lighthouse and Chrome UX Report) to diagnose lab and field issues on a page.
Remember that lab tests are one-off emulated tests. One test is not a source of truth or a definitive answer. Test multiple example URLs.
PageSpeed Insights can only be used to test publicly available and indexable URLs.
If you’re working on noindex or authenticated pages, Crux data is available via API or BigQuery. Lab tests should use Lighthouse.
3. Create A Ticket. Do The Development Work.
I encourage you as SEO professionals to be part of the ticket refinement and QA processes.
Development teams typically work in sprints. Each sprint includes set tickets. Having well-written tickets allows your development team to better size the effort and get the ticket into a sprint.
In your tickets, include:
User Story
Follow a simple format:
As a < type of user/site/etc >, I want < action > in order to < goal >.
Eg.: As a performant site, I want to include inline CSS for node X on page template Y in order to achieve the largest contentful paint for this page template in under 2.5 seconds.
Acceptance Criteria
Define when the goal has been achieved. What does “done” mean? Eg.:
- Inline any critical-path CSS used for above-the-fold content by including it directly in <head>.
- Critical CSS (read as: that related to node X) appears above JS and CSS resource links in the <head>.
Testing URLs/Strategy
Include the grouped example URLs you copied down from Search Console. Provide a set of steps for QA engineers to follow.
Think about which tool is used, what metric/marker to look for, and the behavior indicating a pass or fail.
Links To Developer Document
Use first-party documentation when available. Please no fluffy blogs. Please? Eg.:
4. QA Changes In Staging Environments Using Lighthouse.
Before code is pushed to production, it’s often put in a staging environment for testing. Use Lighthouse (via Chrome DevTools or local node instance) to measure Core Web Vitals.
If you’re new to testing with Lighthouse, you can learn about ways to test and testing methodology in A Technical SEO Guide to Lighthouse Performance Metrics.
Keep in mind that lower environments typically have fewer resources and will be less performant than production.
Rely on the acceptance criteria to home in on whether the development work completed met the task given.
Largest Contentful Paint
Represents: Perceived loading experience.
Measurement: The point in the page load timeline when the page’s largest image or text block is visible within the viewport.
Key Behaviors: Pages using the same page templates typically share the same LCP node.
Goal: 75% of page loads achieve LCP in < 2.5 seconds.
Available as: Lab and Field Data.
What Can Be LCP?
The LCP metric measures when the largest text or image element in the viewport is visible.
Possible elements that can be a page’s LCP node include:
<img>elements.<image>elements inside an<svg>tag.- poster images of
<video>elements. - background images loaded via
url()CSS function. - Text nodes inside block-level elements.
Expect to see additional elements like <svg> and <video> added in future iterations.
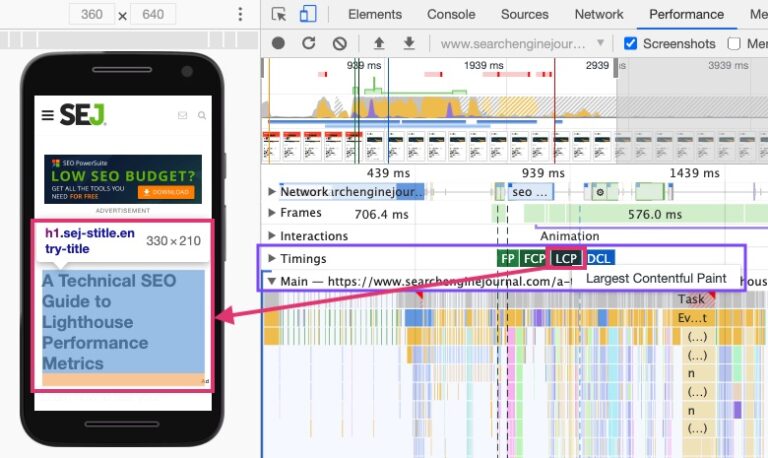
How To identify LCP Using Chrome DevTools
- Open the page in Chrome emulating a Moto 4G.
- Navigate to the Performance panel of Dev Tools (
Command + Option + Ion Mac orControl + Shift + Ion Windows and Linux). - Hover over the
LCPmarker in the Timings section. - The element(s) that correspond to LCP is detailed in the Related Node field.
What Causes Poor LCP?
There are four common issues causing poor LCP:
- Slow server response times.
- Render-blocking JavaScript and CSS.
- Slow resource load times.
- Client-side rendering.
Source issues for LCP are painted in broad strokes at best. Unfortunately, none of the single phrases above will likely be enough to pass along to your dev team with meaningful results.
However, you can give the issue momentum by homing in on which of the four origins is in play.
Improving LCP is going to be collaborative. Getting it fixed means sitting in on dev updates and following up as a stakeholder.
Diagnosing Poor LCP Because Of Slow Server Response Time
Where to look: Crux Dashboard v2 – Time to First Byte (TTFB) (page 6)
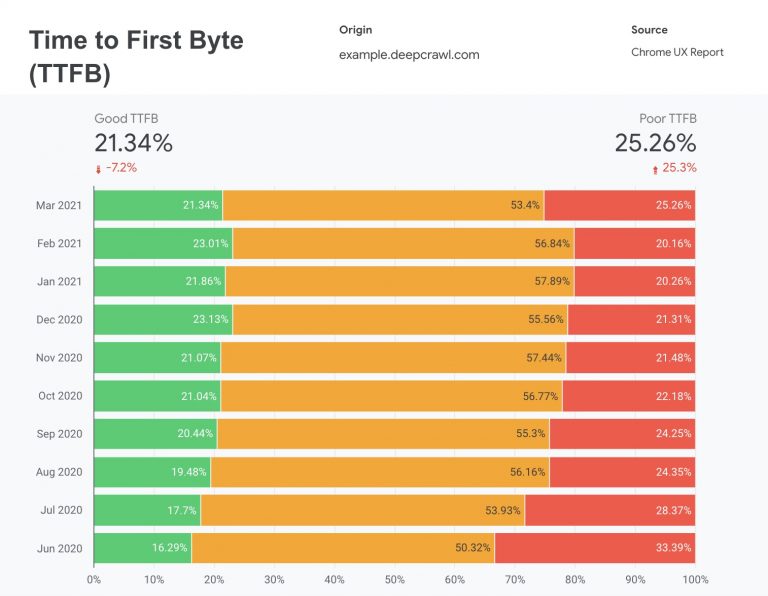
IF you see consistently poor TTFB in your field data, then it’s slow server response time dragging LCP.
How To Fix Slow Server Response Time
Server response time is made of numerous factors bespoke to the site’s technology stack. There are no silver bullets here. Your best course of action is to open a ticket with your development team.
Some possible ways to improve TTFB are:
- Optimize the server.
- Route users to a nearby CDN.
- Cache assets.
- Serve HTML pages cache-first.
- Establish third-party connections early.
Diagnosing Poor LCP Because Of Render-Blocking JavaScript And CSS
Where to look: Lighthouse (via web.dev/measure, Chrome DevTools, Pagespeed Insights, or nodeJS instance). Each of the solutions below include a relevant audit flag.
How To Fix Render-blocking CSS
CSS is inherently render-blocking and impact critical rendering path performance. By default, CSS is treated as a render-blocking resource.
The browser downloads all CSS resources, regardless of blocking or non-blocking behavior.
Minify CSS.
If your site uses a module bundler or build tool, find the plugin that will systematically minimize the scripts.
Defer non-critical CSS.
The Code Coverage report in DevTools will help you identify which styles are used on the page. If it’s not used on any pages, then remove it entirely. (No judgement, CSS files can quickly bloat into the proverbial junk drawer.)
If the styles are used on another page, make a separate style sheet for those pages which use it to call.
Inline critical CSS.
Include the critical-path CSS used for above-the-fold content (as identified by the Code Coverage report) directly in <head>.
Use Dynamic Media Queries.
Media queries are simple filters that when applied to CSS styles break out the styles based on the types of device rendering the content.
Using dynamic media queries means instead of calculating styles for all viewports, you’re calling and calculating those values to the requesting viewport.
How To Fix Render-Blocking JavaScript
Minify and compress JavaScript files.
You’ll need to work with developers to minify and compress network payloads.
Minification involves removing unneeded whitespace and code. It’s best done systematically with a JavaScript compression tool.
Compression involves algorithmically modifying the data format for performant server and client interactions.
Defer unused JavaScript.
Code splitting chops up large chunks of JS to deliver smaller packages. You can then load those that matter to above-the-fold content first.
Minimize unused polyfills.
Remember how Googlebot was stuck in Chrome 44 for what felt like centuries? A polyfills is a piece of code used to provide modern functionality on older browsers that do not natively support it.
Now that Googlebot is evergreen, it also goes by the name tech debt.
Some compilers have built-in functionalities to remove legacy polyfills.
How To Fix Render-Blocking Third-Party Scripts
Delay it.
If the script does not contribute to above the fold content, use async or defer attributes.
Remove it.
If the script uses an <iframe> in the head, remove it. Contact the vendor for an updated implementation method.
Consolidate it.
Audit third-party script use. Who is in charge of the tool? A third-party tool without someone managing it is also known as a liability.
What value does it provide? Is that value greater than the impact on performance? Can the result be achieved by consolidating tools?
Update it.
Another option may be to reach out to the provider to see if they have an updated lean or asynchronous version. Sometimes they do and don’t tell folks that have their old implementation.
Diagnosing Poor LCP Because Of Slow Resource Load Times
Where to look: Lighthouse (via web.dev/measure, Chrome DevTools, Pagespeed Insights, or nodeJS instance). Each of the solutions below includes a relevant audit flag.
Browsers fetch and execute resources as they discover them. Sometimes our paths to discovery are less than ideal. Other times the resources aren’t optimized for their on-page experiences.
Here are ways you can combat the most common causes of slow resource load times:
- Optimize and compress images.
No one needs a 10MB png file. There’s rarely a use case for shipping a large image file. Or a png. - Preload important resources.
If a resource is part of the critical path, a simplerel="preload"attribute tells the browser to fetch it as soon as possible. - Compress text files.
Encode, compress, repeat. - Deliver different assets based on network connection (adaptive serving).
A mobile device on a 4G network isn’t likely to need/want/tolerate the loading time of assets ready for an ultra 4K monitor. Use the Network Information API which enables web applications to access information about the user’s network. - Cache assets using a service worker.
While Googlebot doesn’t execute service workers, a user’s device on a thimble’s worth of network connection certainly will. Work with your development team to leverage the Cache Storage API.
Diagnosing Poor LCP Because Of Client-Side Rendering
Where to look: For one-off glances, view the page source. If it’s a couple of lines of gibberish, the page is client-side rendered.
Elements within a page can be client-side rendered. To spot which elements, compare the initial page source with the rendered HTML. If you’re using a crawler, compare the rendered word count difference.
Core Web Vitals are a way of measuring how effective our rendering strategies are.
All rendering options have the same output (they all build web pages), but CWV metrics measure how quickly we deliver what matters when it matters.
Client-side rendering is rarely the answer unless the question is, “What changes went into production at the same time that organic traffic began to tumble?”
How To Fix Client-Side Rendering
“Stop” really isn’t a useful answer. Accurate, but not useful. So instead:
- Minimize critical JavaScript.
Use code splitting, tree shaking, and inline functions in the head for above-the-fold functionalities. Keep those inline scripts <1kb. - Use server-side rendering.
By having your servers execute JS elements, you can return fully rendered HTML. Note that this will increase your TTFB as the scripts are executed before your server responds. - Use pre-rendering.
At build time, execute your scripts and have rendered HTML ready for incoming requests. This option has a better server response time but won’t work for sites with frequently changing inventory or prices.
To be clear: Dynamic rendering is not a solution to client-side rendering. It’s giving the troubles of client-side rendering a friend.
First Input Delay (FID)
Represents: Responsiveness to user input.
Measurement: The time from when a user first interacts with a page to the time when the browser is actually able to begin processing event handlers in response to that interaction.
Key behaviors: FID is only available as field data.
Goal: 75% of page loads achieve FID in <= 100 milliseconds.
Available as: Field Data.
Use Total Blocking Time (TBT) For Lab Tests
Since FID is only available as lab data, you’ll need to use Total Blocking Time for lab tests. The two achieve the same end result with different thresholds.
TBT represents: Responsiveness to user input.
TBT measurement: Total time in which the main thread is occupied by tasks taking more than 50ms to complete.
Goal: <= 300 milliseconds.
Available as: Lab Data.
What Causes Poor FID?
const jsHeavy = true;
    While (jsHeavy) {
        console.log("FID fail")
    }
Heavy JavaScript. That’s it.
Poor FID comes from JS occupying the main thread which means your user’s interactions are forced to wait.
What On-Page Elements Are Impacted By FID?
FID is a way of measuring main thread activity. Before on-page elements can respond to user interaction, in-progress tasks on the main thread have to complete.
Here are some of the most prevalent elements that your user is tapping in frustration:
- Text fields.
- Checkboxes.
- Radio buttons (
<input>and<textarea>). - Select dropdowns (
<select>). - Links (
<a>).
Where to look: To confirm it’s an issue for users look at Crux Dashboard v2 – First Input Delay (FID) (page 3). Use Chrome DevTools to identify the exact tasks.
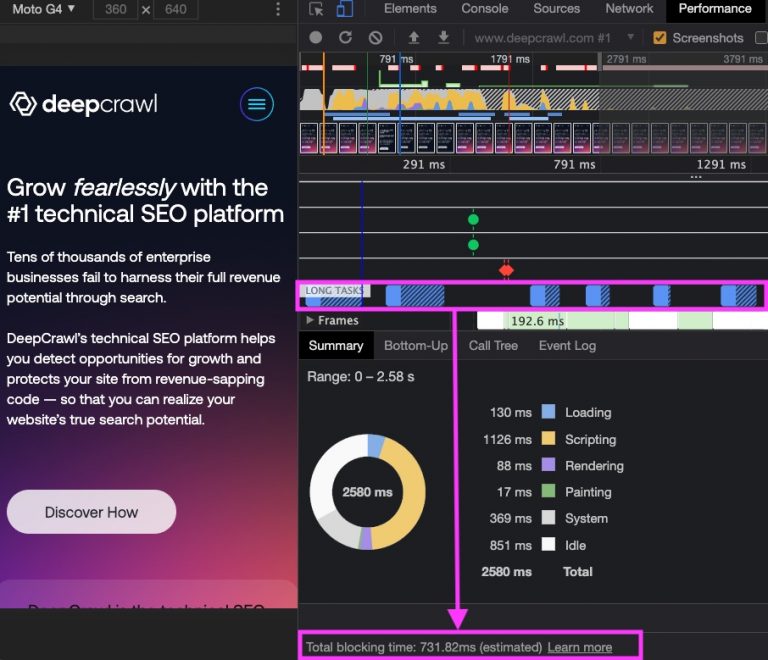
How To See TBT Using Chrome DevTools
- Open the page in Chrome.
- Navigate to the Network panel of Dev Tools (
Command + Option + Ion Mac orControl + Shift + Ion Windows and Linux). - Tick the box to disable cache.
- Navigate to the Performance Panel and check the box for Web Vitals.
- Click the reload button to start a performance trace.
- Look for the blue blocks labeled Long Tasks or the red right corner markers in the right-hand corner of tasks. These indicate long tasks that took more than 50ms.
- Find the TBT for the page at the bottom of the summary.
How To Fix Poor FID
Stop loading so many third-party scripts.
Third-party code puts your performance behind another team’s stack.
You’re dependent on their scripts executing in a succinct, performant manner in order for your side to be considered performant.
Free up the main thread by breaking up Long Tasks.
If you’re shipping one massive JS bundle for every page, there’s a lot of functionalities in that bundle that don’t contribute to the page.
Even though they’re not contributing, each JS function has to be downloaded, parsed, compiled, and executed.
By breaking out that big bundle into smaller chunks and only shipping those that contribute, you’ll free up the main thread.
Check your tag manager.
Out-of-the-box tag deployment of tags fire event listeners that will tie up your main thread.
Tag managers can be long-running input handlers that block scrolling. Work with developers to debounce your input handlers.
Optimize your page for interaction readiness.
Ship and execute those JS bundles in an order that matters.
Is it above the fold? It gets prioritized. Use rel=preload.
Pretty important but not enough to block rendering? Add the async attribute.
Below the fold? Delay it with the defer attribute.
Use a web worker.
Web workers allow JavaScript to run on a background thread rather than the main thread your FID is scored on.
Reduce JavaScript execution time.
If you’re shipping one massive JS bundle for every page, there’s a lot of functionalities in that bundle that don’t contribute to the page.
Even though they’re not contributing, each JS function has to be downloaded, parsed, compiled, and executed.
By breaking out that big bundle into smaller chunks (code splitting) and only shipping those that contribute (tree shaking), you’ll free up the main thread.
Cumulative Layout Shift
Represents: Visual stability.
Measurement: A calculation based on the number of frames in which element(s) visually moves and the total distance in pixels the element(s) moved.
layout shift score = impact fraction * distance fraction
Key behaviors: CLS is the only Core Web Vital not measured in time. Instead, CLS is a calculated metric. The exact calculations are actively being iterated on.
Goal: 75% of page loads have a CLS calculated metric of >0.10.
Available as: Lab and Field Data.
Diagnosing Poor CLS
Where to look: To confirm it’s an issue for users look at Crux Dashboard v2 – Cumulative Layout Shift (CLS) (page 4). Use any tool with Lighthouse to identify the bouncing element(s).
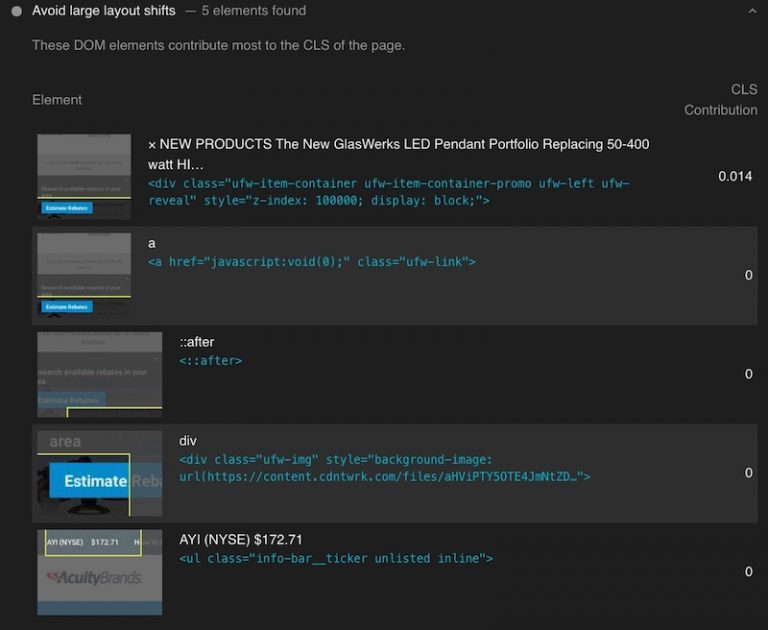
Chrome DevTools will provide greater insights into the coordinates of the excitable element and how many times it moves.
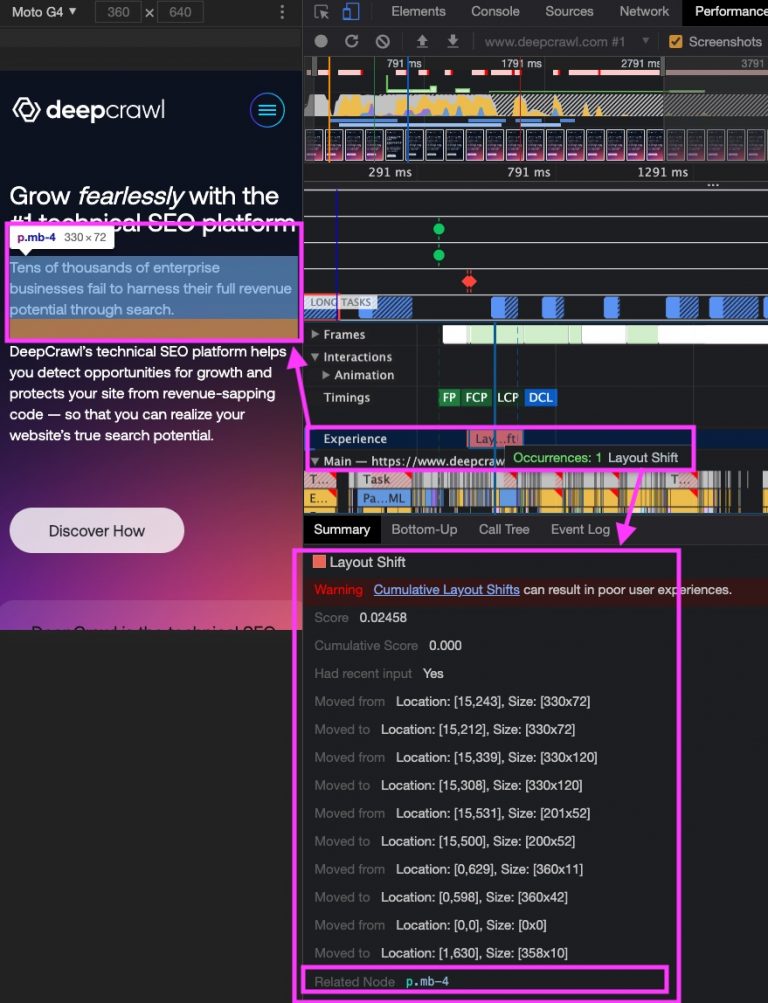
How To See CLS Using Chrome DevTools
- Open the page in Chrome.
- Navigate to the Network panel of Dev Tools (
Command + Option + I onMac orControl + Shift + Ion Windows and Linux). - Tick the box to disable cache.
- Navigate to the Performance Panel and check the box for Web Vitals.
- Click the reload button to start a performance trace.
- Click on the red marker(s) in the Experience section.
- Look for the name of the node, highlighting of the node on page, and the coordinates for each time the element moved.
What Can Be Counted In CLS?
If an element appears in the initial viewport, it becomes part of the metric’s calculation.
If you load your footer before your primary content and it appears in the viewport, then the footer is part of your (likely atrocious) CLS score.
What Causes Poor CLS?
Is it your cookie notice? It’s probably your cookie notice.
Alternatively, look for:
- Images without dimensions.
- Ads, embeds, and iframes without dimensions.
- Dynamically injected content.
- Web Fonts causing FOIT/FOUT.
- Chains for critical resources.
- Actions waiting for a network response before updating DOM.
How To Fix Poor CLS
Always include width and height size attributes on images and video elements.
It’s as simple as <img src="stable-layout.jpg" width="640" height="360" /> but also not. Responsive web design saw the decline of height and width declarations. The negative impact of this is pages reflowing once the image appeared on screen.
Best practice is to leverage user-agent stylesheets for systematically declared dimensions based on the image’s aspect ratio.
Reserve space for ad slots (and don’t collapse it).
If you’re a publishing site, you’re never going to win an argument over the negative performance impact of third-party ads.
Instead, identify the largest size ad that could be used in a slot and reserve space. If the ad doesn’t populate, keep the placeholder. The gap is better than a layout shift.
Avoid inserting new content above existing content.
An element shouldn’t enter the fighting arena unless it’s ready to be counted.
Take care when placing non-sticky ads near the top of the viewport.
As a general rule, avoid ads near the top of the page. You’ll likely see those flagged in the new GSC Page experience report.
Preload fonts and critical resources.
A font loading late causes a full flash and re-write.
Preload tells the browser that you would like to fetch it sooner than the browser would otherwise discover it because you are certain that it is important for the current page.
<link rel="preload" href="/assets/Pacifico-Bold.woff2" as="font" type="font/woff2" crossorigin>
Avoid chains for resources needed to create above-the-fold content.
Chains happen when you call a resource that calls a resource. If a critical asset is called by a script, then it can’t be called until that script is executed.
Avoid document.write()
Modern Browsers support speculative parsing off of the main thread.
Read as: They work ahead while scripts are being downloaded and executed – like reading ahead of assignments in a class. document.write() comes in and changes the textbook. Now that work reading ahead was useless.
Chances are this isn’t the work of your devs. Talk to your point of contact for that “magic” third-party tool.
The Future Of CWV Metrics
Google intends to update the Page Experience components on an annual basis. Future CWV metrics will be documented similarly to the initial signal rollout.
Imagine a world where SEO professionals got notice a year in advance that Panda was coming!
Core Web Vitals are already 55% of your Lighthouse v7 score.
Currently, Largest Contentful Paint (LCP) and First Input Delay (FID) are each weighted at 25%. Cumulative Layout Shift is a meager 5% but we can expect to see these equalize.
Smart money is on Q4 2021 once the Chromium team hones in the metric’s calculation.
As technical SEO pros, we’re able to diagnose and provide solutions for a better user-centric experience. Here the thing – those investments and improvements impact all users.
The ROI can be found in every medium. Every channel.
Organic performance is an overall reflection of site health. Leverage that position as you continue to advocate and iterate. Share what you learn.
Most importantly:
| ̄ ̄ ̄ ̄ ̄ ̄ ̄ ̄ ̄ ̄ ̄|
Don’t be afraid to
learn in public
|___________|
(__/) ||
(•ㅅ•) ||
/ づ
2021 SEJ Christmas Countdown:
- #12 – The New Google Business Profile: A Complete Guide For Local SEO
- #11 – How To Automate SEO Keyword Clustering By Search Intent With Python
- #10 – Get to Know Google Analytics 4: A Complete Guide
- #9 – 7 Things I Wish I’d Known Earlier In My SEO Career
- #8 – A Guide to Optimizing for Google News, Top Stories, And Discover
- #7 – Keyword Clusters: How to Level up Your SEO Content Strategy
- #6 – Advanced Core Web Vitals: A Technical SEO Guide
Image Credits
Featured image: Piscine26/Shutterstock
All screenshots taken by author
