

To promote or not to promote?
That shouldn’t be a question for you.
Of course, the answer is yes.
But then another question arises: how can you tell if your efforts are paying off?
There is a way, but it involves a thorough analysis, both of your past content promotion efficiency and your current efforts.
Content promotion can’t be done overnight. It requires a lot of time.
Monitoring this activity is the key to your success.
I believe that the main goal of content promotion is to attract and convert relevant audiences.
Read on and you’ll discover how you can evaluate the effectiveness of your content promotion on social media channels, make sure you’re not wasting your time, and whether you’re getting new users.
No matter if your marketing campaigns are big or small, this simple strategy will help you.
Here’s how to properly evaluate the results of your content promotion on social media, and what kind of promotional strategies (approaches) you need to adopt or change.
Prepare a List of Content Pages You Want to Analyze
If you don’t know how to convene all content pages in one place at once, you’re looking at several hours spent on doing just that.
Here are some of the painless ways to put together a list of pages in just a few clicks (and I’m not talking about copying and pasting links until your vision blurs).
To put this data together you can:
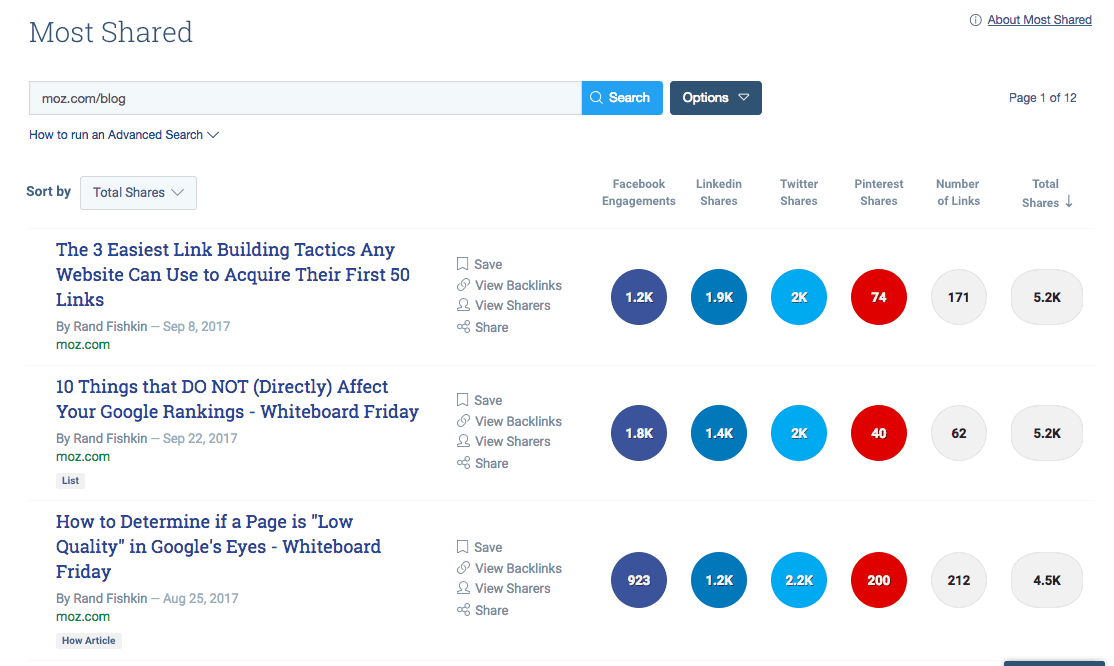
Use BuzzSumo to export a list of your website’s content pages that have ever been shared on SMM channels.
Look for your most important content pages. Also, narrow down your search to a specific subdirectory and not your entire website. For instance, the majority of articles on blogs have a word “blog” in their URLs.
In the screenshot below you can see the type of content that is present on Moz blog only:
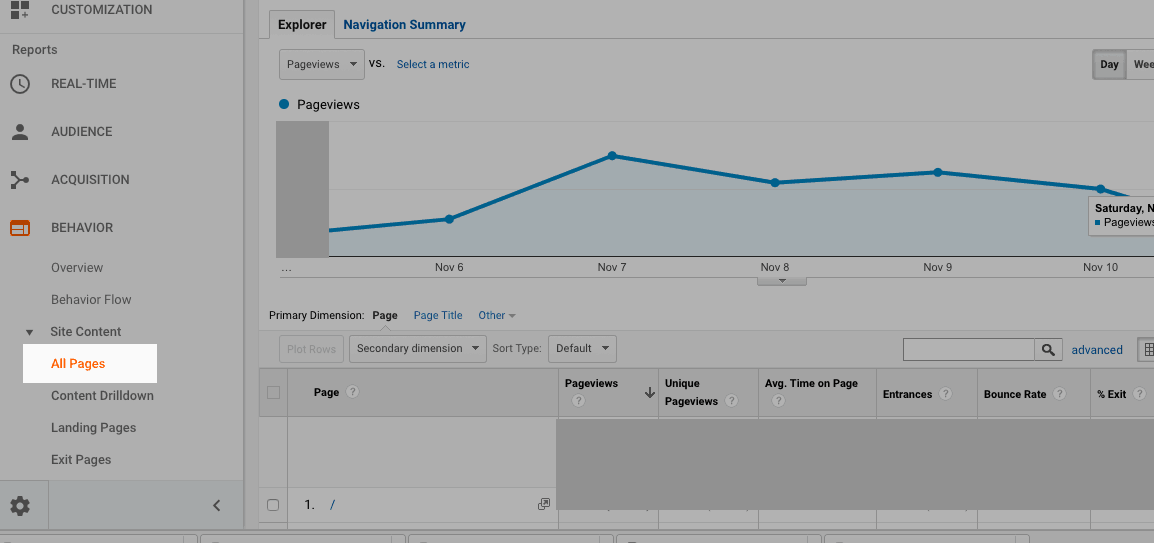
Use Google Analytics to export all your content pages that have ever attracted traffic.
Find a report called “All Pages”. It is located under the Site Content section.
Once you get there, select the desired timeframe and export all your content pages in one click.
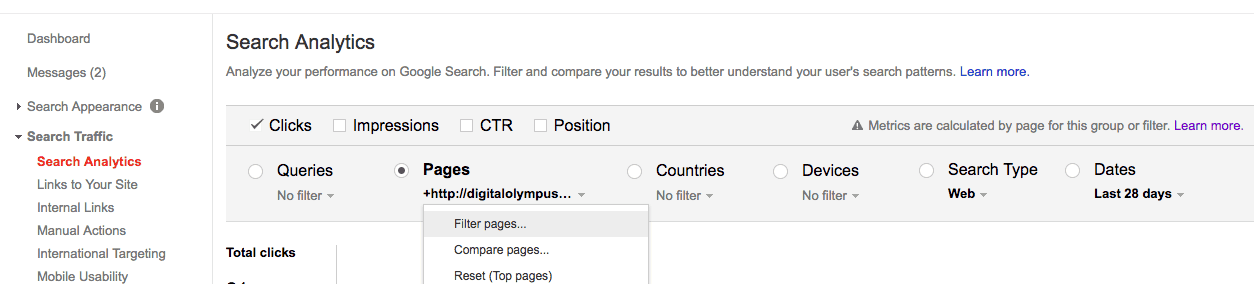
Use Search Console to export pages that earned impressions in Google over a certain period of time.
Frankly, that’s what I like to do the most if I have access to Google Search Console data. It allows me to get all URLs at once and be sure that I haven’t missed anything.
The reason why the result is so precise is because once you shared those URLs on social media channels, 99.9 percent of these pages will be indexed (gained impressions) by Google. Also, you can filter pages by clicking on the ‘Pages’ section and selecting ‘Filter pages’ option. This way, you will be analyzing relevant pages only.
Analyzing the Number of Social Shares & Social Traffic
During this step, you need to measure:
- How well your content pieces have been promoted on social media channels.
- How many people they’ve reached.
- How much traffic they have driven.
If you spend most of your time spreading your content on social media, then you should be getting more than likes, shares, and retweets. You should also be attracting some good traffic.
However, not all social media channels work the same way, and sometimes we need to reconsider and adjust our marketing strategy so that it fits into the framework of a specific platform. But other times, an article that brings you the most impressions and generates myriads of interactions, but attracts the least traffic.
Once you have gathered a list of URLs, it’s time to analyze them for the number of social shares and traffic that those pages have generated.
If you decided to get the list of content pages using BuzzSumo, then you should be able to see the number of social shares right away.
For those of you who prefer to work with Google Analytics or Google Search Console, the task still needs to be completed. To do that, you can upload a list of your URLs in Ahrefs Batch analysis tool or use SharedCount software, which is free.
For as much as it sounds great, there is a little problem.
Unfortunately, both of these marketing solutions are missing data for Twitter. So, if Twitter data is important to you and, your best bet is to log into BuzzSumo that has data about all social networks stored in one place, and match your datasets in Excel using Vlookup formula. This formula will help you match your datasets in a jiffy. If the name of this Excel formula doesn’t ring a bell, read this article to learn more.
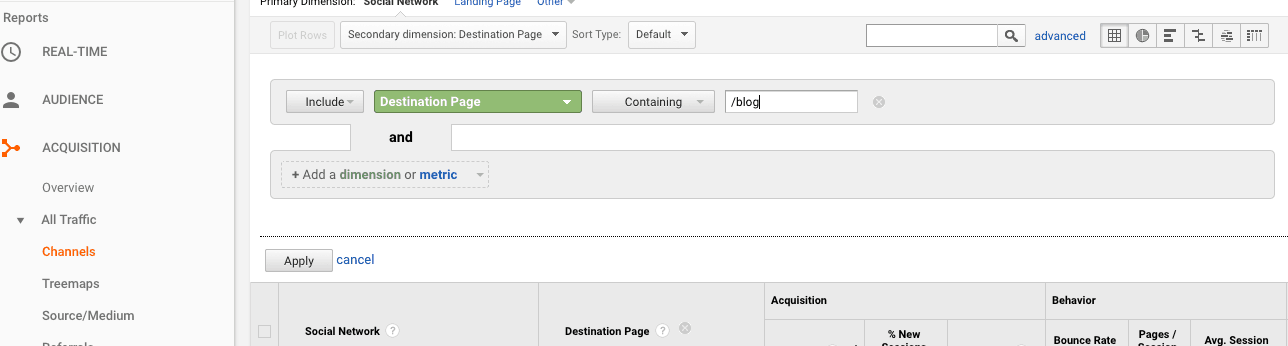
When it comes to making sense of my traffic numbers, I typically go to Google Analytics and use ‘Channels’ report that can be found the section called “All Traffic”. In this report, you can click on a drop-down menu and select a default channel group on Social.

After that, you will be able to view a report that includes traffic from social media channels only. It’s also important to apply another filter called ‘Destination page’. Make sure you include only those content pages that are important to your research.
That’s it!
Now you can export the data you got into a spreadsheet.
After you match your datasets, you’ll see something that looks like this table below.
Use this table to analyze the total number of social shares, the amount of traffic and performance of content for your social networks individually:
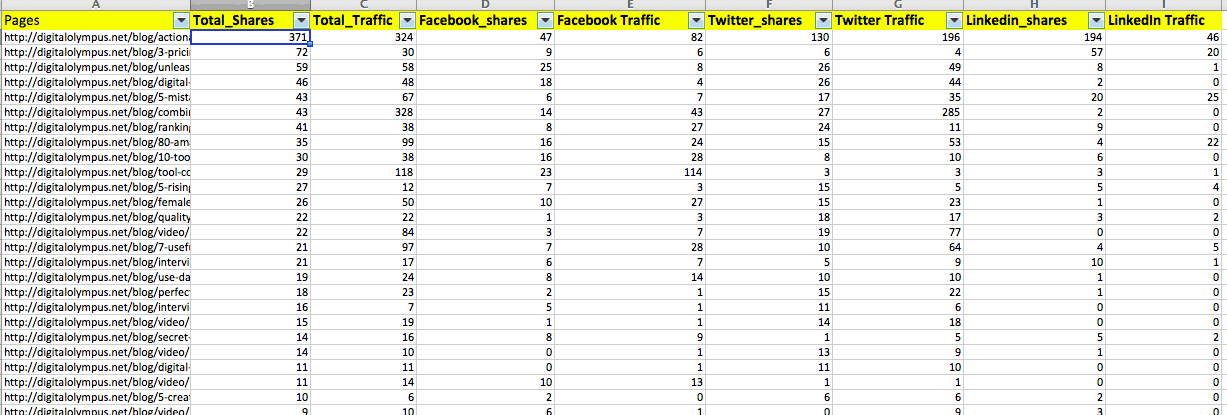
I pay attention to how much traffic my pages attract, that’s why the most effective and efficient channel in my case is Twitter. It brings about 80 percent of the overall traffic I get.
What I find interesting is that I know that we spend a lot of time promoting our content on Facebook. However, despite the fact that our engagement level on Facebook isn’t going through the roof, we still have a steady flow of traffic. In other words, it works backward with Facebook, and with a low engagement rate, it is still possible to receive traffic.
Believe it or not, the biggest drivers of traffic for us are the roundup posts. They typically get the most views.
Also, content promotion on Facebook requires 2-3x more time than the same activity performed on Twitter. That’s why an average cost per visitor on Facebook is much higher compared to Twitter.
Now, what do you do with all this data that you’ve spent hours digging up?
If you take a quick look at it, it will tell you how many social shares you need to receive to attract the desired number of online visitors.
However, as you’ve probably already discovered, some social media channels take longer to bring results than the others. That’s just how it works.
If you decide to spend a little more time and analyze each of your social channels separately, then you will be able to tell what kind of content attracts more traffic, and what do people like to share while browsing around on Facebook or Twitter. You will then forward this information to your content team so that they keep up with your audience’s interests and demands.
Conclusion
You may not always like the results you see, but it’s always important to know the truth about how effective your current content promotion strategy is.
It will take some time for you to figure out which tactics work best for your brand.
You will have to do some legwork and work on a list of URLs for your analysis. Gathering information about how many people actually read your article is time-consuming, too. But luckily, there are numerous tools to assist you with your research.
Regardless of how big your marketing campaign is, attracting and converting relevant audiences is most likely one of your top marketing goals.
Hopefully, the tips in this post are helpful to you, and take a little stress out of your evaluation of your content promotion on social media channels.
More Content Marketing Resources Here:
- How to Use Social Insights to Improve Your Brand’s Content
- How Content Marketing Impacts Purchase Decisions, Brand Affinity, and Trust
- How to Turn Social Media Data Into Engaging Local Content
Image Credits
Featured Image: Created by Alexandra Tachalova, November 2017.
Screenshots by Alexandra Tachalova. Taken November 2017.
