

One of the most important technical toolkits at the fingertips of any SEO pro is Google Chrome.
No matter what SEO software you might be using to automate audits or diagnose SEO issues at scale, Chrome DevTools continues to provide crucial ways to spot-check SEO issues on the fly.
Now, there have been plenty of articles outlining some of the ways that DevTools can help SEO professionals and developers alike.
However, I want to share a couple of different use cases where SEO pros can lean on DevTools.
- Troubleshoot site performance.
- Double-check how Google sees your site.
- Spot-check crawl errors.
1. Setting Up DevTools for Ad Hoc SEO Troubleshooting
For anyone who hasn’t ventured into Chrome’s DevTools, accessing it is as simple as right-clicking a webpage and clicking Inspect.
Approaching this from the lens of SEO professionals, I recommend using both the Element pane – allowing you to look at the DOM and CSS – as well as enabling a few different tools in the console drawer.
To get started, right-click, and select Inspect.
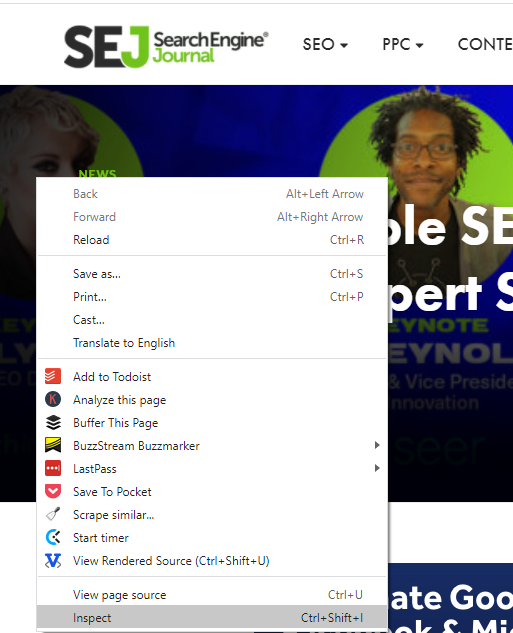
By default, this brings up the Elements panel, giving you a glimpse of the DOM and the style sheets used to compose the page.
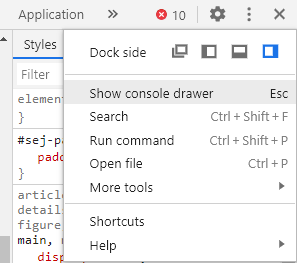
This view alone offers us plenty of things to dive into, but to take full advantage of the toolkit, enable the console drawer.
Click on the three dots next to the settings icon, and scroll down to Show console drawer.
Alternatively, click the Escape key.
With both the console drawer and the element panel enabled, users are able to get a glimpse of the code that’s being rendered in the DOM and the style sheets that are being used to paint that code in the browser.
As well as a host of other tools that can be accessed from the console drawer.
Depending on how frequently you use DevTools, the console drawer may just show the console itself.
The console panel allows you to view logged messages and run JavaScript – but we won’t get into that today.
Instead, we’ll focus on enabling three additional tools:
- Network conditions.
- Coverage.
- Rendering.
Under More Tools, select each of these three items until they appear as tabs in the console drawer.
Our DevTools panel should look something like this:
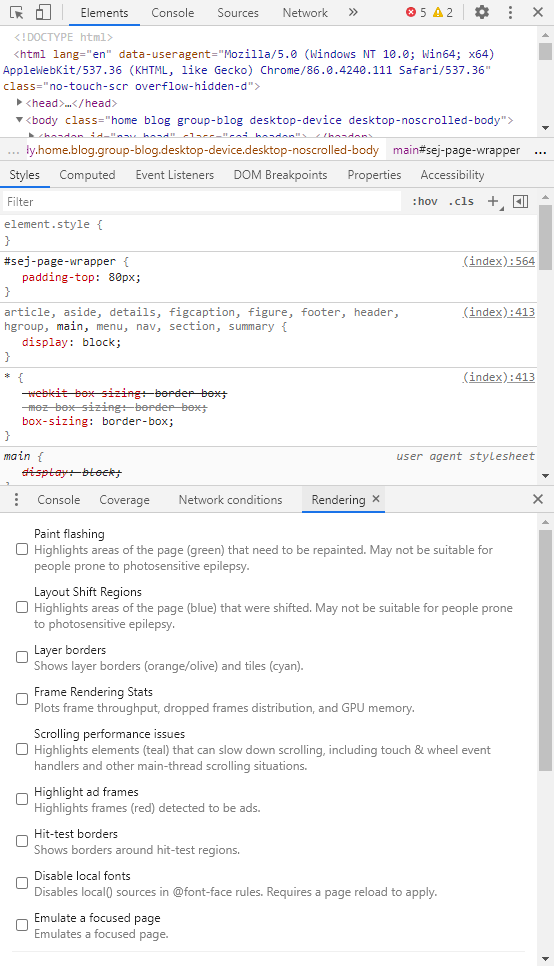
Now that these three panes are enabled, let’s get into troubleshooting.
2. Switching User-Agent in DevTools
One of the most overlooked ways to use DevTools is leaning on Chrome’s built-in ability to switch User-Agent.
This simple test has helped uncover a number of different issues by providing insight into how Googlebot is seeing and processing the information on a site.
For the investigative SEO professional, DevTools can often act as a trusty magnifying glass allowing users to zoom in on a particular issue to uncover a root cause.
How to Switch Your User-Agent
In order to switch your user-agent in Chrome, use the Network Conditions tab in the console drawer.
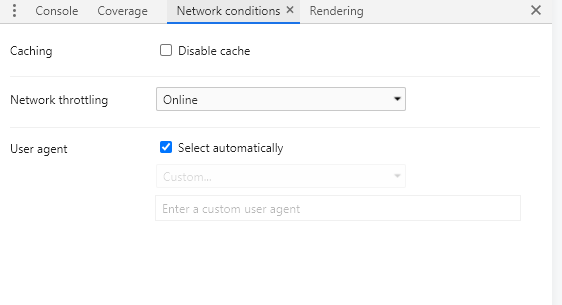
Uncheck Select automatically, and you can view the content using Googlebot Smartphone, Bingbot, or any number of other user agents to see how content is being delivered.
The Case of the Mobile Alternate Site
Take a site where Google may not be showing the updated title tag or meta description in SERPs.
It may be difficult to ascertain why Google has seemingly chosen another title altogether or failed to update the title in SERPs from a previous title tag.
In one case, after switching the User-Agent to Googlebot Smartphone, it became quickly apparent that the site was still serving an alternate mobile site to Googlebot.
Because Google had already made the switch to mobile-first indexing, Google was processing and indexing the changes on the mobile site, while failing to catch the updates that had been made on the desktop version of the domain.
Mobile sites may seem like a relic of the distant past, but they certainly still exist.
In fact, a site: search for m.*.com sites reveals over 2 billion in Google search:
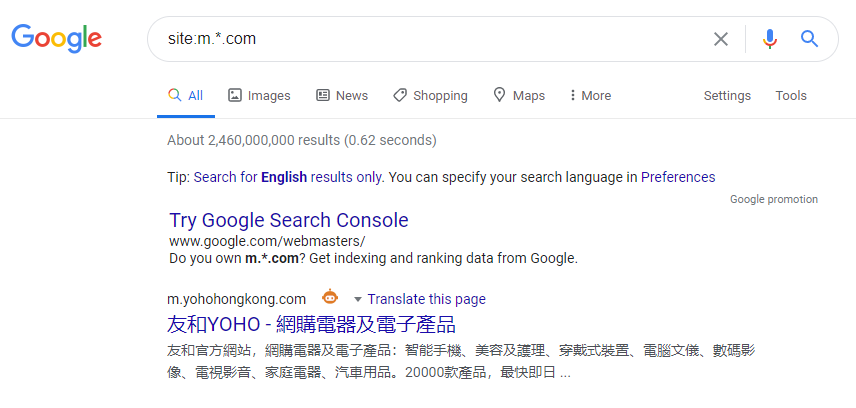
While it may be easy enough to spot an issue like this in a crawl by looking for the rel=”alternate” meta tag, switching the User-Agent in Google Chrome offers a great opportunity to spot a potential issue without ever having to leave the browser.
Spotting Overzealous Server Protection
It’s no secret that there are plenty of bad actors out there on the web.
Additionally, it’s no secret that many hackers and generally malicious miscreants may try to use the power of Google against a site.
This is why we can’t have nice things.
As a result, some server stacks, CDNs, and hosting providers may offer some built-in security features that block Googlebot spoofs in an effort to ensure a site stays safe from spammy crawlers.
However, sometimes a site may get a little too overzealous, and end up accidentally blocking Googlebot!
If you see a message like the one here, it might be time to do some testing:
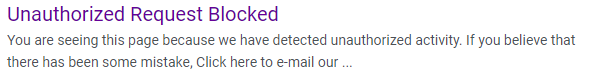
When we saw this message on Google’s SERPs, it was clear something foul was afoot.
However, the browser loaded all content without issue.
Was Google seeing something different?
By using the User-Agent switcher in DevTools, we were able to see that the site was serving that message when the User-Agent was set to Googlebot Smartphone.
While this may be a fine way to keep Googlebot spoofs at bay, they had accidentally blocked the real Googlebot!
The User-Agent switcher is not without its flaws, and certainly not a catch-all.
In fact, CDNs like Cloudflare are notorious for blocking traffic from visits that might spoof a search engine’s User-Agent.
When visiting Cloudflare’s own site with Googlebot set as the User-Agent, you’re greeted with a page like this:
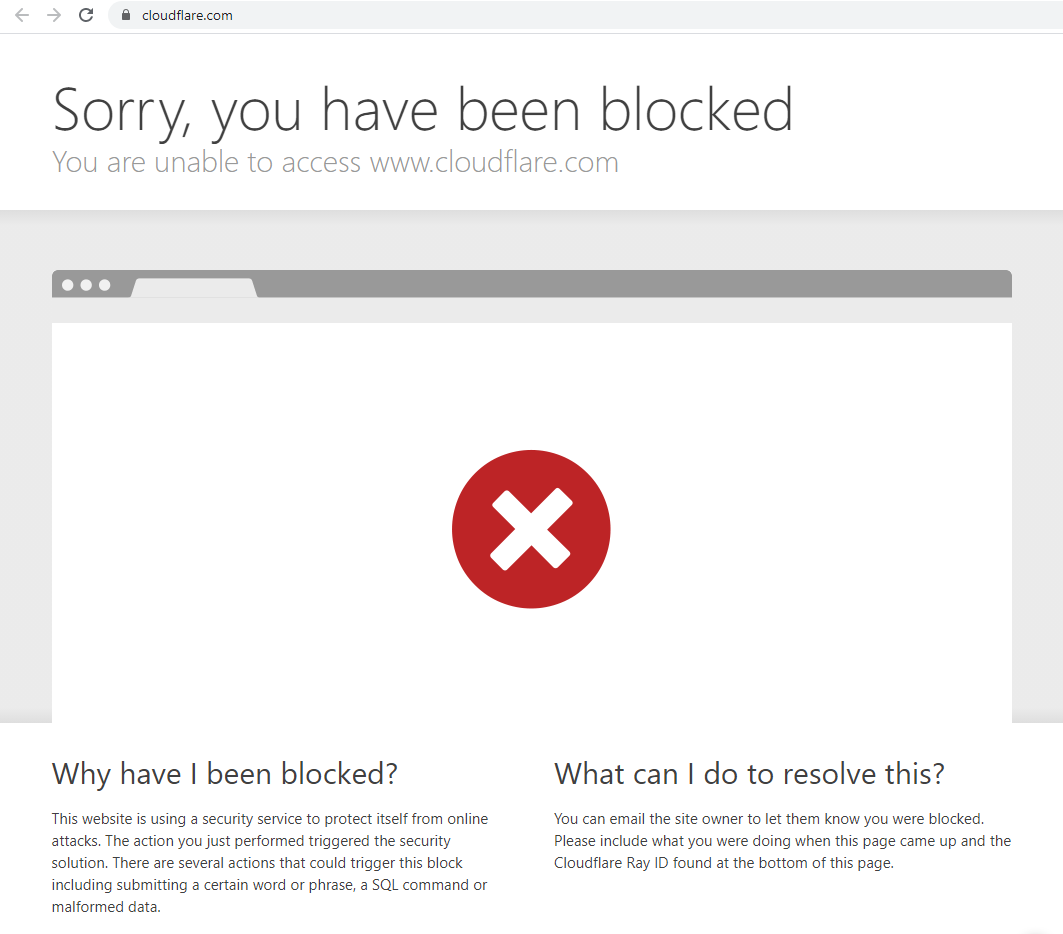
Similarly, switching User-Agents won’t tell you whether Googlebot can render JavaScript on the first pass or other important accessibility issues.
However, it’s a nice spot-check if what you’re seeing in SERPs is unexpected.
Diagnosing Core Web Vitals in DevTools
One important tab in DevTools is the Performance tab.
This is a great gateway for troubleshooting issues that relate to page speed and performance and can offer some actionable takeaways when it comes to Core Web Vitals.
While the metrics that are part of Google’s Core Web Vitals have been a part of page speed and performance reports for some time, it is super important for SEO professionals to be familiar with how to dissect these issues.
Especially as webmasters become more acutely aware of the importance of Core Web Vitals to Search.
Using the Performance tab in DevTools is a step to better understanding these important web metrics.
How to Set Up the Performance Tab for Debugging Core Web Vitals
On the top tab in DevTools, click the Performance tab.
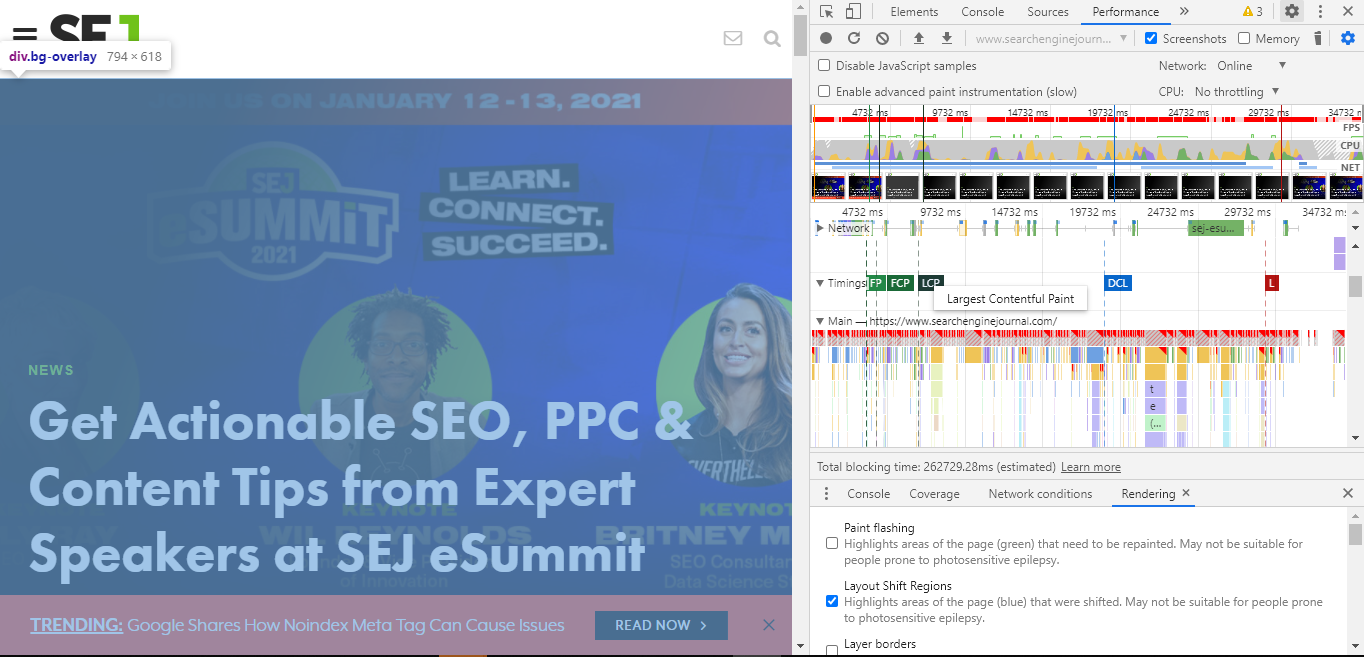
Ensure the Screenshots button is checked, then click the Refresh icon in the Performance tab to record the page load.
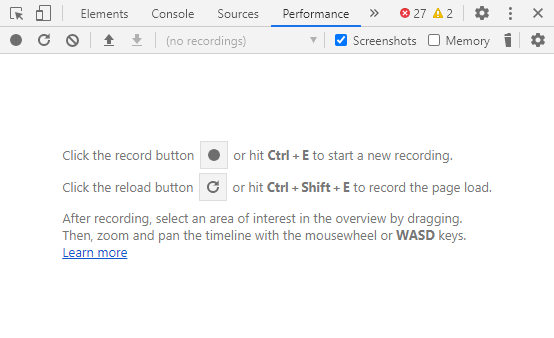
The profile that loads gives an overview of how long it took to load the page, with timings highlighted for significant events.
Within the timings section, users can see flags for things like FCP (First Contentful Paint), and LCP (Largest Contentful Paint), one of our Core Web Vitals.
In hovering over the flag for LCP, we can actually see the piece of content flagged to be the largest contentful paint during the page load.
This can help remove the guesswork as technical SEO pros work together with development and performance teams to troubleshoot Core Web Vitals.
Checking for Cumulative Layout Shift
DevTools also lets you identify what elements may cause layout shifting.
Often, when images and ads finish loading, content may appear to jump around on the screen.
This occurs when the page hasn’t reserved the real estate required for these assets, causing the layout to shift and move as the content is loaded.
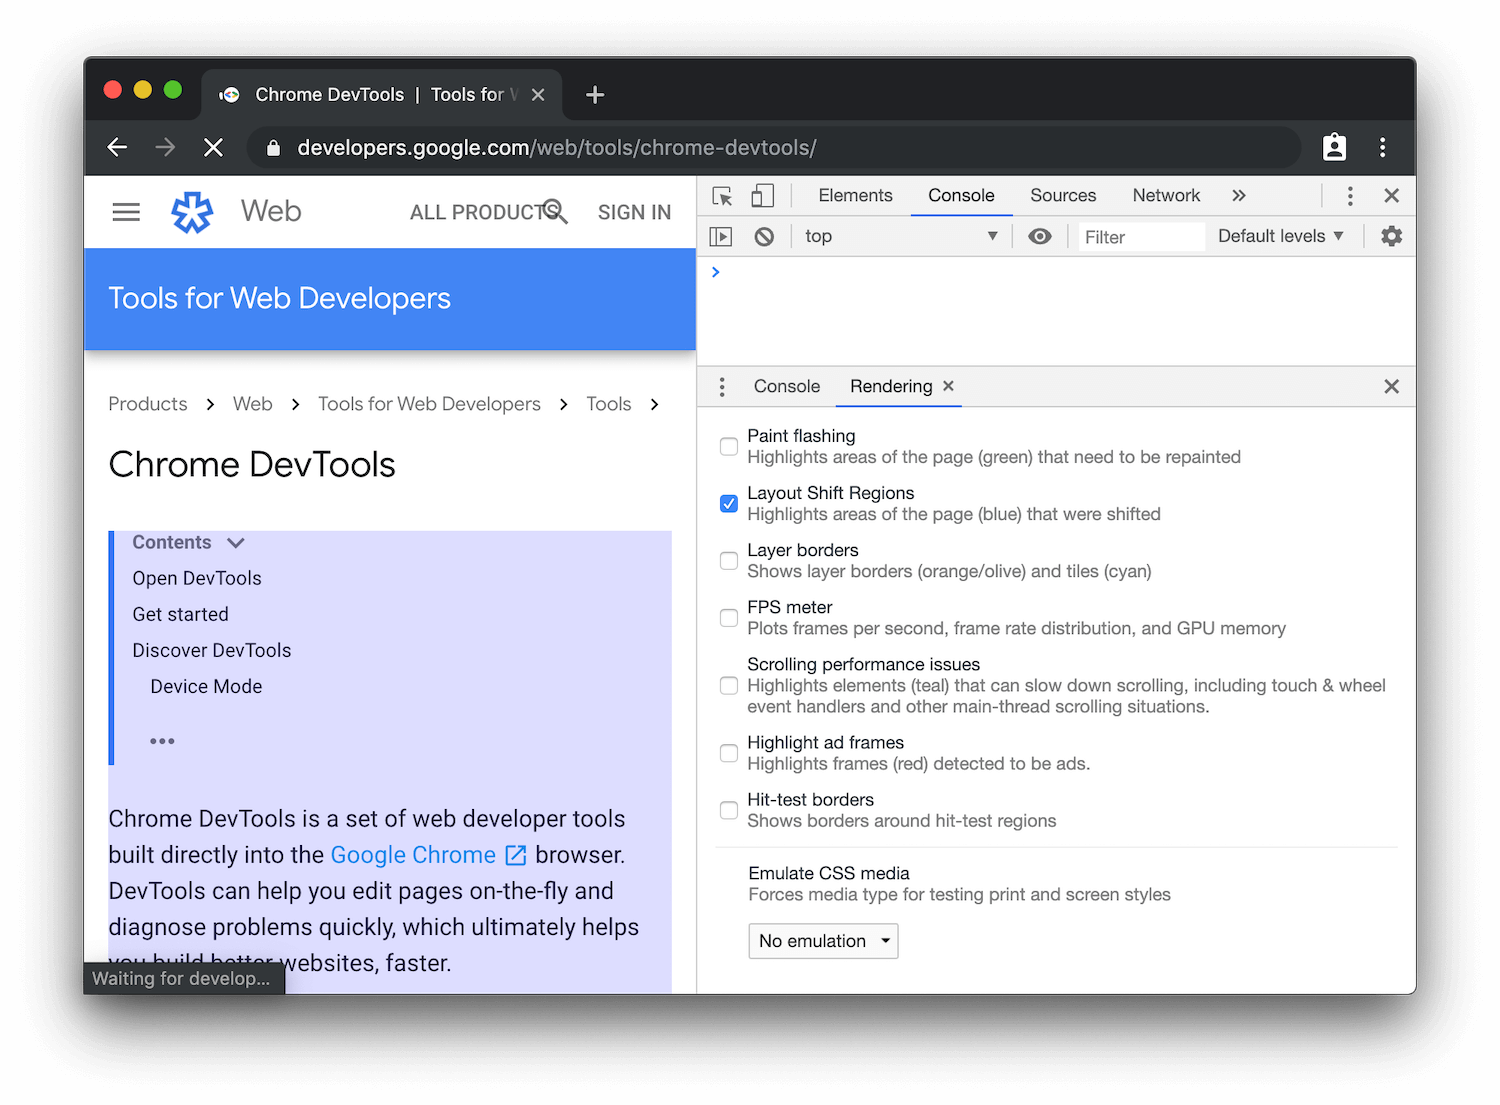
In order to help detect layout shift, use the Rendering tab in the console drawer.
Check the option for Layout Shift Regions, which will highlight areas of the page that undergo a layout shift as content is loaded.
Layout shifts will then be highlighted in blue as you interact with the page.
This can help webmasters and developers understand what resources may need placeholders.
3. Double-Check Your HTTP Headers & Review Unused Code
We often hear about soft 404s in SEO audits.
Soft 404s are when the browser may show a 404 page, but instead, return a 200 OK Response Code.
In some cases, you may see content load exactly as expected on the browser, yet the HTTP Response Code may show a 404, a 302, or is generally incorrect or different than expected.
In any case, it’s helpful to see the HTTP response codes for every page and resource.
While there are a host of awesome Chrome Extensions that give you information about response codes, this is something you can check straight from DevTools.
Use DevTools and navigate to the Network tab.
Here, DevTools shows all of the individual resources being called to compile the page, the corresponding status codes, and a waterfall visualization.
There are two incredibly helpful views here to help filter and sort through status code information.
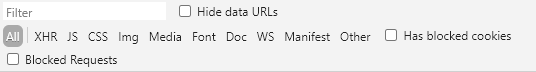
First, the filetype filter at the top of the Network tab allows us to narrow our focus to specific content types:
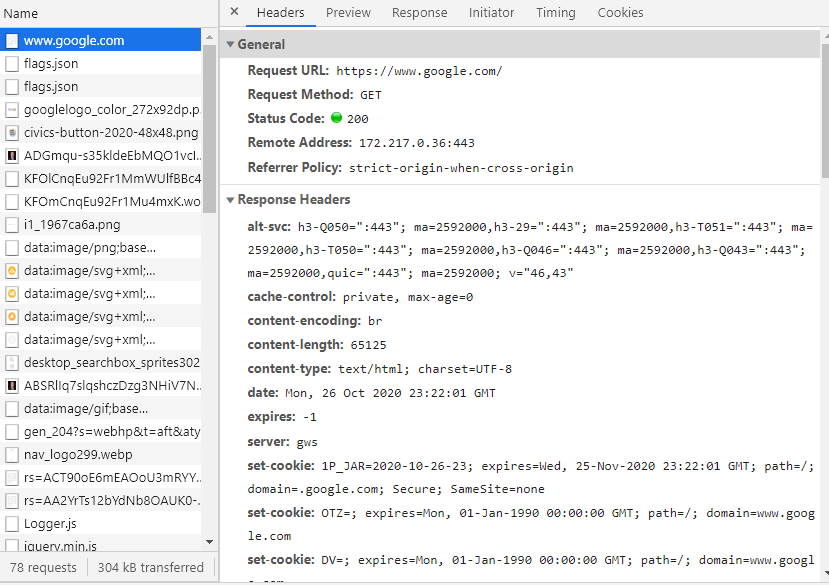
After selecting a resource, the Headers sub-menu in the Network tab allows us to see a host of information regarding the selected file.
This includes all HTTP header information, like the Request URL, the Request Method, the Status Code, content-encoding, last-modified date, server, and so much more.
This can be incredibly useful information when troubleshooting.
You can lean on this info to:
- Verify GZip compression is enabled.
- Double-check that cache-control is working as expected.
- Verify we’re sending Googlebot and other user-agents the appropriate status code.
Review Unused Code
Lastly, I always like to leave the Coverage tab available in the console drawer.
Using this tab, you can quickly hit reload and identify how much of the code being shipped is actually being used.
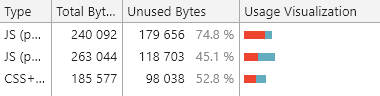
Often, you’ll see JavaScript and CSS files that have a large percentage of unused code.
When troubleshooting site speed or performance, these are often the first render-blocking resources that should be evaluated for optimization.
If you’re shipping a ton of CSS that’s never used, it’s going to be a massive drain on performance.
CSS is always render-blocking – as a result, large CSS files can drastically slow down page speed and performance.
By identifying the scripts that are unused, SEO professionals can often help developers and webmasters troubleshoot what resources require better optimization for increased performance.
In short, Google Chrome is a critically important SEO tool in your arsenal.
The Takeaway
DevTools offers a powerful glimpse under the hood of any website and can be a critical part of a technical audit.
However, one of the best parts about using DevTools is its speed.
Without ever leaving your browser, SEO professionals can feel empowered to spot check issues from crawlability to performance.
More Resources:
- 4 Advanced Ways to Use Chrome DevTools for Technical SEO Audits
- 7 Tips to Improve Your Core Web Vitals Scores & Page Experience Signals
- Advanced Technical SEO: A Complete Guide
Image Credits
All screenshots taken by author, November 2020
