
Google Analytics (GA) is a free tool offered by Google to track activity that occurs on your website.
With GA installed on a site, you can see how many visitors your website/app has, what pages receive the most traffic and, if configured, where actions occur.
For example, if you want to know how many users visit your site, Google Analytics can help you see the number of visits, what marketing channel they came from, and whether they were on a desktop or mobile device.
There’s no doubt that Google Analytics is an incredibly powerful tool for marketers, but GA was not built to tell you everything.
What Google Analytics Can’t Tell You
It’s important for marketers to be aware of Google Analytics’ limitations. Once you know what you don’t have, you can figure out how to get it.
Here are the five main things Google Analytics can’t tell you and how to get the missing information, so you can make the right marketing decisions.
1. Historical Data
Historical data is what happened prior to installing the Google Analytics tracking code to your website.
Think of the tracking code as a fishing net. Once in the water, you can look and see how many fish were caught.
But before the net is in place, you can only assume or guess as to how many fish passed through.
This is why I highly recommend setting Google Analytics up before your site launch. And, if you have yet to set up GA4, you should definitely make that a priority.
Another way you may be missing data is because Google Analytics (standard) does not automatically collect what actions users take on-site. It only tells you how many, where from, and what pages they view.
GA4 automatically tags some actions (known as events) but is missing some really important touchpoints for SEO pros, like submitting a form.
A good friend introduced me to a new analytics software, HockeyStack, which does not provide “historical data” per se but provides retroactive event tracking.
The moment you place the HockeyStack script, it automatically begins collecting all event data. No event tagging required.
I chatted with the co-founder, Emir Atli, who explained that even if it takes you months to get around to setting up goals and funnels, that historical event data will be there.
Here is a screenshot of what retroactive event tracking looks like in HockeyStack:
![]()
2. Sampling
The second thing Google Analytics can’t tell you is another instance where you may be missing out on information about your site traffic: sampling.
Data sampling means that a smaller portion of data was analyzed in order to quickly identify patterns and trends.
Seer Interactive shared a great data sampling example years ago so rather than trying to reinvent the wheel, I’m going to share a paraphrased version.
Imagine your kids dump out 10,000 Lego pieces on the floor. For one reason or another, you wonder how many red Lego pieces there are.
Now, you could spend hours counting proverbial Legos – or you could select one section and count just 1,000 pieces.
If there were 200 red Legos in that 1,000 sample (this is a data “subset”), it’s reasonable to assume that 2,000 red legos were dumped out.
Obviously, sampling is significantly quicker. But at what expense?
In our Lego example, we assume that the red Legos are evenly distributed throughout the room. If the red Legos are not evenly distributed (as with business seasonality, for example) then your sampling may be way off.
So, what can we do about data sampling?
The first step is to know if your data is being sampled. If you are using the free Google Analytics account, data sampling kicks in at around 500,000 sessions within the specified date range.
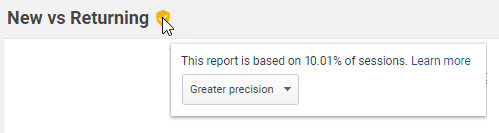
When sampling is in effect, you will see a yellow shield with a checkmark at the top of the report. The message reads, “This report is based on N% of sessions.”
If you want to stop your data from being sampled, simply update to GA4. Google Analytics 4 is still free and has no hit limits.
There is one catch. Your data may not be “sampled” but thresholds are applied to protect user privacy.
When a report contains age, gender, or interest categories, a threshold may be applied and some data may be kept hidden (unknown) from the report.
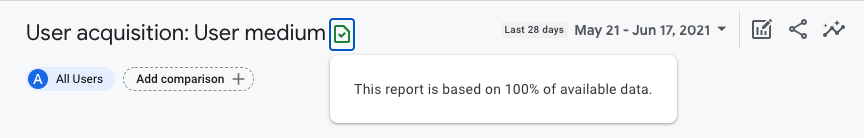
The green checkmark in a GA4 default report indicates that it is 100% non-sampled data.
3. Heat Mapping
Now that we have covered the ways Google Analytics may not be providing the entire data picture, it’s time to talk about where GA falls short in onsite analysis.
Heat mapping is a data visualization technique using bright colors (red) to represent larger values and cool colors (blue) to represent smaller values.
Simply put, it is a quick and easy way to see how customers interact with your web pages, as in what they click – or don’t.
Website heatmaps come in three types:
- Click maps show where users click or don’t click.
- Scroll maps show how far users scroll, by the percentage of all users.
- Hover maps show the location and movement of a user’s cursor.
Digital marketers use heatmaps to understand a user’s behavior on a webpage. These insights are essential when you’re tasked with optimizing a page layout, improving UX, or increasing conversions.
While Google Analytics has a heat map (kinda), it is lacking all the bells and whistles paid services features. However, it will tell you where users are clicking and where they are not.
The thing is, you won’t find a heat map in your Google Analytics account. It’s actually a chrome extension called Page Analytics.
The product has been deprecated and is no longer receiving updates as of March 08, 2019. At the date of publication, Page Analytics Chrome Extension is still working for Google Analytics (standard) users. I have yet to find an easy solution for GA4 users.
There are just a few quick steps to seeing the Google Analytics real-time heatmap. First, you need to download Page Analytics by Google to your Extensions toolbar.
Next, log in to your Google Analytics and open a webpage associated with your GA account.
Lastly, don’t forget to enable (turn on) Page Analytics.
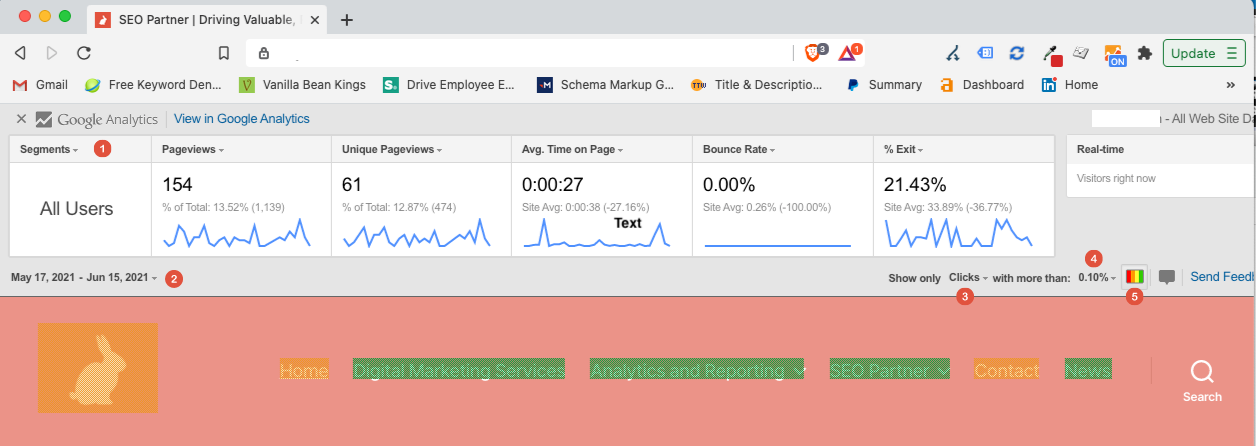
Google Analytics: Heatmap Extension
- Customize view metrics.
- Select Date Range.
- Select what action you want visualized: Clicks vs Goals.
- Select the minimum ratio to display.
- Select heatmap or annotation.
4. Social Media Monitoring
The last two things on this list are going to be about users’ interactions and conversations off-site that are really essential to successful marketing campaigns.
Social media monitoring is tracking information relevant to your business on social platforms; things like brand mentions, relevant hashtags, shared articles, and posts, etc.
Google Analytics can track actions and behavior on your website such as which social network users are referred from, which of your pages they land on, and whether they triggered an event.
GA can not tell you about user activity on social platforms like Facebook, IG, and Twitter.
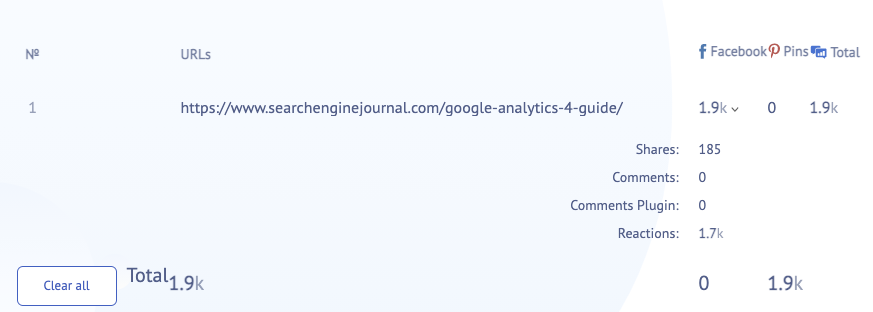
If you’re handy with APIs, SharedCount provides social share analytics and insights. A free account can use up to 500 API calls per day.
This SharedCount screenshot shows my getting started with GA4 guide has 185 shares and 1.7k reactions on Facebook.
5. Lead Quality
Lead quality is the most difficult type of behavior to track because it generally happens offline. Things like sales calls and the content within form submissions are essential for determining the effectiveness of marketing efforts.
When it comes to quantifying lead quality, despite how essential this metric is, business owners rely on an overall “feeling” they get.
For offline interactions like sales calls and in-store visits, the best thing you can do as a marketer is to sit in on those calls to fully understand the customer.
For lead submissions, there are ways to “score” fields using Google Tag Manager. But unless you’re an Analytics wiz, you’re likely to find this confusing and time-consuming.
Maybe one day, we’ll see a tool that combines online and offline lead quality scoring that is more accessible to small business owners and provides better data for marketing professionals.
Final Thoughts
Google Analytics (GA) is an incredible free tool for marketers. Understanding how many visitors go to which pages and what actions take place are the building blocks of a successful digital marketing plan.
Just keep in mind that GA was not intended to do everything.
Google Analytics data is not retroactive, data may be sampled, there’s no heat mapping, and we can’t score offsite conversations such as social media mentions and sales calls.
With some tweaks and adjustments, it is possible to transform Google Analytics into a much more robust tool that can power some seriously great digital marketing campaigns.
I strongly encourage you to dig in and learn more about how to get, analyze and act on your digital marketing data.
More Resources:
- 4 Ways to Use Google Analytics to Find Content Ideas
- 10 Great Google Analytics Alternatives
- Core Web Vitals: A Complete Guide
Image Credits
All screenshots taken by author, June 2021
