
I’ve been told that I don’t have a very good poker face, and I’m ok with that. I find it actually helps my clients, since they can tell almost immediately when I don’t agree with something or when a point needs more clarification. For example, there are times I see marketers heavily focus on time-based metrics like Time on Page and Time on Site (as if those metrics were 100% accurate). Unfortunately, this isn’t the case and the numbers reported can be far from accurate.
The confusion about how time metrics are calculated usually leads to some interesting conversations (as clients see various times listed in their reporting and want to start comparing pages and visitor segments.) That’s hard to do, since there are serious limitations with the way time metrics are calculated in web analytics (for now anyway). Even worse, people can subsequently make decisions based on the data. This is why I tend to focus on key actions visitors can take versus other measurements of success. I track these actions via conversion goals and events versus focusing heavily on time-based metrics. I’m not saying that time-based metrics are useless, but they need to be taken with a grain of salt (at least until we find a more accurate way to track them).
For example, let’s say a marketing manager analyzed a new piece of content and was blown away with an Avg. Time on Page of 5:26. This is where my (lack of a) poker face leads to a deeper conversation about how the actual Time on Page could be much different. My comment is typically something like, “I think it’s great that visitors who decided to visit another page on your site spent 5:26 on the page.” I often get a strange look at this point. Then I start to explain that Time on Page is actually calculated by page jumps. So, if someone reaches a certain page and exits from that page (or bounces), then Time on Page is 0:00. No, that’s not a typo. Time on Page is 0:00 whether they spent 10 seconds on the page or 10 minutes. I’ll explain more about how time metrics are calculated below, but I wanted to give a quick example now so we’re on the same page.
Note, although I’m focusing on Time on Page and Time on Site in this post, there are ways to calculate time metrics like Elapsed Time for certain processes that occur on a page. For example, check out my tutorial for using TimeTracker to calculate elapsed time (or Time to Complete). It’s an interesting way to extend event tracking to record how long it takes to finish a process like completing an elaborate form.
Access To Data Can Be Powerful But Interpreting Data Incorrectly Can Be Dangerously Powerful
I never want to rain on anyone’s parade, but it can be dangerous to walk around your office telling everyone something that might not be entirely accurate (and can be way off). When I start helping clients with analytics, I typically make a point to grab a conference room with a white board and start explaining how Time on Page and Time on Site are calculated. After I explain how the metrics are calculated, there are times that I hear a level of skepticism, since there isn’t hard evidence that the metrics are really calculated this way. And I’m totally cool with that. I’d be a hypocrite to say that being skeptical is wrong, since I test everything.
In online marketing, I don’t necessarily take anyone’s word without testing it myself. Which brings me to this post… Based on what I explained above, I decided to run an experiment to test Time on Page and Time on Site in Google Analytics. My goal was to document the hard numbers so you can see how the metrics are reported. I think it’s important to understand the limitations of the metrics, so you can provide context in your analysis. If you provide context, then your clients can better understand the analysis you provide.
The G-Squared Lab
When setting up this experiment, my goal was to isolate directories and pages and then document the exact time that I spent while visiting those pages (and sets of pages). If each visit was isolated, then I could drill into the reporting to see exactly how Google Analytics tracked time for each page and each visit. I’ll detail the paths I took in the experiment below.
Quick Introduction: The Formulas for Time on Page and Time on Site:
Before we hop into the experiment, let’s start with a quick introduction to how Time on Page and Time on Site are calculated. Both metrics are based on page jumps (or moving from one page to the next). By calculating the difference between visiting one page and the next page during the visit (via the page timestamp), Google Analytics can determine how long you stayed on the preceding page. Calculating Time on Page via page jumps is where a major limitation is exposed.
That’s because if you visit a page and then exit the site, the Time on Page is 0:00. As mentioned earlier, that’s whether you spent 10 seconds or 10 minutes on the page. On a similar note, if you visit just one page on the site and leave (which is a bounce), the Time on Page is also 0:00. Time on Site is calculated by adding the time that a visitor spent on the site by combining the Time on Page for each page that was part of the visit. Average Time on Site simply divides total time by number of visits and does not exclude bounces. You can see the formulas below.
Time on Page A = Page B Time – Page A Time (based on the timestamp)
Average Time on Page = Total Time on Page A/(Pageviews – Exits)
Total Time on Site (For a Specific Visit) = Page A + Page B (or the sum of Time on Page for each page in the calculation)
Average Time on Site = Total Time on Site/Visits (this metric includes bounces)
Example:
As a simple example, let’s say that someone visited Page A for 2:00, then visited Page B for 3 minutes, and then exited the site. The Time on Page for Page A would be 2:00. However, the Time on Page for Page B would be 0:00. Google Analytics can identify the Time on Page for Page A only because there was a jump to Page B (and it calculates the difference in time between the two pages). Since the visitor exited the page from Page B, there is no way for Google Analytics to know how much time they spent on the page. The Time on Site would also be 2:00, since the time on Page B cannot be determined. Based on this simple example, can you tell why Time on Page and Time on Site need to be taken with a grain of salt? What if that visitor spent 7:00 on Page B? You would think by just looking at the reporting that visitors were more engaged with Page A, when in reality, they were spending more time on Page B!
The Experiment: 5 Scenarios Plus a Bonus
For the experiment, I set up several directories with four pages in each directory. All the pages within each directory are linked together via simple text links. For each visit, I identified how many pages I would visit and how long I would spend on each page (give or take a few seconds). Everything was documented so I could cross reference my notes to see if the reporting matched up. I will list each scenario below and show you the reporting in Google Analytics. Then you can see for yourself how the metrics are calculated.
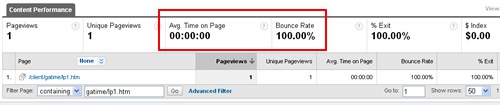
Scenario 1: Bounce After 20 Seconds
For the first visit, I wanted to simply bounce, but after a short visit. I visited the first page, stayed for just 20 seconds, and then exited the site. I wanted to show you how the Time on Page for a bounce is reported as 0:00. After checking the reporting, it surely was.
Scenario 2: Bounce After 5 Minutes
I’ve heard some confusion about what determines a bounce in Google Analytics. For example, some people think that if you spend enough time on a page, it’s not considered a bounce. So, I spent five minutes during the next visit, but stayed on the landing page. Once again, the time on page was 0:00 and it was considered a bounce. I just wanted to clarify that point.

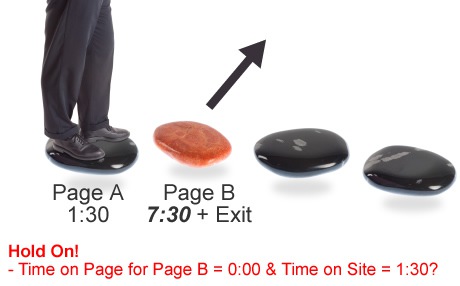
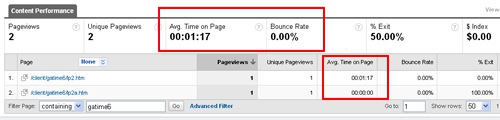
Scenario 3: Land on Page A, Spend 1:17, Click Through to Page B, Spend 1:30 and Then Exit
For the third visit, I wanted to visit the first page in the directory (Page A), wait 1:17 and then click through to Page B. I would spend another 1:30 on Page B and then exit the site. Based on what I explained earlier, the Time on Page for Page A should be 1:17 and the Time on Page for Page B should be 0:00. In addition, the Time on Site for this visit should only be 1:17, even though I actually spent close to 3:00. The reporting confirmed this.

Scenario 4: Land on Page A, Spend 1:23, Click Through to Page B, Spend 0:58, Click Through to Page C, Then Exit
For the fourth visit, I wanted to visit Page A for 1:23, Page B for 0:58, then click through to Page C. I would spend 1:00 on Page C and then exit. The reporting should show a Time on Page of 1:23 for Page A, 0:58 for Page B, and then 0:00 for Page C (even though I spent over a minute on the final page). Also, Time on Site should be 2:21, even though I spent 3:21 on the site. The reporting confirms this.
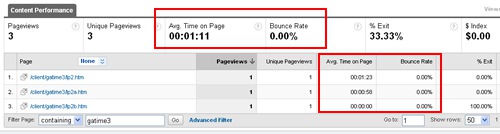

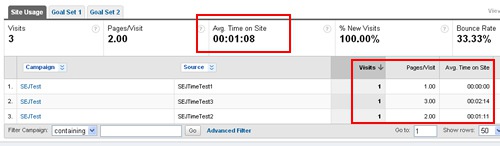
Scenario 5: Combining Visits to Show Average Time on Site
I mentioned above that Average Time on Site (ATOS) includes bounces, so I wanted to show you how this looks when you combine multiple visits. So, I visited the same set of pages three times. The durations for each visit were 0:00 (a bounce), 1:11, and 2:14. Based on the calculation for Average Time on Site, the bounce should be included and the ATOS should be 1:08. The reporting confirmed this.
Bonus: The Virtual Pageview
I mentioned earlier that if you exit from a page (including a bounce), then Time on Page is 0:00. But that’s not always the case. Welcome to web analytics. 🙂 There’s something called a virtual pageview that enables you to trigger a pageview, but in reality, a page wasn’t really loaded. It’s a versatile feature in Google Analytics and can help you track clicks off your site, conversions that don’t require a page to load, and other clicks you want to track that don’t necessarily load pages. You can also use a virtual pageview to track conversion goals (since you can use that virtual pageview as the destination URL for the conversion goal). Again, you can read my blog post about conversion goals and events to learn more about this functionality.
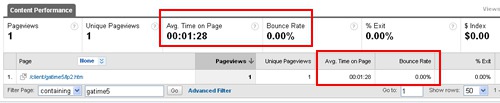
The Virtual Pageview Reporting:
In this scenario, I visited one page and bounced. However, I triggered a virtual pageview after staying for 1:28 (before I left the page). So, does triggering a virtual pageview impact Time on Page? It absolutely does (see the screenshot below) and it’s important to understand this when analyzing your reporting. The bounce rate was 0% and Time on Page was 1:28. If the virtual pageview was not triggered, the Time on Page would have been 0:00 and the bounce rate would have been 100%. Keep this in mind when analyzing your reporting.
Moving Forward With Time on Page and Time on Site
There you have it. We’ve taken a detailed look at Time on Page and Time on Site in Google Analytics, while exposing some of the limitations with time-based metrics. I hope the results from my experiment help you better understand how the metrics are actually calculated. To be clear, I’m not saying to forget about Time on Page and Time on Site, but you just need to take the metrics with a grain of salt. As you’ve seen in this post, the actual numbers may be off (and way off for certain situations). This discrepancy makes it challenging to determine if the time reported was good or bad, which can definitely inhibit making solid decisions on the data.
Some key takeaways regarding Time on Page and Time on Site:
- Don’t obsess over Time on Page or Time on Site. Unfortunately, the metrics are flawed and can skew your analysis. Keep the limitations in mind while analyzing site performance.
- Time on Page does not include exits (or bounces), and can inaccurately report actual time on the page. It can be much lower or much higher than reported…
- Time on Site does include bounces, but still cannot determine the actual length of time spent on exit pages. Therefore, this number can also be way off.
- Virtual pageviews enable Google Analytics to calculate Time on Page, even for exits (from the time the virtual pageview is triggered).
- Try and focus on key actions that visitors can take on the site (in the form of conversion goals and events.) Then you can use time metrics to help support your findings (if it makes sense for the site in question).
Now it’s your turn to help us accurately report the Time on Page for my post. Please visit another page on Search Engine Journal so I know how long you actually spent reading my post! 🙂
