

Looking for advanced ways to work with your marketing data, better present insights, and improve reporting across your SEO activities?
On December 2, I moderated a Search Engine Journal webinar sponsored by SEMrush and presented by Nick Wilsdon, Partner, Torque Partnership.
He discussed how a data integration for Google Data Studio can support your SEO activities and shared some advanced use-cases with the SEMrush Data Studio Connector.
Here’s a recap of the presentation.

Google Data Studio (GDS) is a free yet robust tool that allows marketers to make visual dashboards and reports that combine various data sources, including Google Analytics, BigQuery, Google Sheets, YouTube, and more.
Connecting Google Analytics or Search Console to GDS allows you to create more flexible and customized reports on your website’s top performing search terms and pages
But if you’re looking to take your reporting to the next level, integrating Google Data Studio with SEO platforms such as SEMrush is a must.
When you integrate SEMrush with Google Data Studio, there are three separate connection points:
- Position tracking lets you search statistics on any domain in the SEMrush database.
- Domain analytics lets you track rankings for a custom set of target keywords.
- Site audit lets you audit any domain on the web and receive a report on the site’s main technical errors that hurt its health and visibility.
Here are some ways to make the most out of this data integration.
Focus on Domain Overview Metrics
The SEMrush Domain Overview report enables you to research or monitoring on your own domains or competitors.
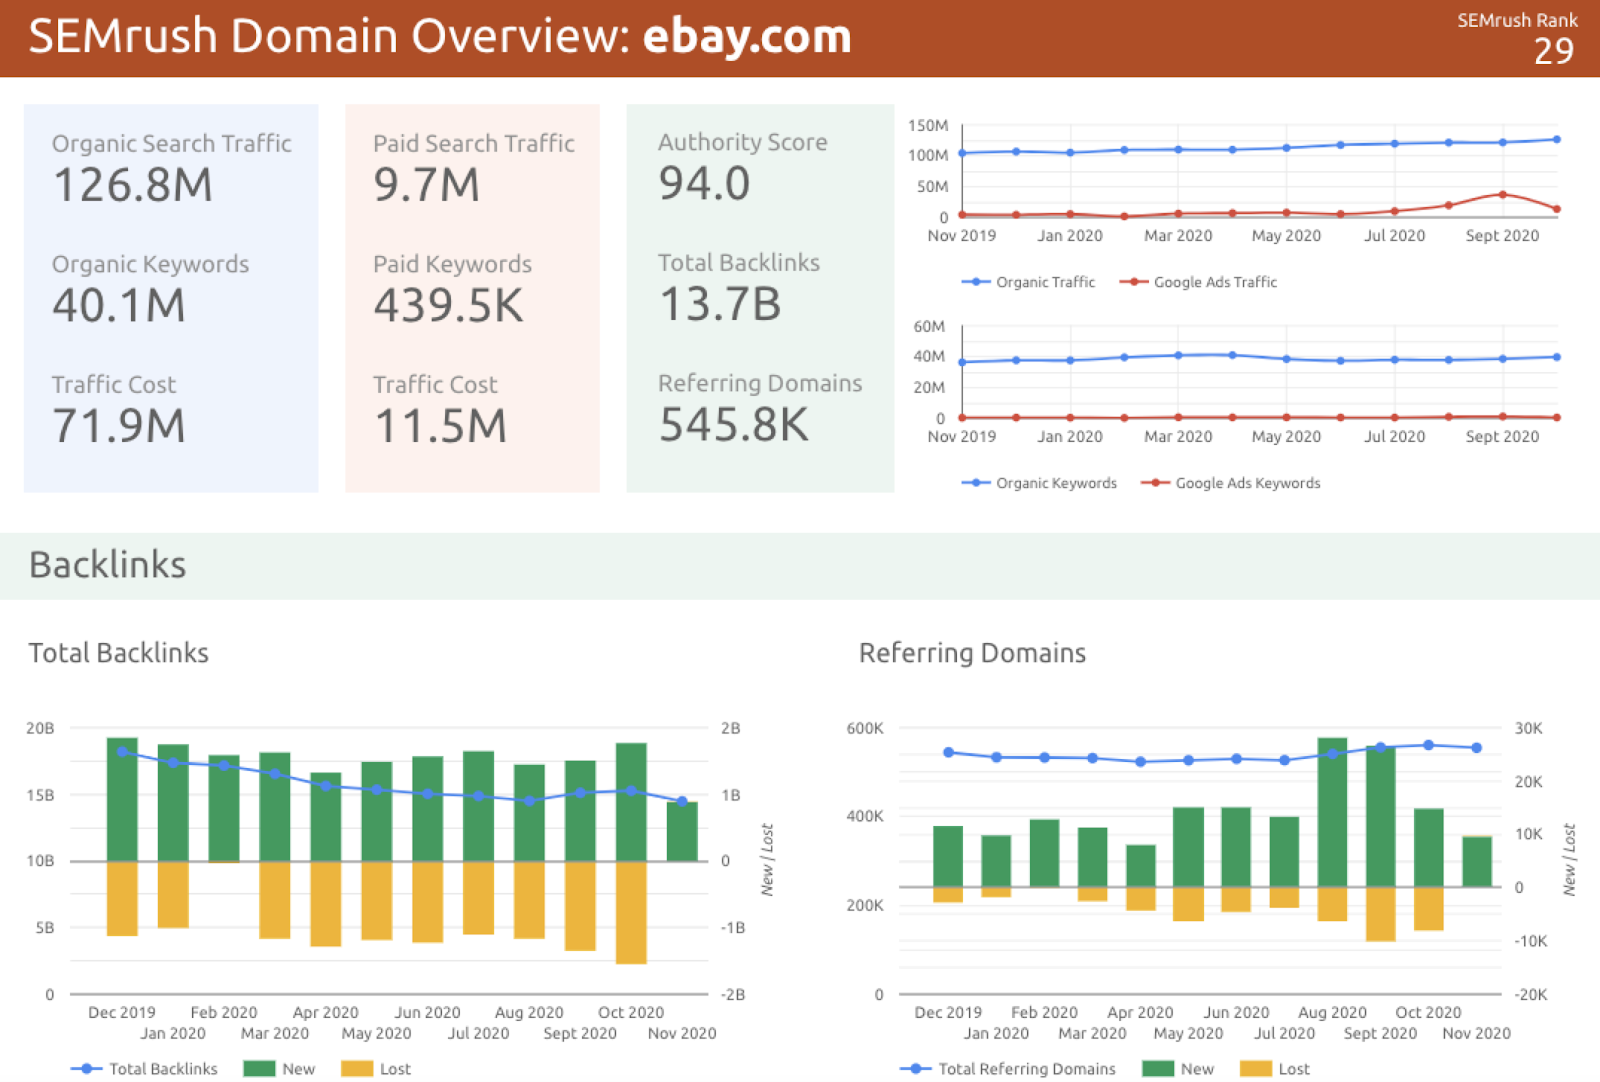
What Can You Do With This Data?
Pulling this data to GDS can help you create a report that includes:
- SEMrush Rank.
- Top organic and paid keywords (Google Ads).
- Backlinks.
- Estimates of organic and paid traffic.
- Traffic cost.
The data also covers 121 Google ccTLDs and 18 mobile Google ccTLDs.
It is great for top-level reports across multiple domains using multiple data points (without hitting your project limit within SEMrush).
Use Case: ccTLD Migration to COM
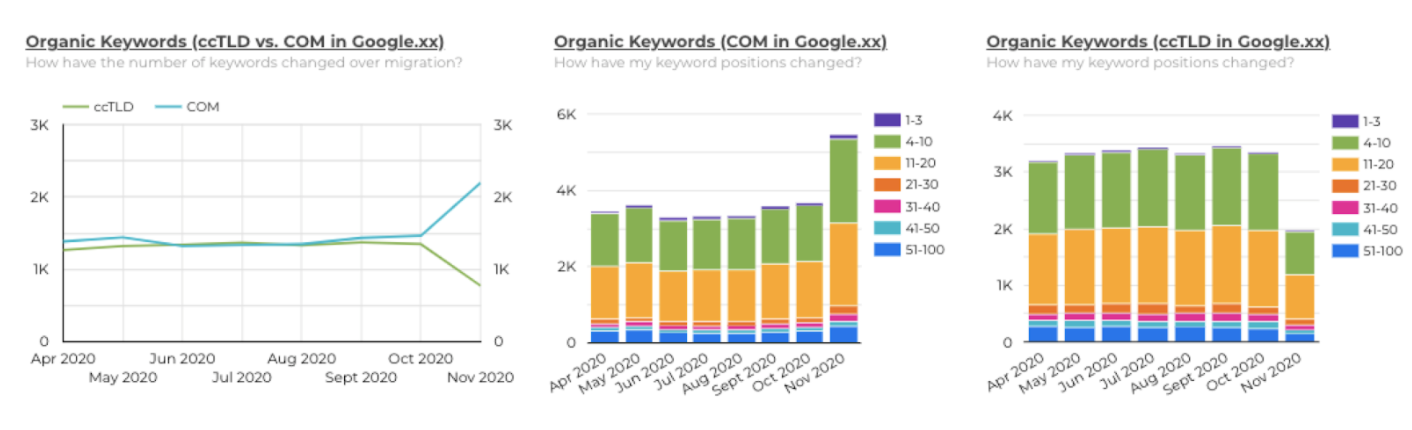
The screenshot below represents a migration that Wilsdon and his team carried out where they moved everything from the ccTLDs and aggregated them into a .com structure.
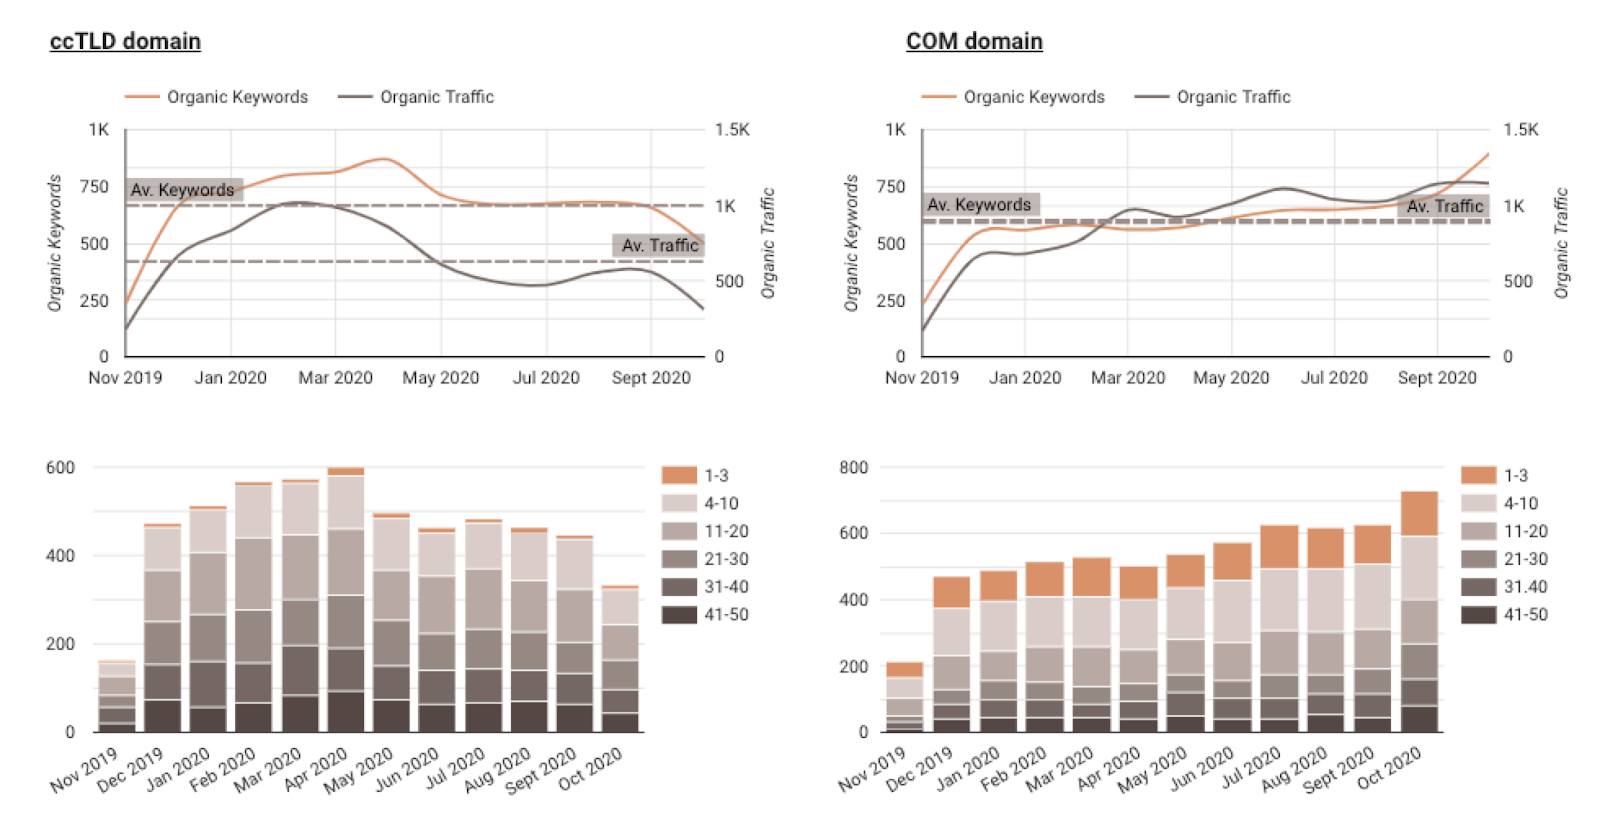
On the left, as they migrated away from the ccTLD, the average organic keywords and average traffic are declining.
And as they’d hope, the average organic keywords and average organic traffic are increasing on the .com.
More keywords also ranked in Position 1-3 when they switched to .com.
What they wanted to see in the end is a greater result for migrating that content.
How to Pull This Report
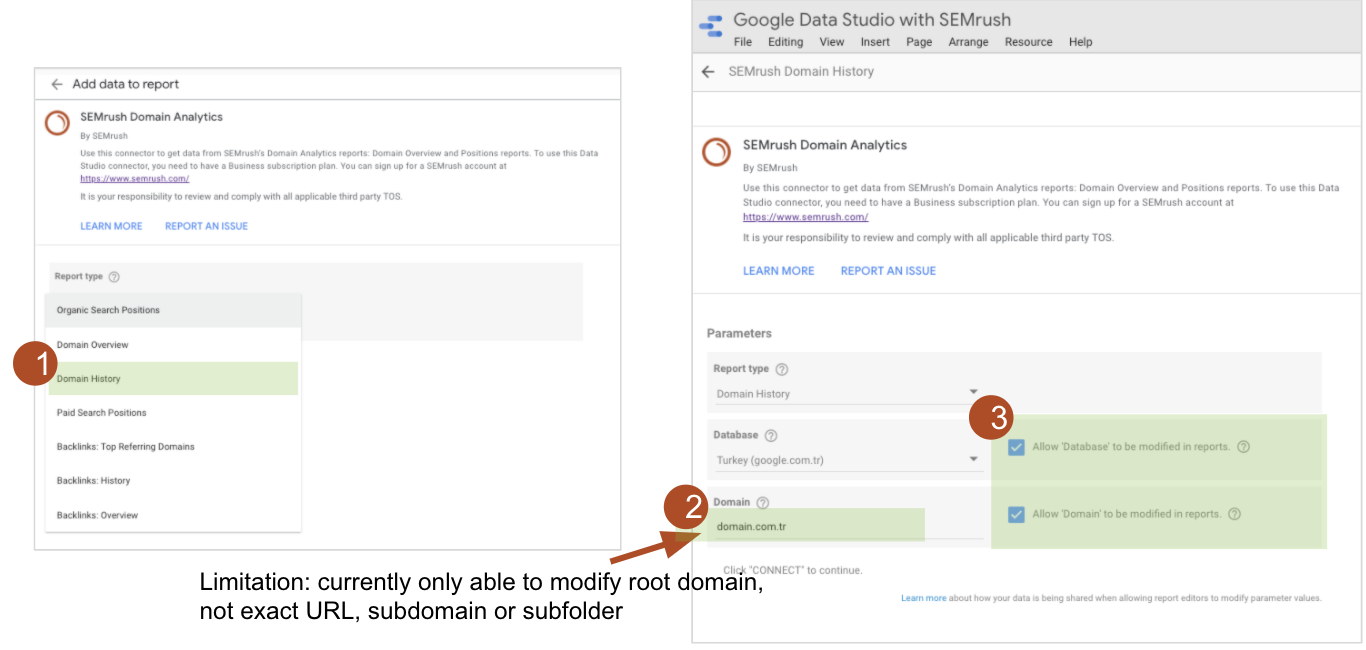
To pull this data:
- Use the SEMrush Domain Analytics connector.
- Choose Domain History as the report type.
- Under Parameters, enter your domain name. (Note that currently only able to modify root domain, not exact URL, subdomain, or subfolder.)
- Still under Parameters, check the boxes for allowing databases/ to be modified and reports.
Tip: If you ever get stuck, put your data into a table.
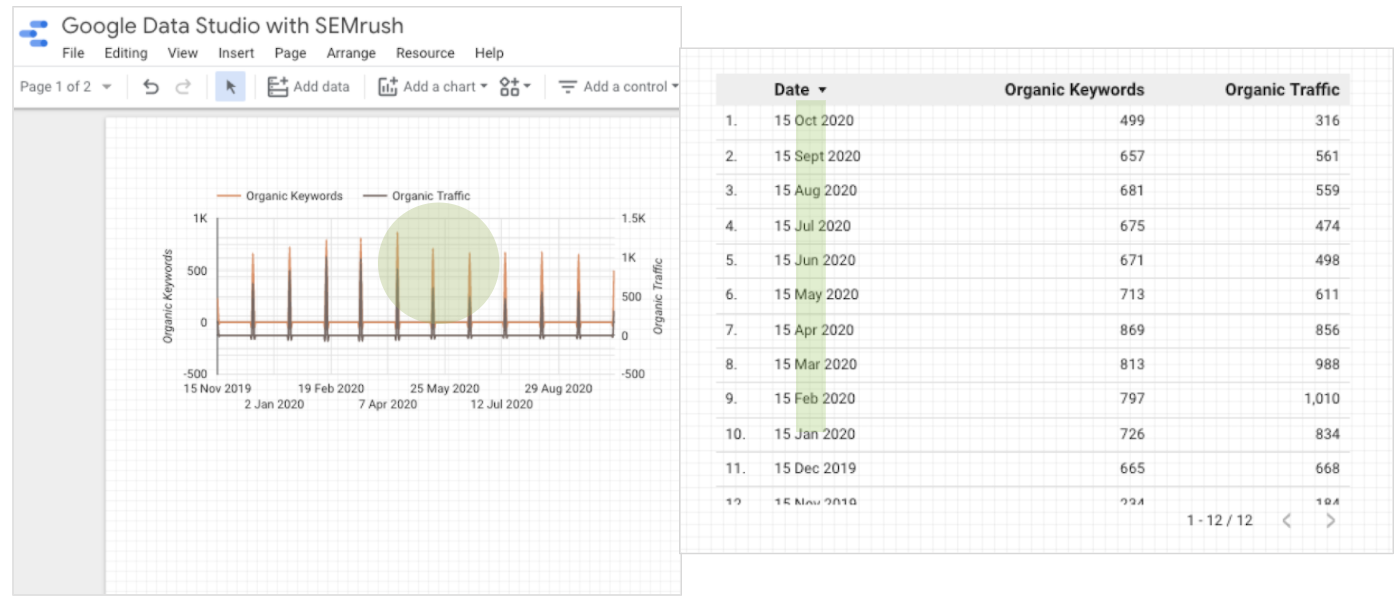
This indicates the solution is to use different date format but remember 15th <month> for later.
You can use the following data options:
- Select absolute date format (Year Month).
- Choose organic keywords and traffic metrics.
- Date (varies by data set).
- We can select parameters for each chart.
And some style options:
- Set axis for left / right.
- Optional: reference lines using averages
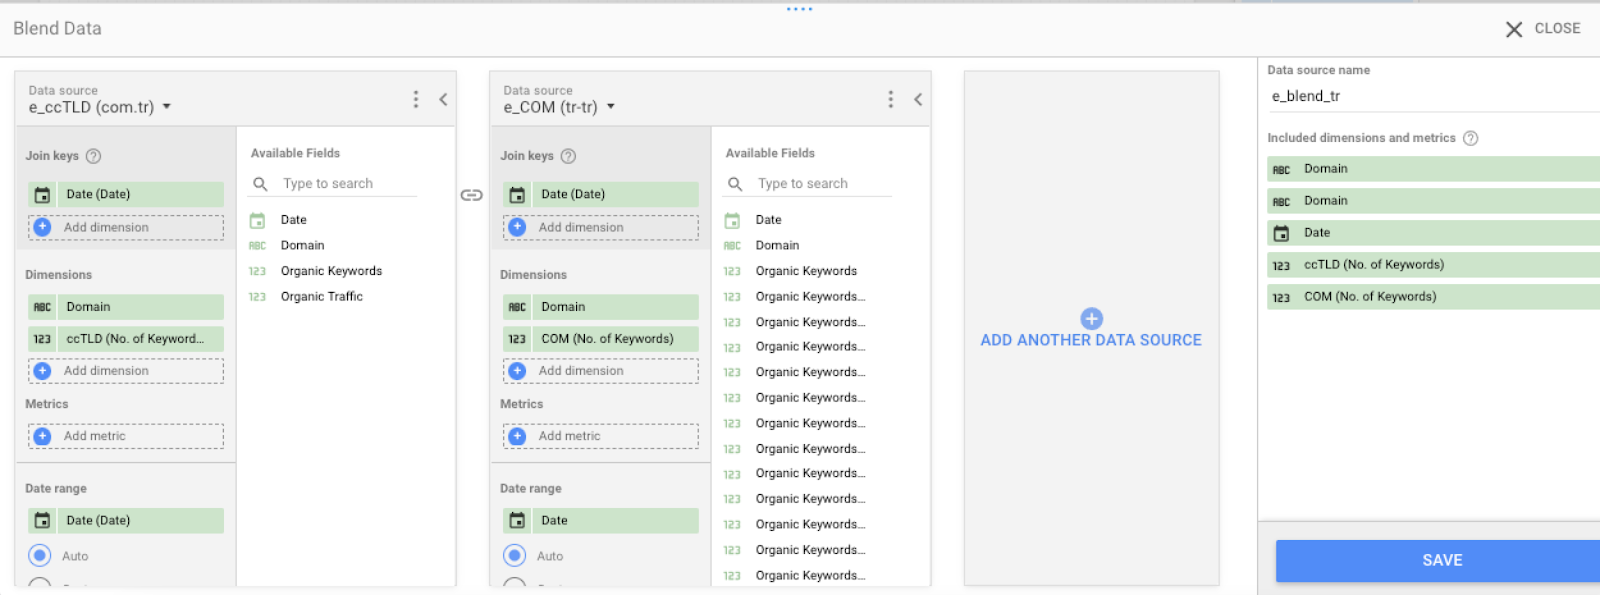
Upgrade with Blended Charts
By blending charts, you can create more powerful dashboards that allow you to view various data points.
You can also blend data and use unique names for shared dimensions (i.e., “Organic Keywords” or “Organic Traffic”).
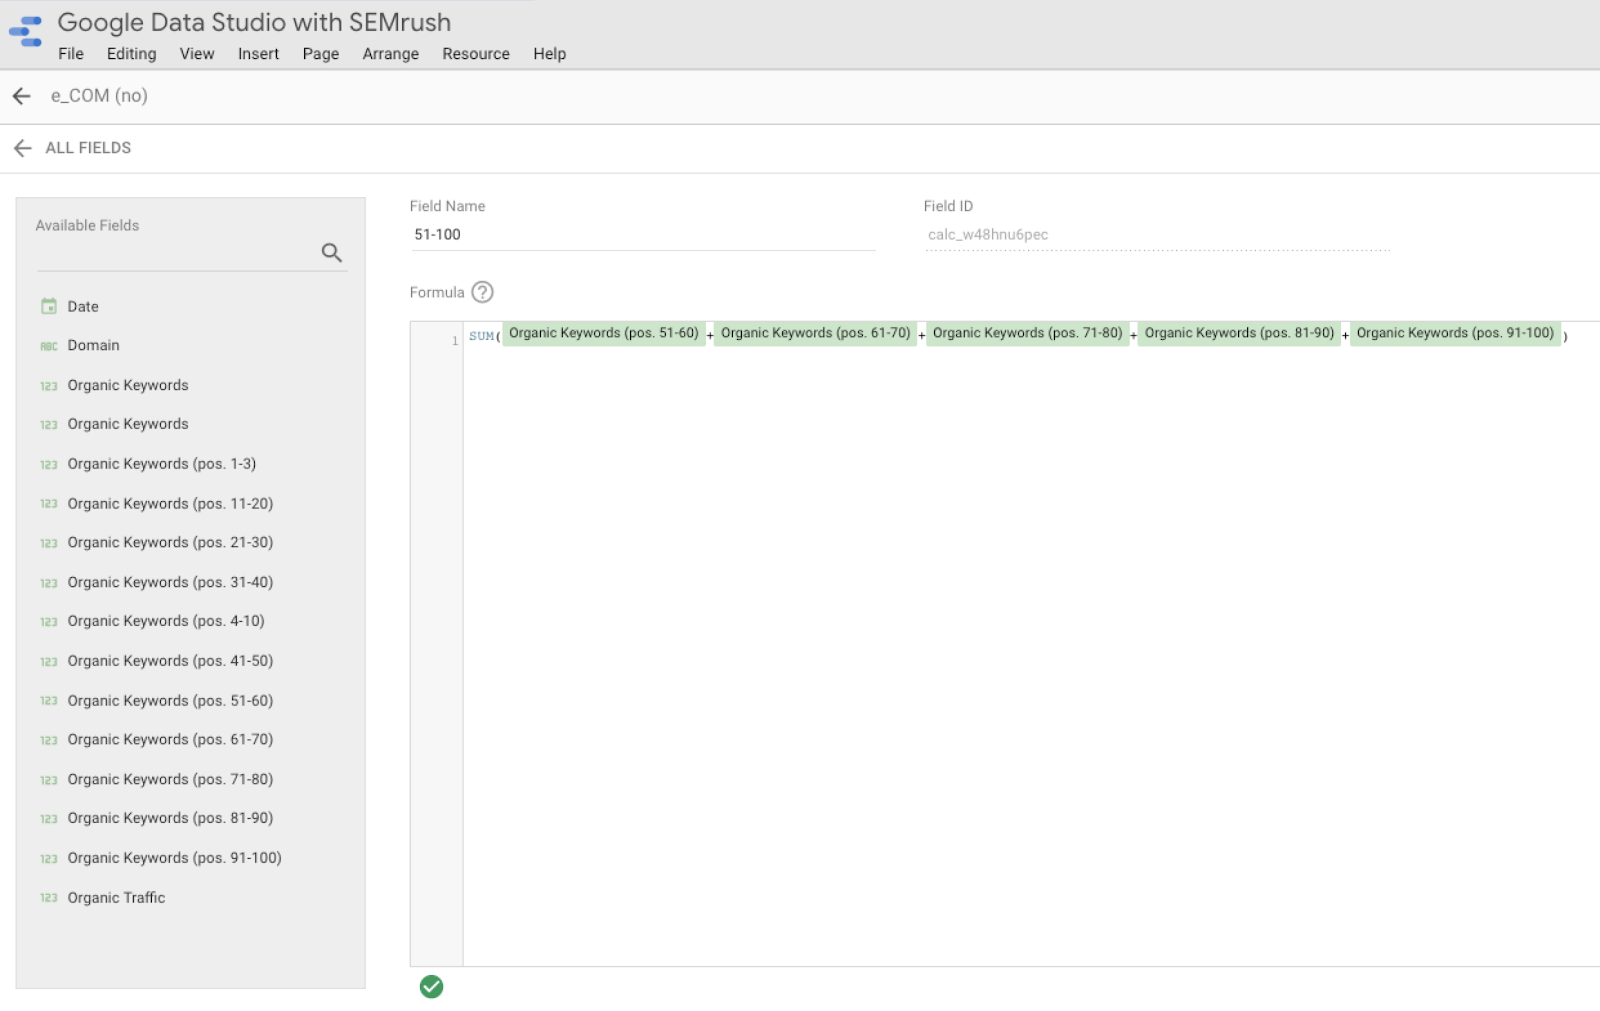
Wilsdon shares that it is easier to add/manage metrics in the Data Resources > Edit Connection screen.
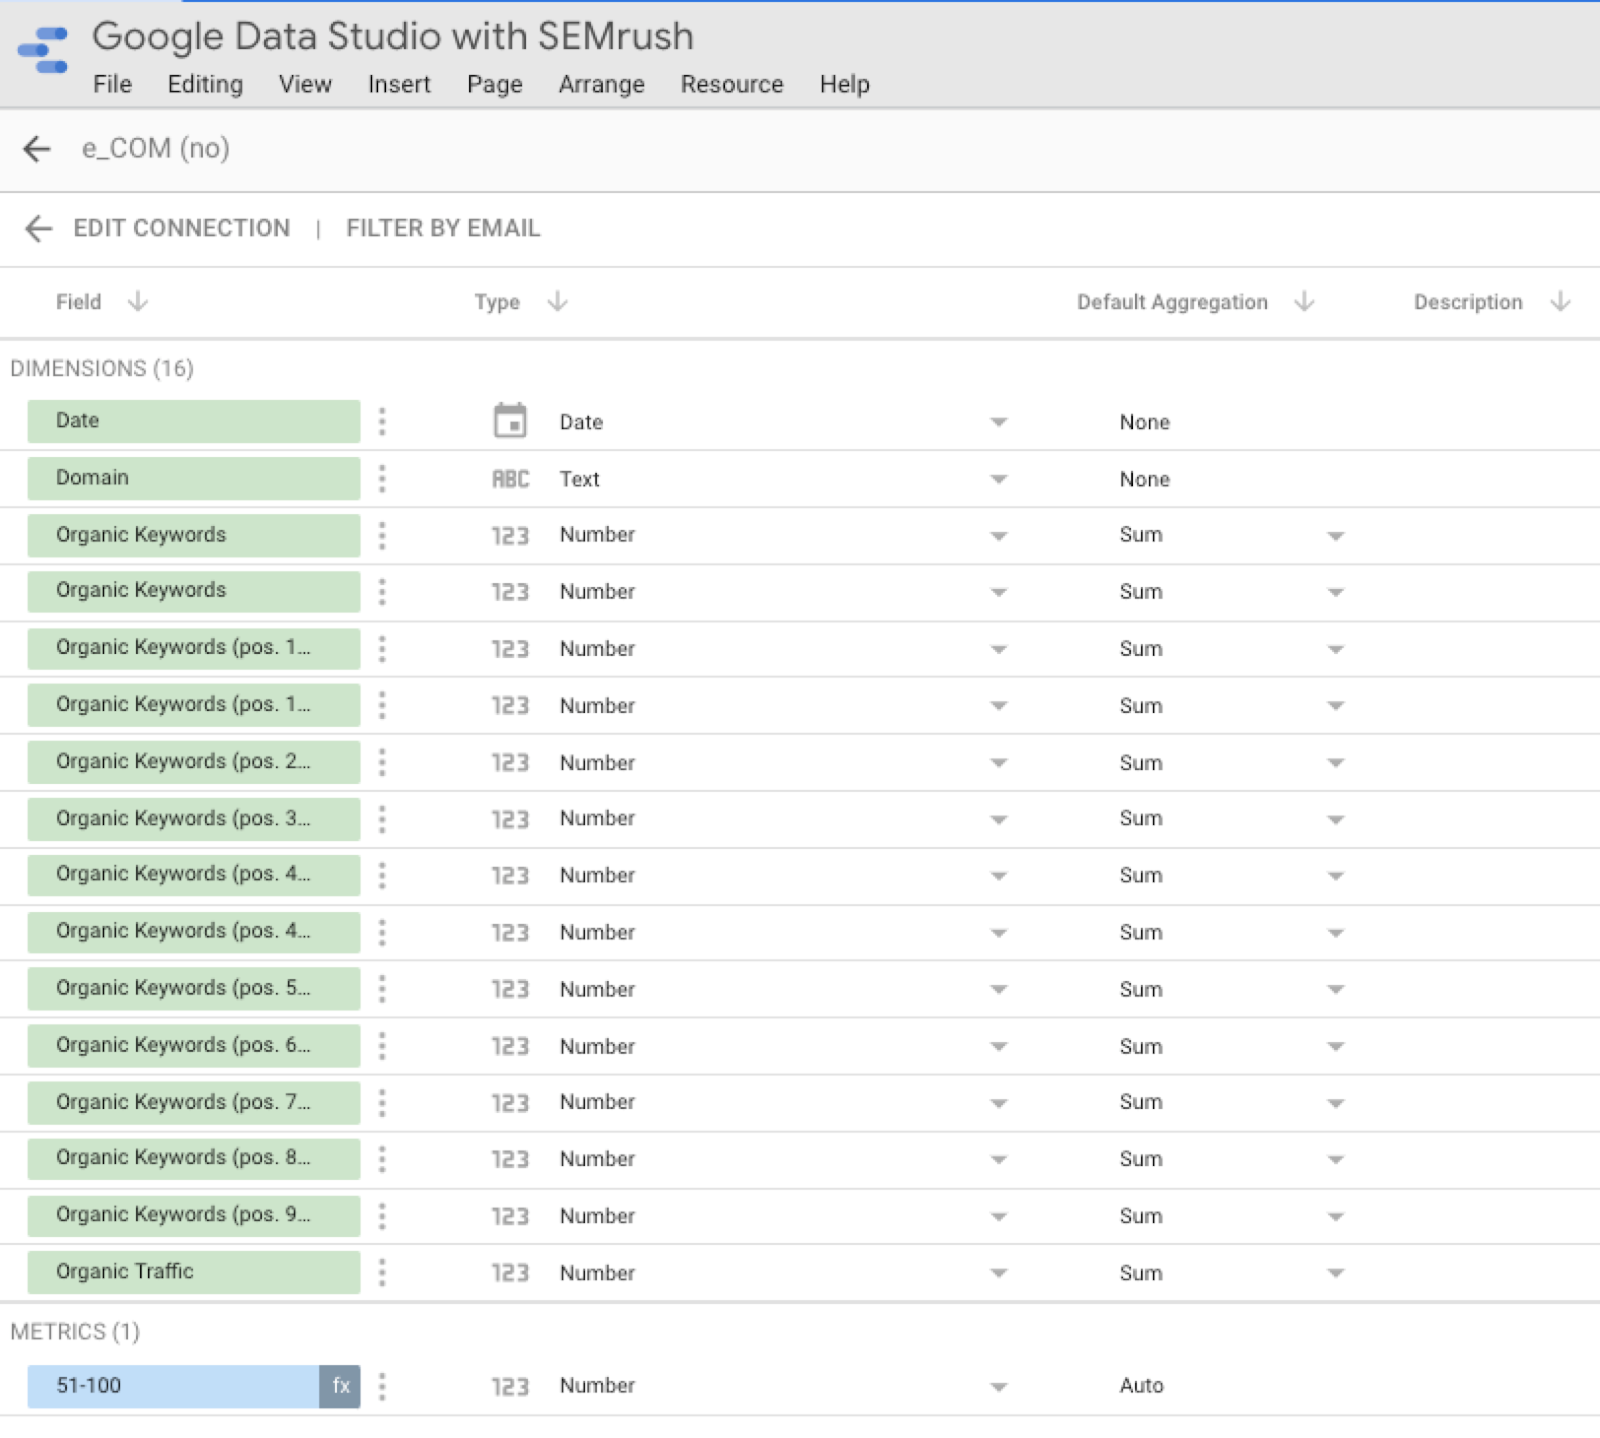
This is a basic calculated field to give you 51-100 positions in one block (simplify visualizations).
Tip: You can manually update Field IDs to connect graphs together.
Improve Dashboard Performance
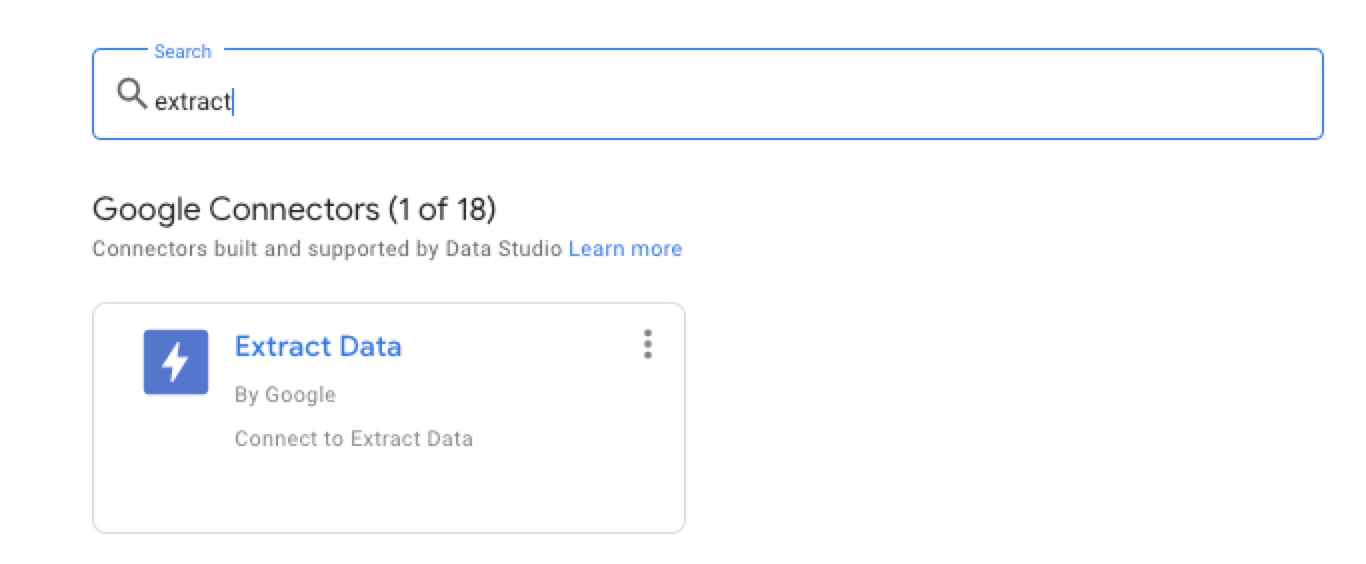
By using the SEMrush Data Studio Connector in conjunction with the GDS Extract Data feature, you can improve the performance of your reports.
Data extract lets you explore a subset of your data.
It can also:
- Store up to 100MB of data.
- Enable flexibility with aggregated data.
- Be used for data with monthly updates.
- Allow you to optimize your API usage and fees.
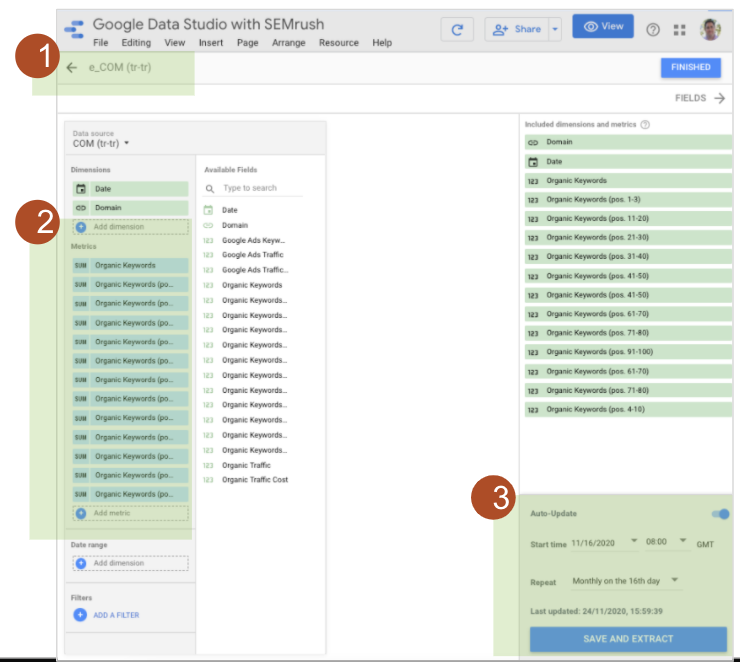
How to Use Extract Data

- Set naming convention.
- Pull in all dimensions, metrics, etc. required.
- Set auto-update dates and note last updated timestamp. (Tip: Save and extract when making any changes.)
[Slides] How to Get More from Google Data Studio with SEMrush
Check out the SlideShare below.
Join Us For Our Next Webinar!
The Data Reveals: What It Takes To Win In AI Search
Register now to learn how to stay away from modern SEO strategies that don’t work.
