

The Observatory on Social Media at Indiana University has released three new Twitter tools that allow users to examine information spread on the app social media more closely.
Those looking to analyze how information moves through Twitter and how topics go viral now have the tools to do just that.
Visualizing Information Spread On Twitter
Created by the Observatory on Social Media or OSoMe at Indiana University, the collection includes three freely available tools that comprehensively examine the conversations, players, messages, and polarization in online discussions around tweets and hashtags.
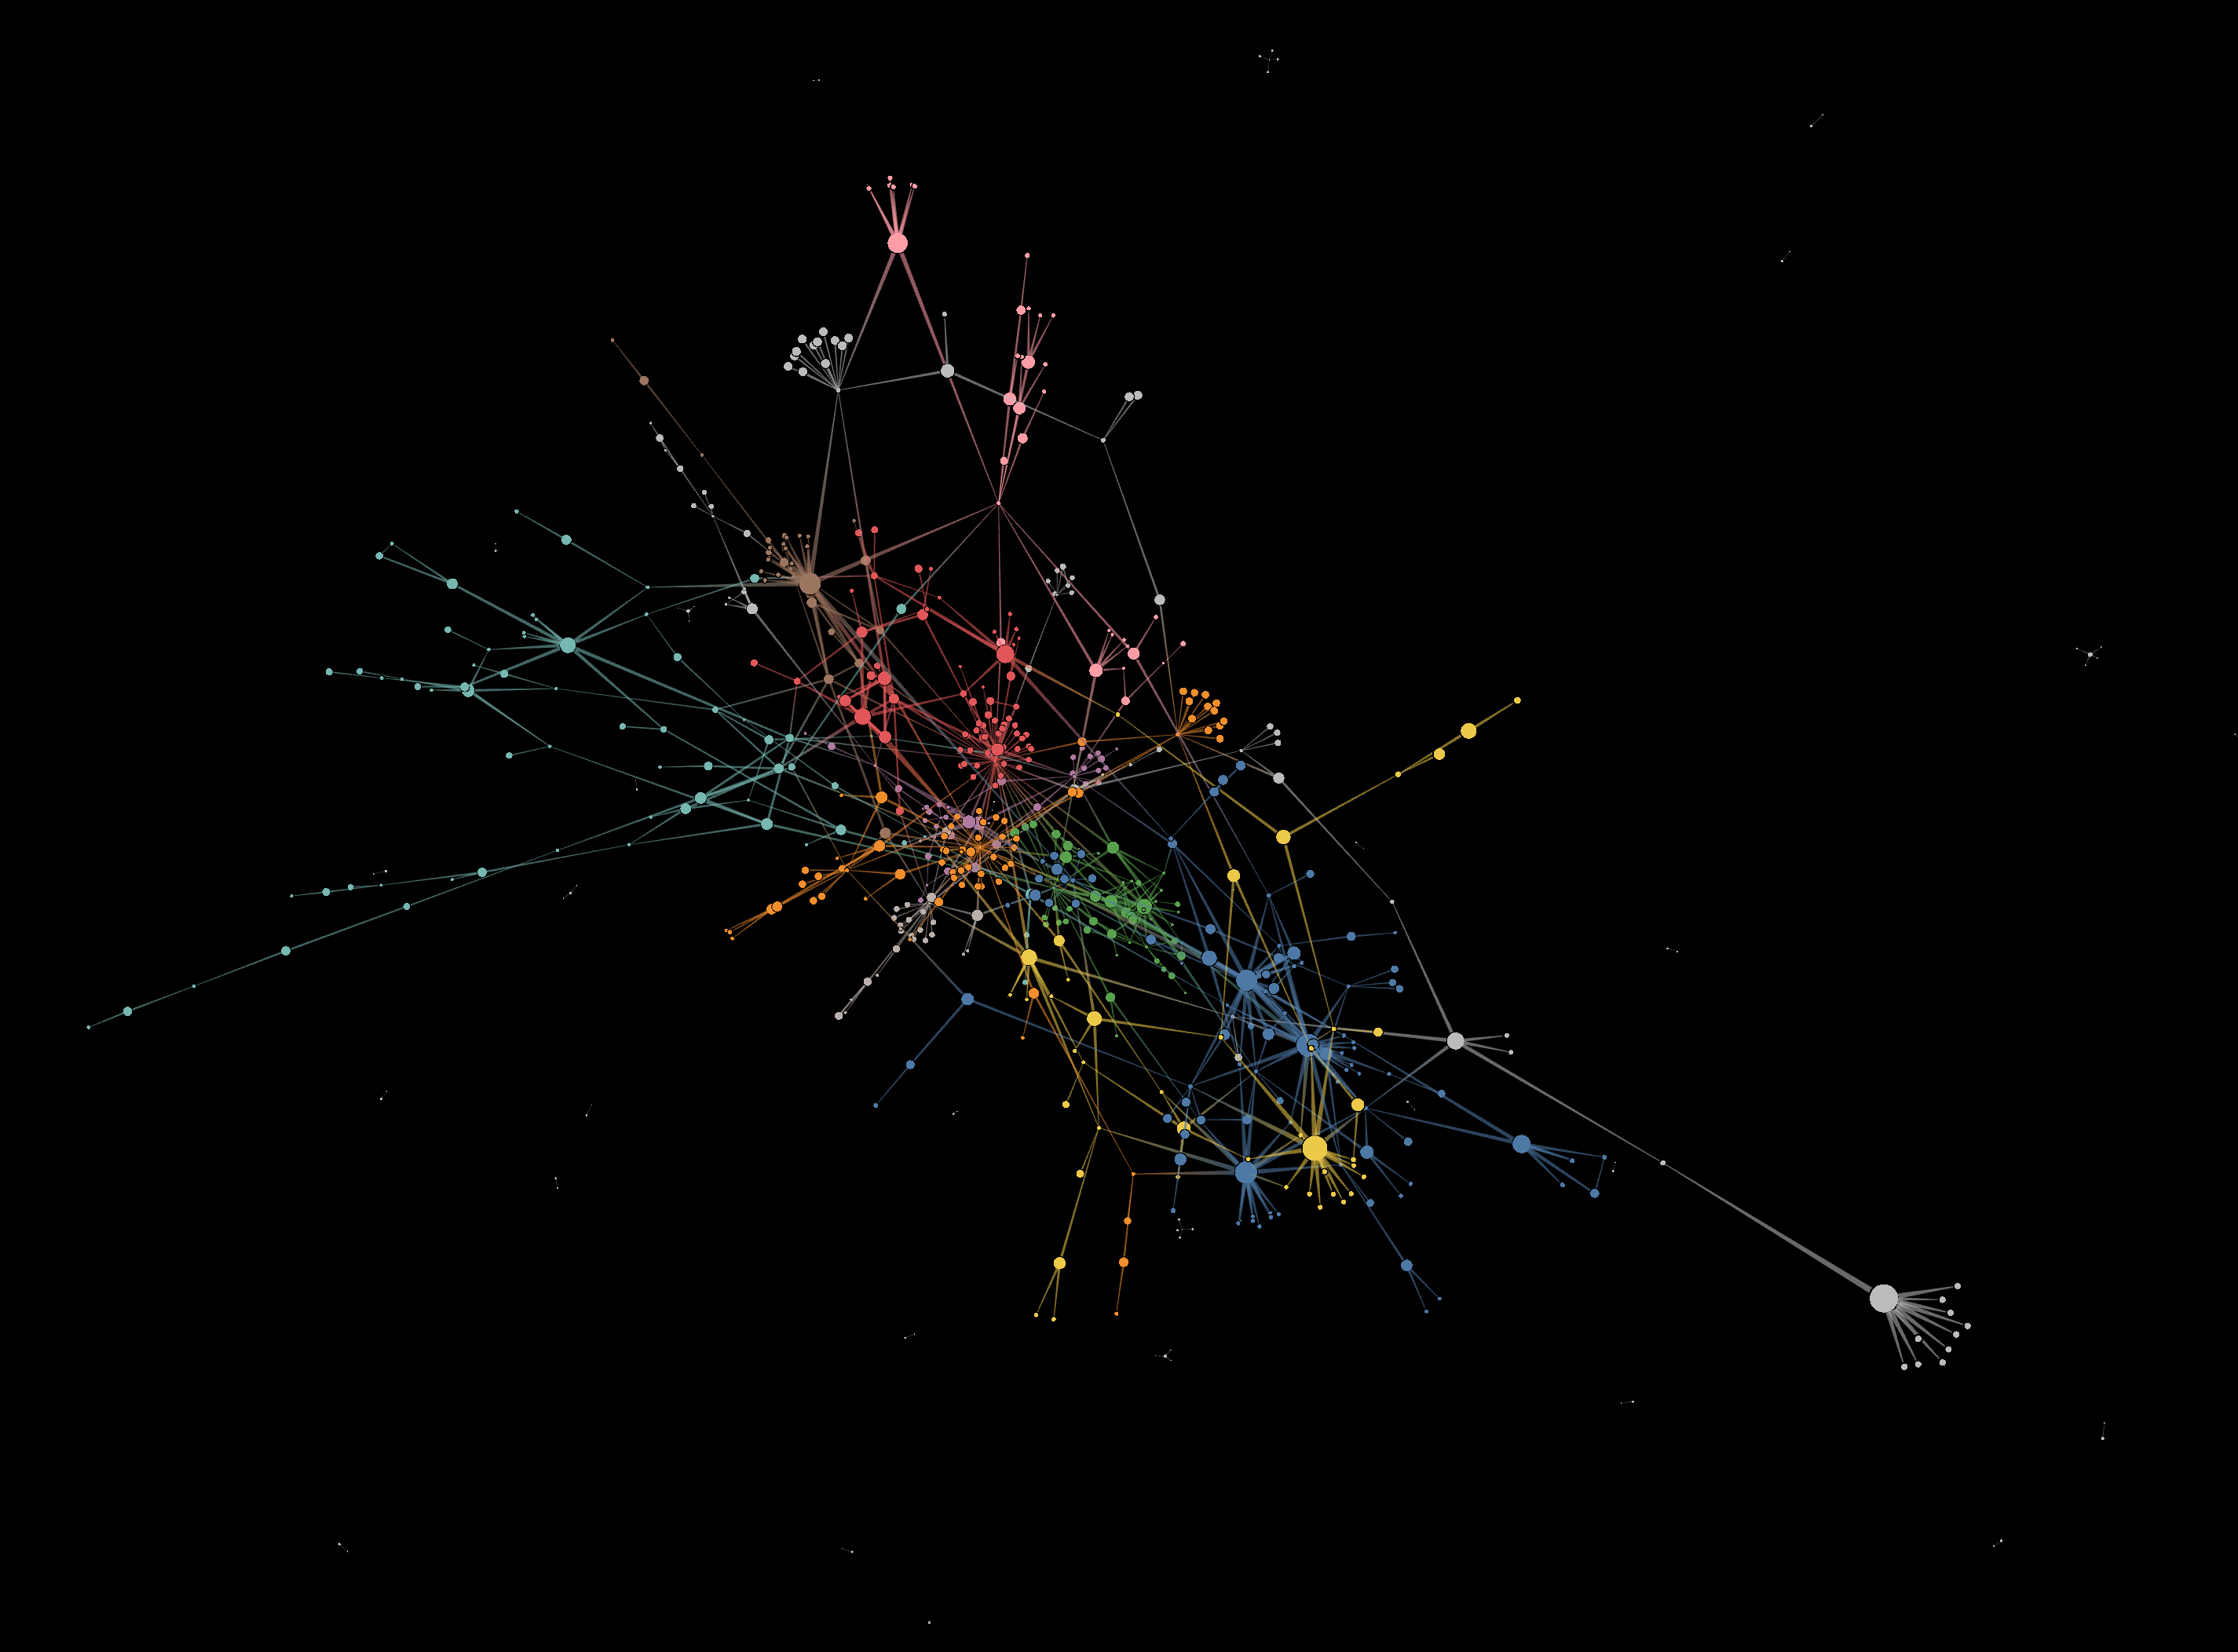
- Networks Tool – Creates 3D maps of information networks that visualize retweets, mentions, relations between hashtags, and other data.
- Trends Tool – Analyzes tweet volume within a given hashtag, URL, or keyword over time to identify trending topics, viral content, and specific topics like brands, products, or stocks.
- BotAmp Tool – Identify and measure bot activity for a specific keyword or hashtag and compare bot activity across topics.
“You often hear something is going viral, but how? Our tools show you what the conversation is, who the players are, what the viral messages are, and you can even visualize polarization. It provides a place for exploration of topics and how they work together,” said Filippo Menczer, director of OSoMe and Luddy Distinguished Professor of Computer Science and Informatics in the IU Luddy School of Informatics, Computing, and Engineering.
The tools collect approximately 10% of all public tweets, or 50 million per day, which are then indexed and analyzed. This information is stored for three years, allowing users to examine historical trends and data and create an accurate picture of trends and topics over time.
The three social media tools are free, along with other tools, APIs, and datasets on the OSoMe website.
A Deeper Look At Communication And Inauthentic Behavior Online
OSoMe is a joint project between the Network Science Institute, the Center for Complex Networks and Systems Research at the Luddy School of Informatics, Computing, and Engineering, and Indiana University’s Media School, specializing in the study of information, misinformation, and vulnerabilities that have risen with social media.
While this seems like a purely platform-specific problem, researchers have found that many of these tactics have real consequences in the offline world.
One example of these projects includes the manipulation of Twitter through deletions.
By examining more than a billion deletions from more than 11 million accounts, researchers found that a small number of bad actors will strategically delete large amounts of content to avoid tweet volume limits.
They also found networks of accounts coordinate to like and unlike content before deletion. This tactic artificially amplifies specific content and popularity while simultaneously avoiding detection.
Users, brands, and the media then latched onto these topics, expanding reach beyond the platform.
A New Generation Of Tools And Analysis For Brands And Publishers
Journalists, researchers, and users don’t have to find solutions to major social media issues to find the OSoMe tools valuable.
As competition increases, consumer habits change, and the noise level of the online world continues to rise, companies, marketers, and even non-profit organizations have to take deeper looks at the data they already have available.
Personas, for example, were once based on basic demographic information.
Now, deep dives into social networks allow marketers to understand:
- Language patterns
- Pain points
- Customer education opportunities
- Content and branding gaps
- Keyword use and intent
- Target market and segments
- Advertising and marketing gaps
- Profitable partnerships
And this is just the start. Marketers can significantly expand their current data insights and research by analyzing information networks, keyword use, and hashtags on Twitter.
However, there is one important caveat: As tools provide a more in-depth look at the systems the digital world relies on, marketers, brands, journalists, and others will need to be cautious about the data interpretations and assumptions they make.
Featured Image: Andrii Yalanskyi/Shutterstock
