

Taking time to understand your customers’ buying journeys can help you make smarter marketing decisions. One mistake I encounter regularly is marketers failing to look any deeper than the revenue report within the e-commerce overview in Google Analytics, which reports on direct (last-click) revenue by default.
This post will explain how to delve into Google Analytics Multi Channel Funnels to report on much more than last-click revenue, including how to identify top conversion paths, analyze conversion path lengths, and report on assisted conversions.
Top Conversion Paths
Reviewing the Top Conversion Paths report is a great way of identifying your most popular referral paths and how many times users interact with each channel before converting on your site. I’ve found it’s a great report to show to clients or to enable decision making as it displays just how complex a conversion process can be.
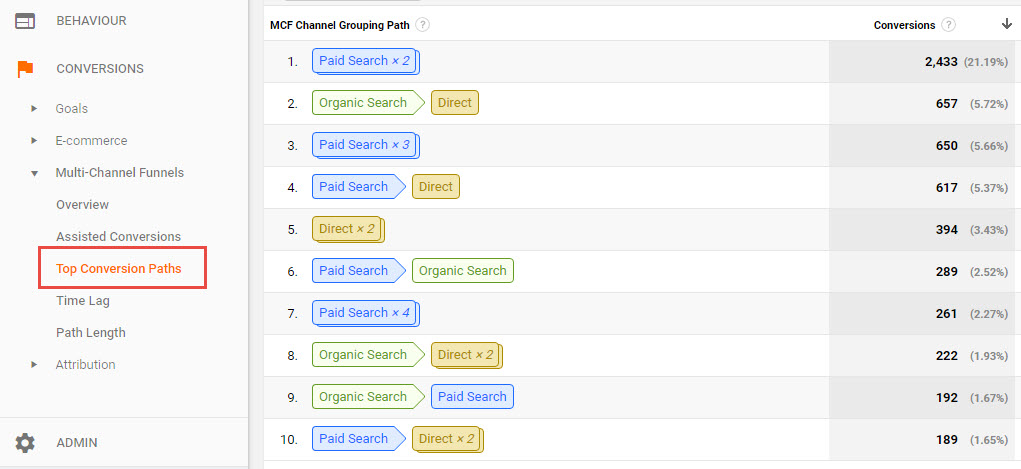
This report shows every unique conversion path as well as the number of conversions from each path, and the value of those conversions (if using e-commerce tracking).
The image below is taken from the top conversion paths report of Google Analytics, and in this example, you can see that the most common path to conversion was not one, but two paid search referral visits.
In this example, the data could prove invaluable to PPC managers who could use remarketing lists to increase bids for users who have visited their site once via PPC, but not yet converted.
This data could also be used to help inform decisions around which attribution models should be used in Google AdWords. For example, if a conversion path typically showed paid search was acting in more of an assist role rather than acting as the ‘last-click’ before the majority of conversions, then advertisers could choose to set an alternative attribution model in AdWords.
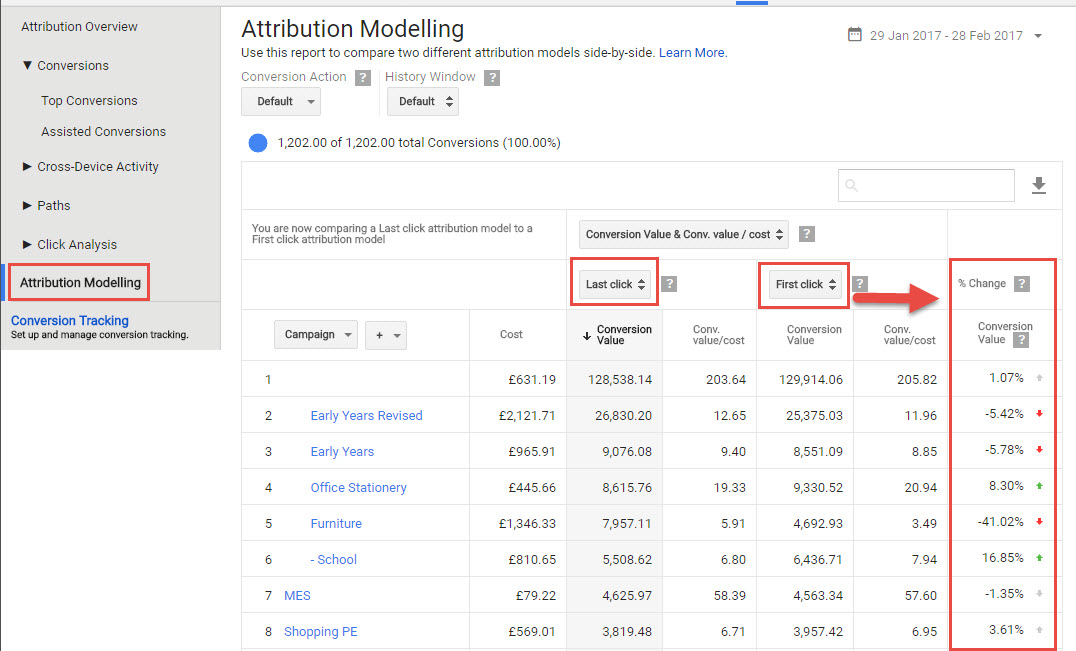
You can see how this would impact your conversion stats at Campaign, Ad group or Keyword level by previewing different attribution models in Google AdWords via tools > attribution > attribution modelling:
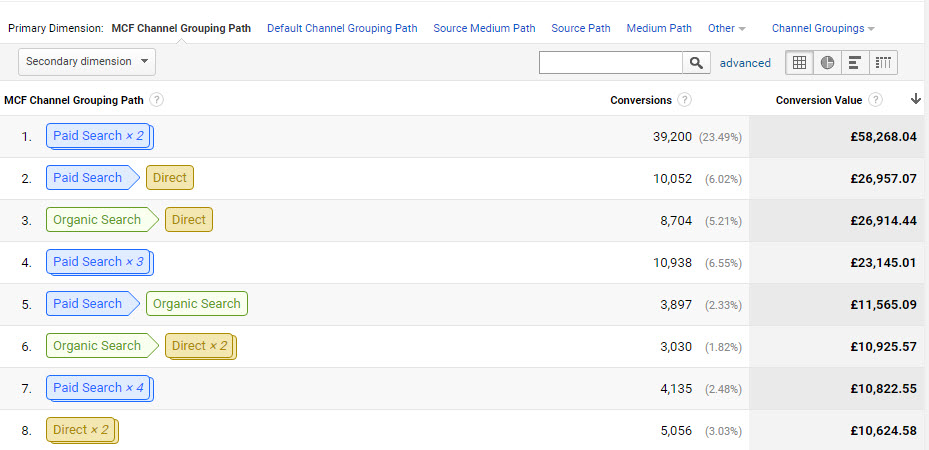
Back in Google Analytics, you can take the top conversion paths report a step further by using filters and secondary dimensions to view paths related to any traffic channel.
Adding Secondary Dimensions as Filters
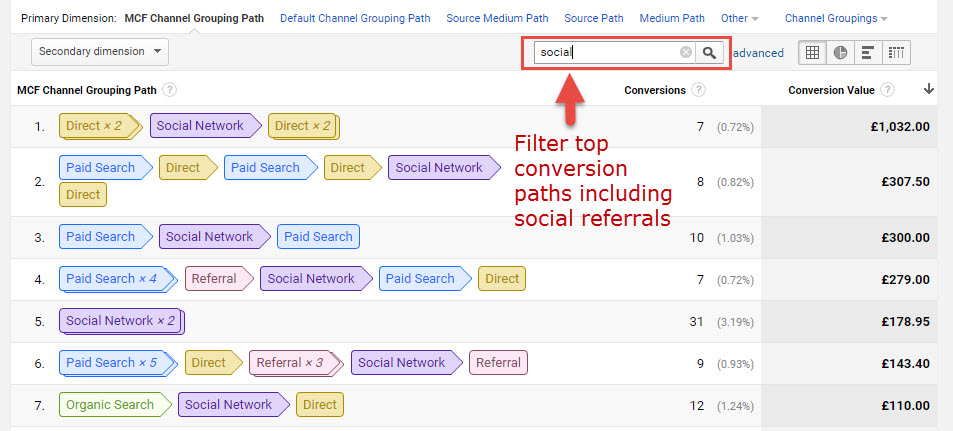
To filter out specific paths you can use basic filters. For example, if you wanted to filter out only conversion paths that included visits referred via social media you could do this using the filter box above the report table:
You can use then use advanced filters to display specific secondary dimension information, but firstly I would advise adding a secondary dimension for ‘source path’ to your report:
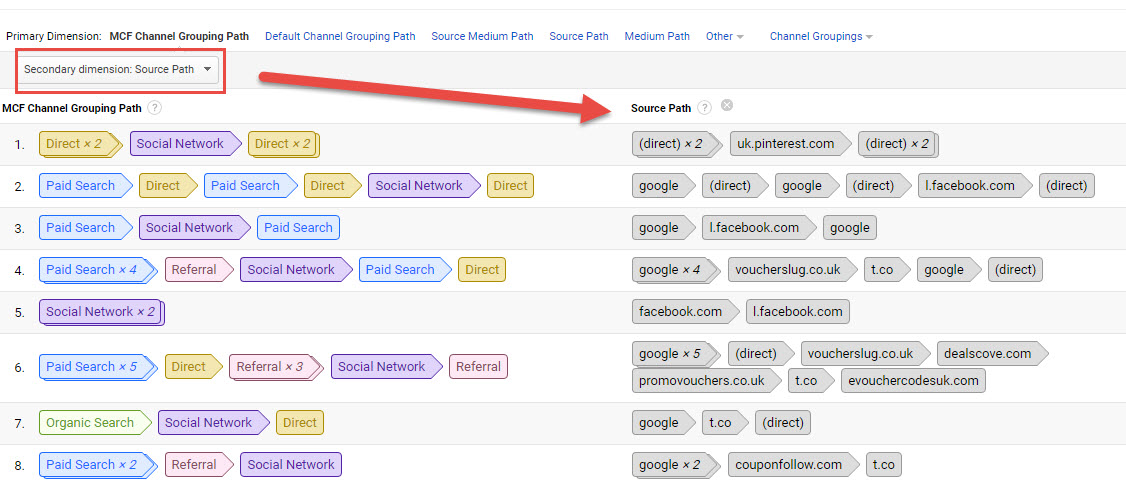
Adding ‘source path’ as a secondary dimension will allow you to see the actual websites which have resulted in the referral visits. If you then wanted to view conversion paths related to a specific website, e.g. Facebook, you’d need to use the advanced filter function.
To do this, click edit next to the advanced filter search box and create an advanced search that looks like this:
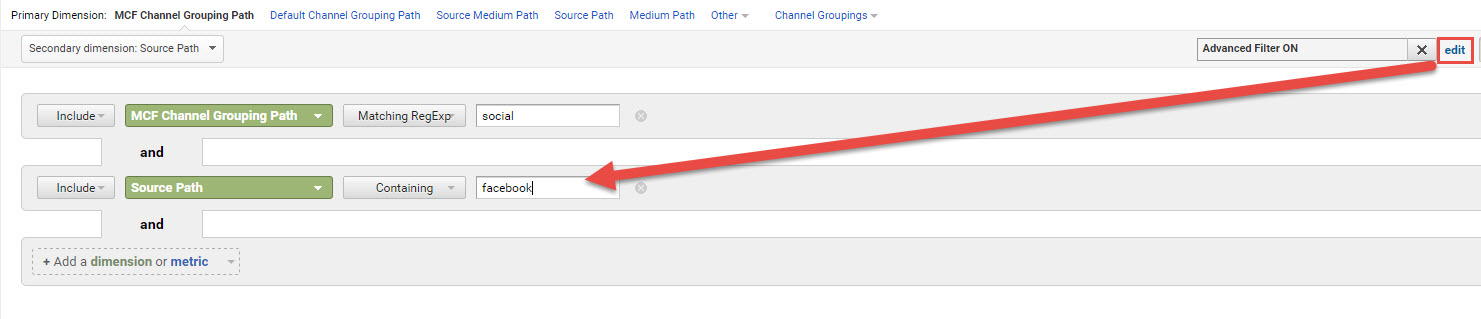
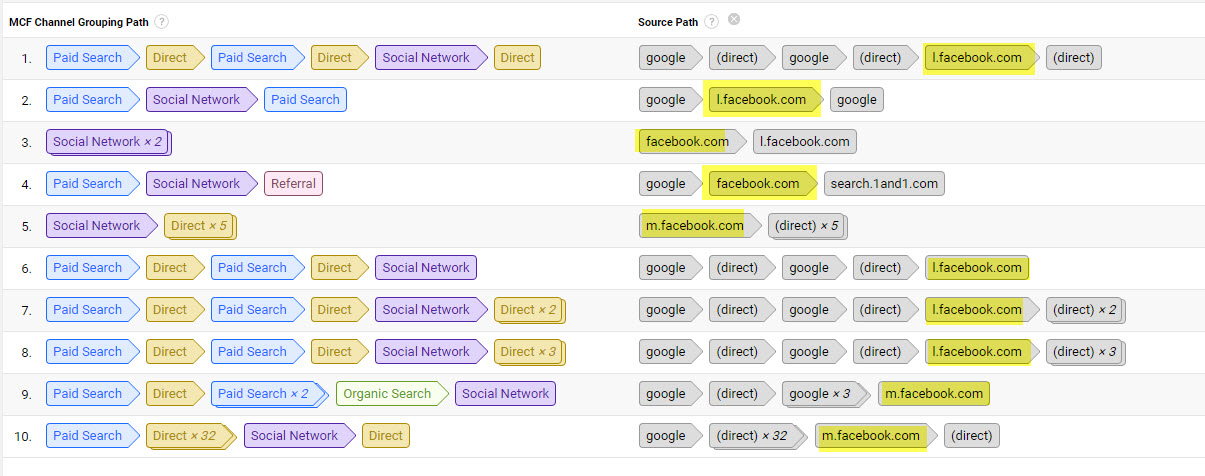
Applying this filter will display only conversion paths that have contained Facebook referral visits, which will enable social media marketers to gain a better understanding of where Facebook fits within the most common conversion paths:
You can repeat the steps above and use advanced filters to display top conversion paths which include specific paid search engines, email campaigns, and more.
Time Lag
The Time Lag report provides information on how long your users may be taking to convert after first visiting your website.
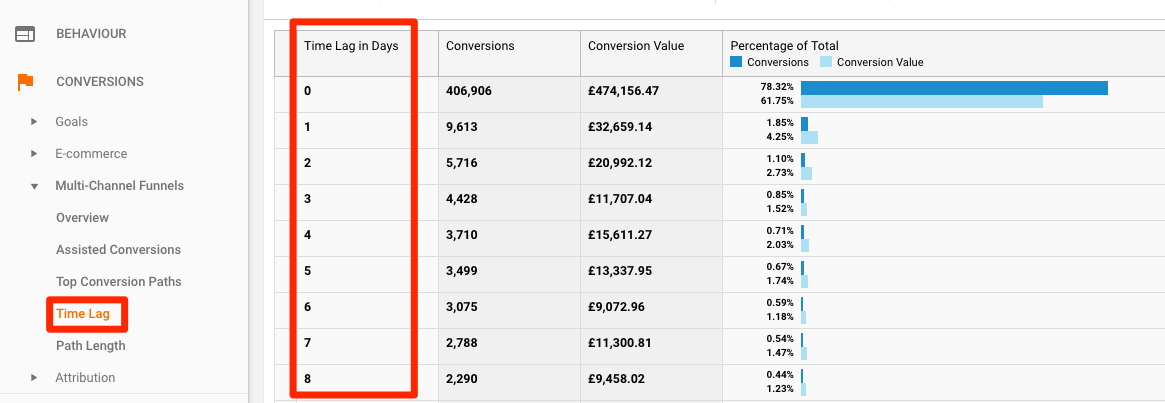
The time lag report shows you an ordered list (most to least conversions) of how many conversions resulted from conversion paths that were 0, 1, 2, 3, 4, 5, 6, 7, 8, 9, 10, 11, or 12+ days long, which will aid in understanding the average length of your online sales cycle.
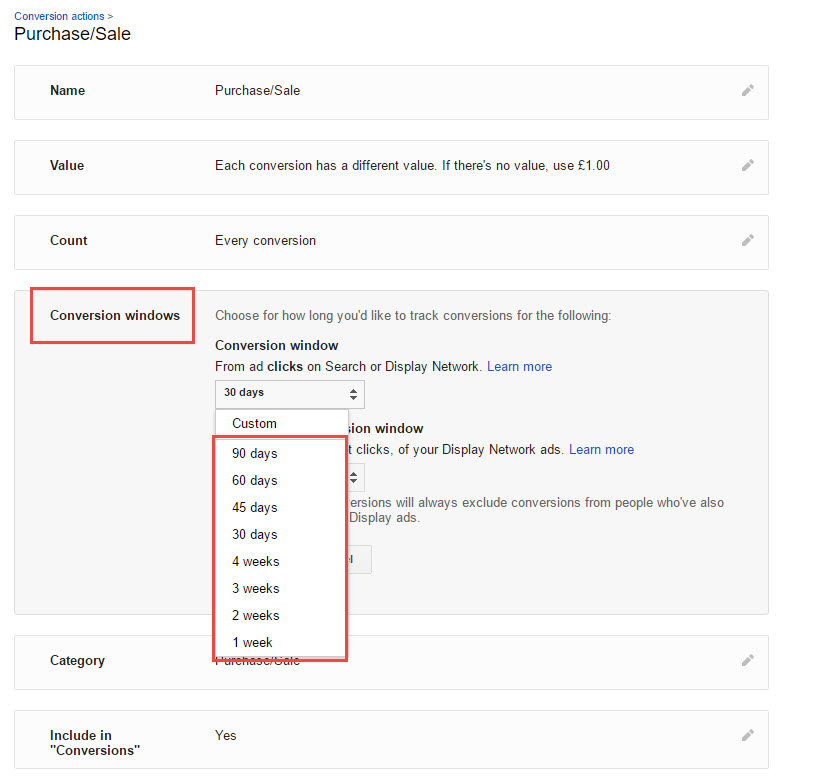
Understanding how long it typically takes your customers to convert after first landing on your website can help determine if your conversion window is set up appropriately in AdWords.
For example, if you noticed that the majority of conversions were taking place 30+ days after users initially landed on your website in the time lag report, you’d probably want to ensure that your conversion history tracks 60 or 90 days worth of data rather than the default setting of 30 days in Google AdWords.
You can edit these settings in AdWords, under “Tools > Attribution”:
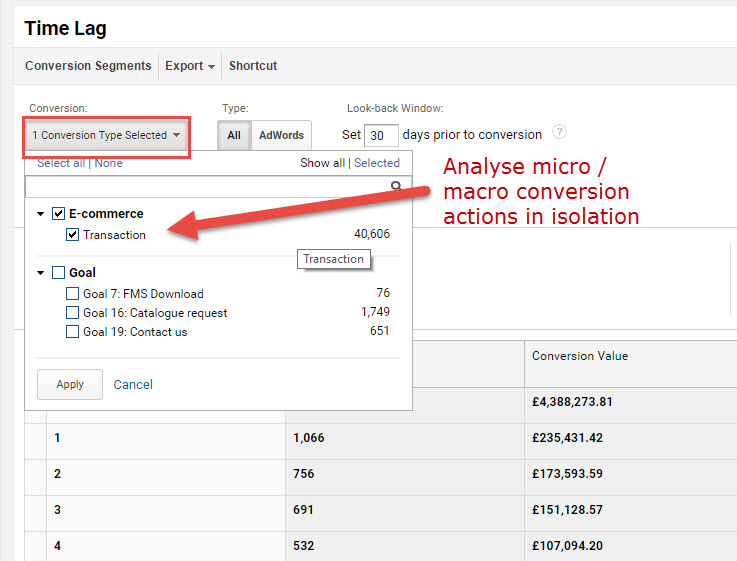
If you are tracking more than one type of conversion action, for example, newsletter sign ups and transactions, you should review each conversion action independently in the time lag report.
Micro conversions such as newsletter sign-ups will have a much shorter time lag than macro conversions such as online transactions so it’s essential to view them in isolation to ensure you have an accurate view of the data being reported:
Path Length
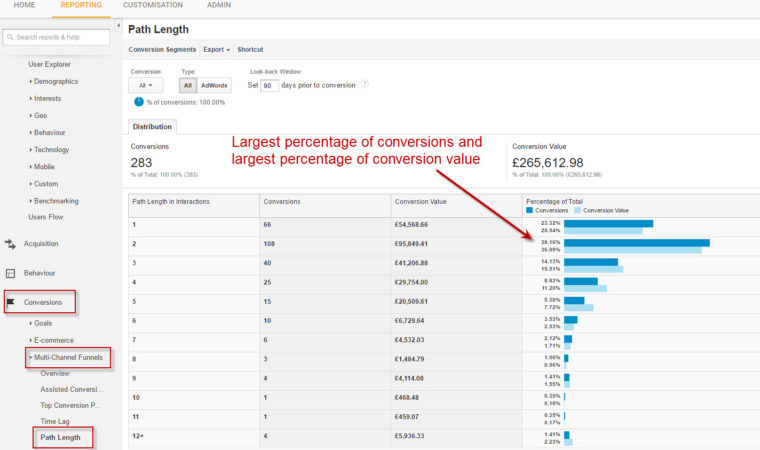
The Path Length report shows how many conversions resulted from conversion paths that contained 1, 2, 3, 4, 5, 6, 7, 8, 9, 10, 11, or 12+ referrals before converting, and reports on which visit the majority of users converted.
This data can be extremely useful for advertisers. For example, a retailer might find that their most profitable website visitors visit their site twice before making a purchase:
Pro Tip: Use Path Length Data to Create a Remarketing List
I have previously explained how to use time lag data to build remarketing lists to boost PPC performance. In the example above, a list could be used to increase bids for users who have visited the site only once previously but not yet made a purchase.
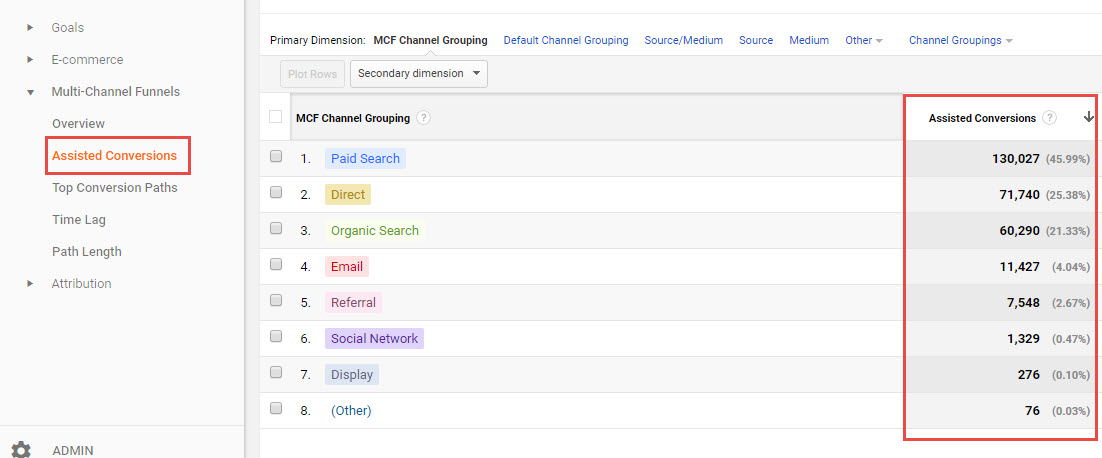
Assisted Conversions
Assisted conversions refer to the number of times a channel appeared on a conversion path but was not the final conversion interaction.
One of the most useful metrics I refer to in this report is the Assisted vs. Last Click conversion figure. A value close to zero indicates that a channel has been functioning primarily as the final conversion interaction, whereas a value closer to one indicates that a channel functioned equally between assisting and the final conversion interaction. If the value exceeds 1, the more the channel has functioned in an assist role.
For example, you can see on the screen grab below that email has acted primarily in an assist role, whereas PPC has functioned primarily as the final interaction before conversion.

The assisted conversions report in Google Analytics typically breaks this down by channel, but this can be further explored by using secondary dimensions and advanced filters.
For example, you could add advanced filters to display only traffic from a specific social network in order to view how often the network has played an assist role in website conversions:

The example above could be used to prove the value of LinkedIn in assisting conversions, as the network has acted in assist role more times than it has in delivering last-click conversions.
Conclusion
Looking purely at last-click data is never going to give you the full story when it comes to attributing conversions.
To give a real world example, if one person commuted to the office by car, two took the bus, and another cycled to the office, but all four took the elevator before entering the building — the elevator would get 100% of the credit for the journey using the last-click model. This is why it’s so important to utilize the Multi-Channel Funnels reports in analytics and apply relevant attribution models to different types of conversion action.
I challenge you to remember the last time you ever clicked an ad and bought a product on the first visit to a website. Most purchases are the result of several interactions, so it’s essential that marketers understand how to analyze these interactions within Google Analytics.
Image Credits
Featured Image: Pexels
Screenshots by Ben Wood. Taken March 2017.
