

Ad testing can be a time-consuming part of the PPC optimization process so it’s an ideal area to address with a Google Ads script.
In this post, I’m sharing a script that helps with the tedious task of preparing data about what historical ad texts have worked well and may be worth deploying in more ad groups.
The script splits all ads into their component parts like headlines and descriptions and totals up the metrics from across the account.
If the premise of this script sounds familiar, it’s because I’ve shared other iterations in the past but this one is different.
I first created this script for Optmyzr’s scripts library, and later shared a version of it called the Ad Component Report on Github.
So what’s different now and why is this latest version worth a look?
Well, I made a big change to the code that addresses a problem I’ve started hearing more about lately…
Why A/B Ad Testing Is Flawed
The problem with ad testing is that advertisers may believe it’s what’s in the ad that’s influencing performance.
But as Martin Roettgerding recently pointed out, an A/B ad test may not be reliable because the difference in text between ad variations is merely one of the many variable elements of an experiment.
The other thing that’s changing is the auctions in which the ad is being shown. And in different auctions, the users are different, the time of day is different, the device is different, and so on.
In fact, there are so many variables in play that it’s not fair to point at ad text differences as the definite reason why A/B ad tests produce winners and losers.

Mike Rhodes, founder of AgencySavvy, recenty told me a story about a surprising ad test he ran. Rather than doing an A/B test with two variations of an ad, he ran an A/A test where two ads contained exactly the same text.
Logic would dictate that there should have been no winner and loser in this test, however, he found that ad A won and ad A lost.
The exact same ad both won and lost the experiment!
There couldn’t be a more clear illustration to highlight that there’s more than just the ad text that influences how tests go.
Segment Ad Data for Proper Experiments
The way to solve this problem is to remove as many of the variables as possible when analyzing ad performance data.
By analyzing ads from one ad group at a time, and even one exact match keyword at a time, you remove some of the variability related to differences in queries.
By adding segments for devices, days of week, and ad slot, you can start to really get down to unique scenarios where you have as close as possible to an apples-to-apples comparison of the performance of different ad texts.
When different ads are shown in scenarios that closely resemble one another, you can start to point to the ads as the main driver of differences in performance.
Data Sparsity When Segmenting Ads Data
The more we segment the data, the more granular the data becomes and the harder it is to find a statistically significant winner.
You can try one of the many statistical significance calculators available online (like this one) to see how a decrease in metrics makes it harder to find a meaningful winner.
Trading Off Volume & Similarity of Data
So we have to make tradeoffs and decide how to balance having enough data with having it come from similar auctions. This is where the script comes in.
Previous iterations of it ignored segments. While it would have lots of data for metrics, that data came from every possible scenario where the ad ran.
In other words, in the trade-off I described, it favored lots of data over getting data from similar scenarios.
The new version of the script lets you choose what segment to add so that you can remove a variable like device, position on page, and day of week for your analysis.
If you use this script, you can get more data by looking across many campaigns while restricting the data to a chosen segment. Now with the output of the script, it’s possible to run some interesting comparisons.
How to Use the Segmented Ad Component Report
Here’s an example of how to use the report that the script generates.
Say that you find there is a big difference in ad headline performance on mobile and desktop devices. That could be a signal that it may be worth the effort to split up campaigns so that you can run different ones for different devices.
You could use device bid adjustments, but that doesn’t afford you much flexibility when it comes to varying the message you show to different users depending on their device.
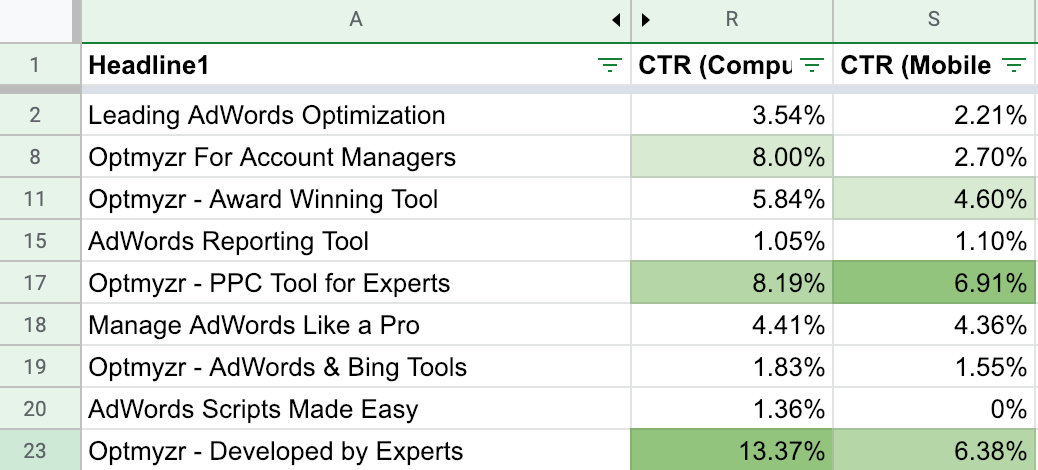
When looking at differences in performance, focus primarily on ratio metrics like CTR and conversion rate.
There may be big differences in impression levels but that can be due to the fact that a different volume of searches happen on different devices or that Google is already doing a great job showing the right ads depending on the user’s device.
What matters more is that the ratio of clicks over impressions (CTR) is as high as possible regardless of the device.
Again, Google may already be doing a good job showing the ad variant with the higher likelihood of getting a good CTR on each device but if you find that there are winners for different devices, it could be time to mix things up with segmented campaigns.
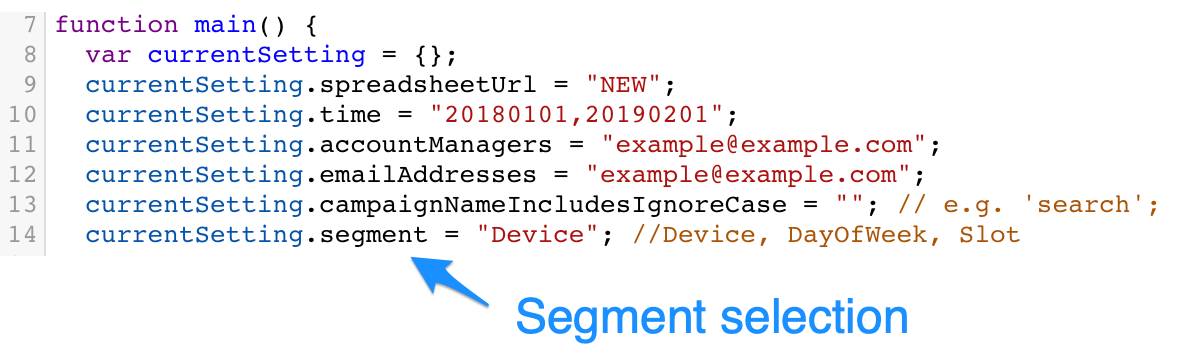
The Script
This script has a handful of configurations:
currentSetting.spreadsheetUrl
Use this to enter the URL of the Google Sheet that should receive the data. Or add the text “NEW” to generate a new spreadsheet automatically every time the script runs.
currentSetting.time
Enter the date range for the data, e.g. “LAST_30_DAYS”, “LAST_MONTH”, “20180101,20181231”
currentSetting.accountManagers
A comma-separated list of Google usernames of all the people who should have permission to work with the report in Google Sheets.
currentSetting.emailAddresses
A comma-separated list of email addresses who should get an email when a new report is ready.
currentSetting.campaignNameIncludesIgnoreCase
Enter a string of text that should be present in the campaign names whose data should be included in the report.
currentSetting.segment
This is the new setting that tells the script what additional columns of data to add for different segments.
Choose from any segment that is available for the AD_PERFORMANCE_REPORT from the Google Ads API, e.g.”Device”, “DayOfWeek”, or “Slot”.
Conclusion
Information is power, but the numbers in a report can also be misleading when interpreted incorrectly. Hopefully this script gives you another way to look at the data.
As you’re deciding how to structure an account, and what new ad variants to launch, having access to one more time-saving Google Ads script should help you do PPC better.
More Resources:
- 3 Ways to Automate Google Ads Without Knowing How to Code
- How to Recover Lost Conversions with a Google Ads Script
- PPC 101: A Complete Guide to Pay-Per-Click Marketing Basics
Image Credits
All screenshots taken by author, February 2019
