

Imagine this client email hits your inbox:
“I read that it’s a best practice to feature a company’s brand name in text ads. Should we include our brand name in all of our ad copy?”
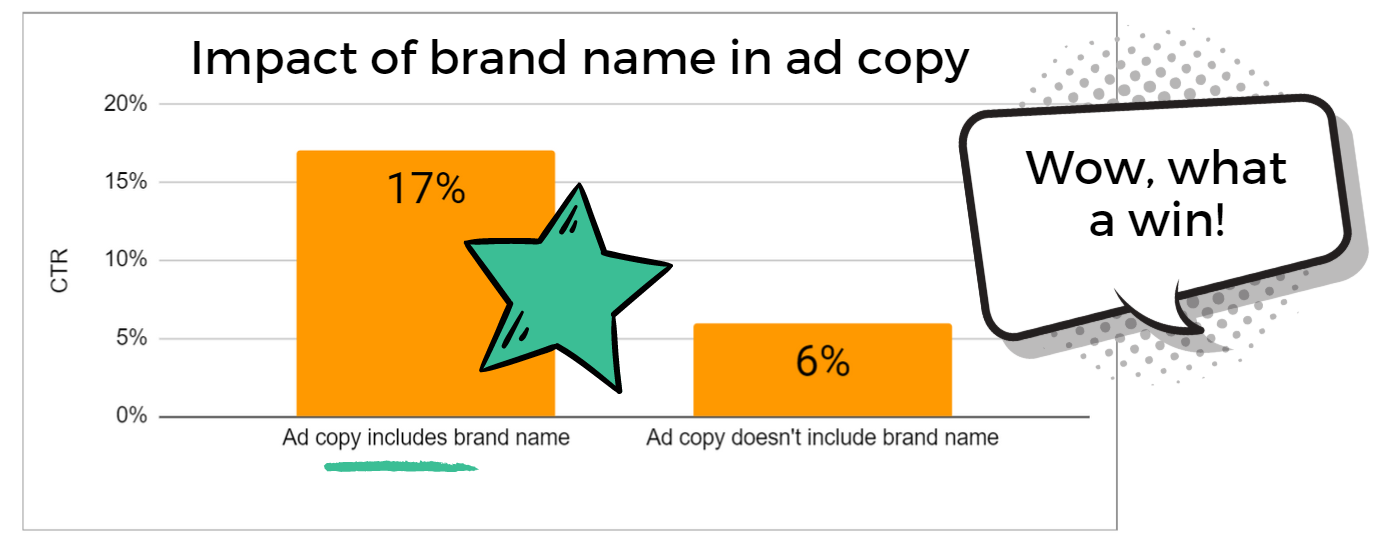
Because you already have performance data on your text ad variations, you get to work on crunching the numbers:
“Yes,” you respond.
“Ads that mention the brand are nearly 3x more likely to get clicked! I’ll swap in new branded text ads by the end of the week.”
Five minutes go by, when your client replies:
“Interesting. And I assume you’ve controlled for whether the brand is a search keyword?”
“Well…”
Flustered, you crunch the numbers again, this time taking into account whether the search queries were branded.
Your new conclusion contradicts the one you just provided.
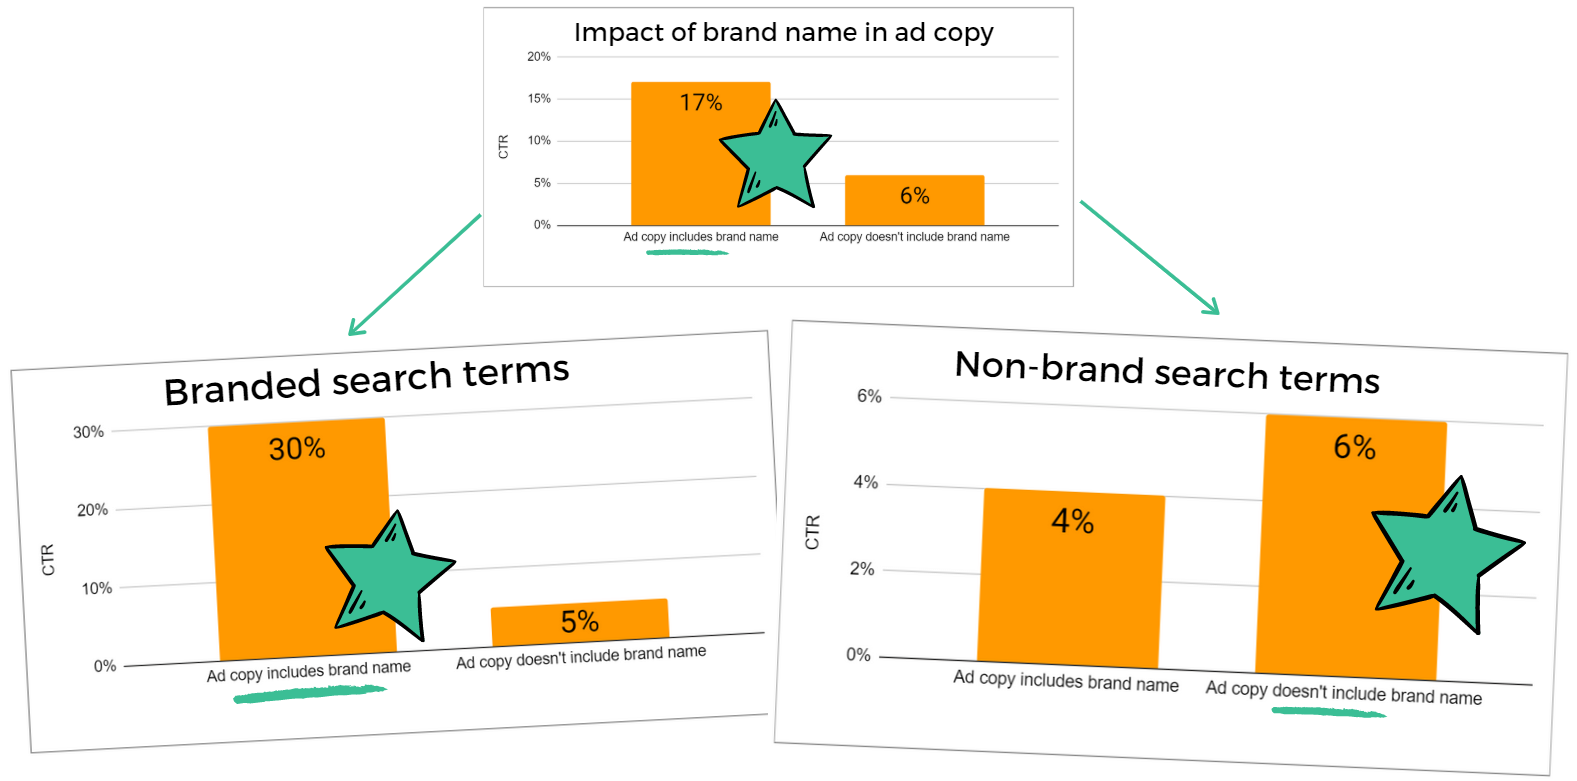
“For search queries that don’t include the brand, ads without the brand name are actually 50% more likely to get clicked.”
What Happened Here?
You pride yourself in being a data-driven, quantitative marketer.
But now you have to explain to your client why your analysis was wrong until they double-checked your process.
So what caused the error?
We could say that marketers wear many hats and can make mistakes when rushed.
But the real problem is deeper.
Most digital marketers are not trained statisticians, analysts, or data scientists.
Collectively, we’re an entire industry hacking our way to data literacy as we work to improve account performance.
In an ideal world, every marketer would be a statistician.
But if you don’t have the bandwidth to pick up a second career, here’s how you can avoid the pain of data overwhelm and find high-value insights in your PPC data.
1. Be a Critical Thinker & Your Own Biggest Skeptic
You’ve likely built your paid search career on finding wins and opportunities, not challenging your own conclusions.
Yes, it’s more fun to throw parties for the growth we’ll supposedly drive.
But this actually leads to lazy thinking that can tank performance.
Real statisticians are trained to be skeptical of easy conclusions and observations.
You may have trouble poking holes in your own analysis (especially at first). But it’s so much worse to:
- Have your conclusions challenged by someone in a position of authority after you’ve already committed your ideas to a PDF report.
- Have your recommendations implemented and watch revenue drop as a result.
It’s time to improve your critical thinking and PPC data interpretation.
Here’s what that can look like.
Scenario: ‘Ad Treatment A’ Outperformed ‘Ad Treatment B’

Lazy Thinking
I’m not a design expert and I can’t tell you why, but I do know that Treatment A has a higher CTR so we should adopt that design.
Critical Thinking
- What was different about the two treatments? Did both treatments drive to the same landing page with the same offer? Is our hypothesis supported?
- Did “Treatment A” do better across all audiences and placements, or just certain segments?
- Have I compared both CTR and conversion rate? What did we learn that we can apply to our next round of testing?
Scenario: Conversions Are Down 20% Month Over Month

Lazy Thinking
Conversions are down because fewer people are interested in your products this month.
You need better offers.
Critical Thinking
- Conversions are down 20% month over month, but if we zoom out, we see they’re up 128% year over year. We typically see a significant seasonal decline, but conversions are high for May.
- What’s contributing to that increase?
- How do budgets and acquisition costs compare year over year?
Lazy vs. Critical Thinking
The “lazy answers” in each of these scenarios are actual responses I’ve received from PPC job candidates.
Lazy thinking draws a conclusion without examining deeper data.
If you don’t know how to push past the most obvious conclusion, imagine that your boss (or client, or hiring manager) has just questioned your analysis.
- What did they find that you may have overlooked?
- What else may have led to the result you saw, outside of your initial observation?
- Why might this not be the correct (or best) interpretation?
Before accepting your own conclusions, spend more time trying to prove yourself wrong than proving yourself right.
2. Know Your KPIs & Calculations
If you don’t have a formal background in statistics or marketing, these calculations and frameworks will save you from making newbie mistakes in your analysis.
Conversions & Revenue
Start with Key Performance Indicators (KPIs)
Your KPIs should be the metrics that lead to business growth.
Prioritize your KPIs (such as conversions or revenue), and pay attention to the metrics that drive them (such as clicks and conversion rate).
Don’t let yourself get distracted by every number or data point that’s available to analyze.
‘Conversion’ Is Not a Standardized Metric
If you have conversions with different values (such as a newsletter subscribe and a large purchase), don’t aggregate conversion counts across the entire account.
You’ll get a lot more page view conversions than leads or sales, but they’re less valuable to the business and shouldn’t receive equal weight in optimizations.
ROAS (Return on Ad Spend) Isn’t Profit
Whether you’re selling products or services, there is a cost to doing business beyond just ad spend.
Don’t mistake spending $1,000 and getting $1,000 in revenue as “breaking even.”
Commonly Misunderstood Formulas
Comparison Formulas aren’t Reversible
Google Ads has a built-in tool for comparing different time periods.
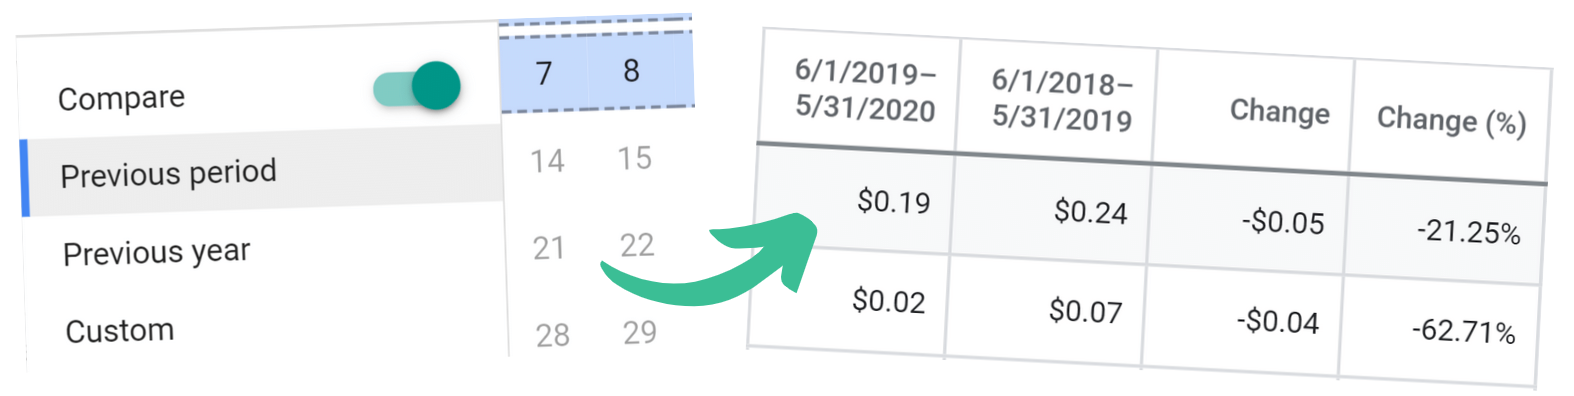
You can’t reverse directions and keep the values: a 63% drop in CPC from Year 1 to Year 2 does not translate to a 63% increase from Year 2 to Year 1.
Use this calculator if you have trouble calculating percentage increase or decreases.
Don’t Average an Average
If your metric is already an average or ratio (such as average CPC, CTR, conversion rate, ROI), you can’t re-average it for a grand total, because it doesn’t account for the quantities of each.
This mistake is an example of an ecological fallacy that confuses group and total averages.
You need to calculate the ratio using the raw totals of your metrics.
Incidentally, the error in our ad copy problem at the start of this article falls in this category, specifically the fallacy of division of Simpson’s Paradox: what is true of the whole is not always true of its parts.
By all means, learn more about data relationships than just what’s mentioned above.
But understanding even these concepts would solve for the most common data interpretation errors I see marketers make.
3. Uncover Spurious Relationships
“Spurious correlation” is a big name for an everyday occurrence in paid search.
We see the effect but aren’t aware of the real cause.
Spurious relationships happen when “two or more events or variables are associated but not causally related, due to either coincidence or the presence of a certain third, unseen factor.”
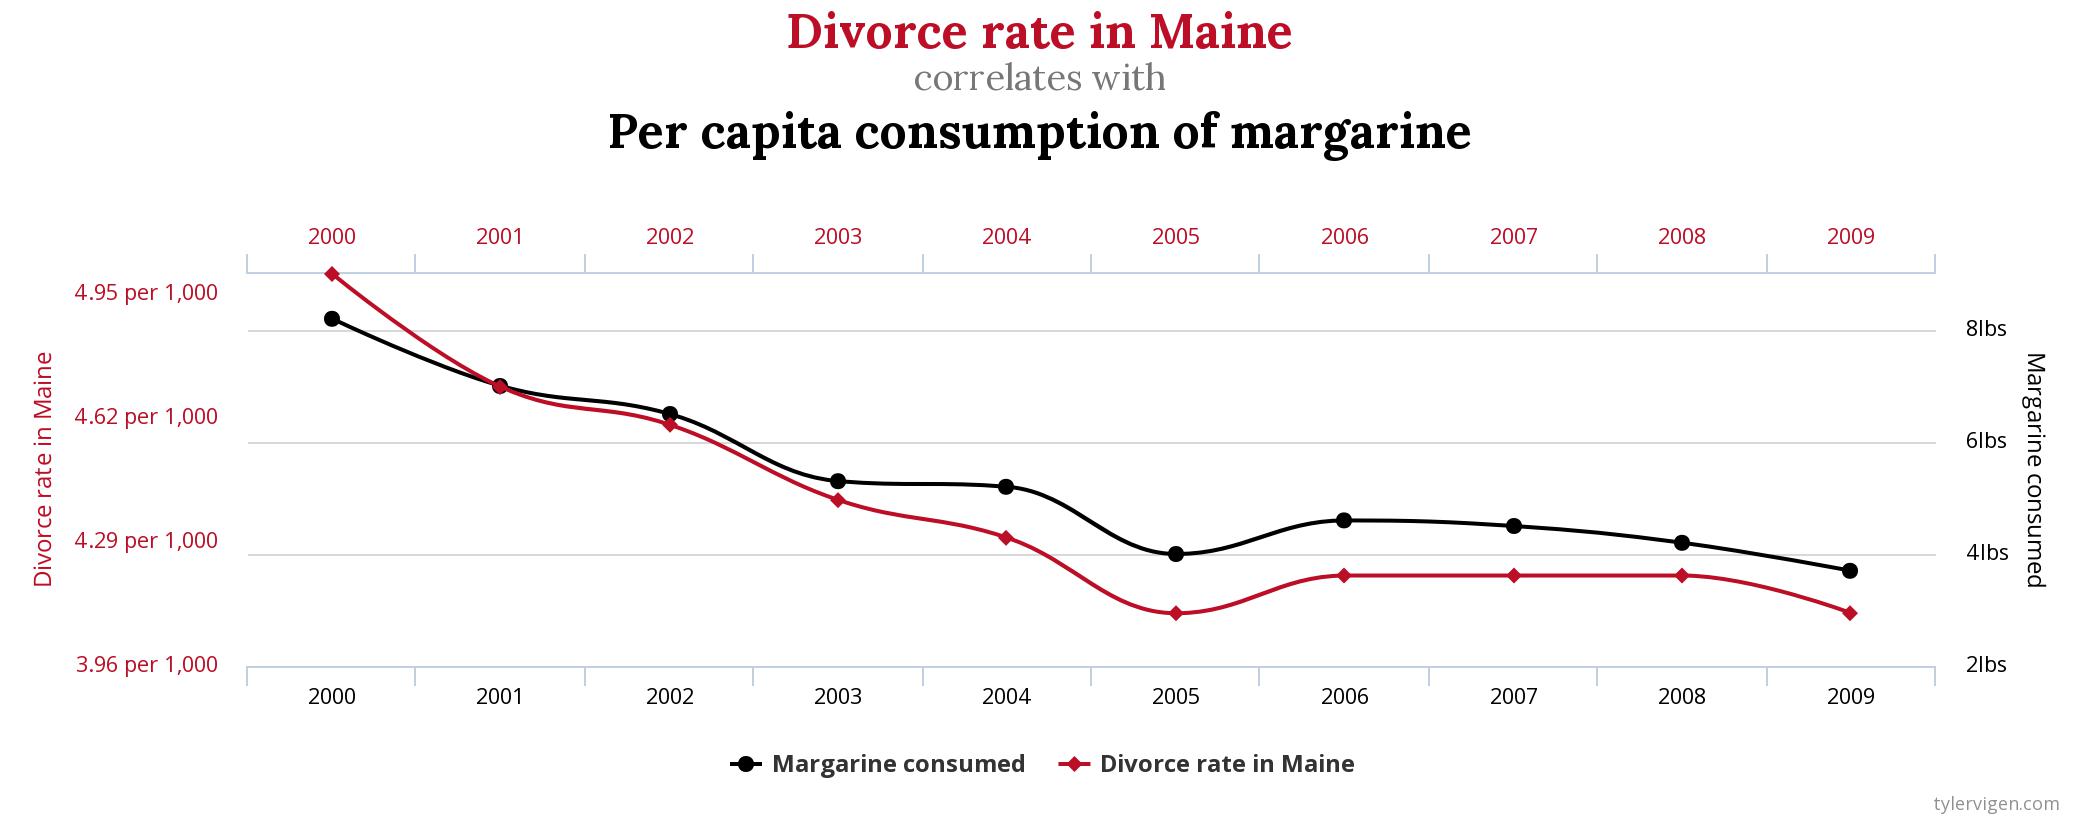
In this chart, the correlation of Maine’s divorce rate and margarine consumption is coincidental, but spurious relationships aren’t always random.
You know that “correlation is not causation.” Let’s take a look at how this impacts paid search.
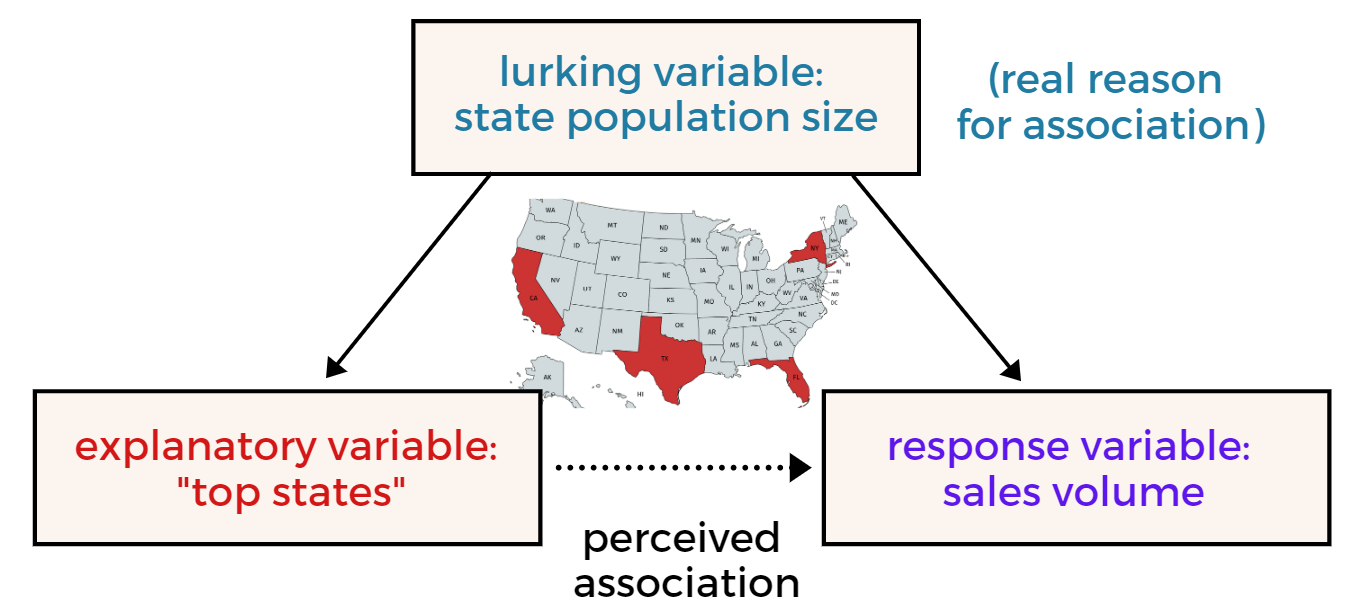
Lurking Variables
Lurking variables affect both independent and dependent variables, but they aren’t included in the model.
Instead, they’re hiding behind the apparent cause of the outcome.
For example, a client asks: “Where should we focus our PPC marketing efforts?”
Inexperienced U.S.-based marketers will tell them the same thing every time:
- California
- New York
- Texas
- Florida
Sometimes they even conclude that these states should receive a bid increase based on performance.
But they don’t consider that the “best states” have the largest populations – the lurking variable behind that high volume of clicks and sales.
It’s easy to miss lurking variables in the Google Ads interface, but you can train yourself to find them.
Here are some tips to catch or avoid lurking variables:
- Look at rates and ratios rather than raw numbers, especially where population size is a factor.
- Segment your tables to spot underlying causal variables like device type (which impacts conversion experience) and network type (which indicates intent).
- Review search term and geographic data, which may not match what you expected.
Confounding Variables
Confounding variables are another common cause of misinterpreting PPC results.
It’s easy to forget that outside the interface, there’s a wide world that impacts people’s search and purchase decisions.
For instance, in late March of 2020, Google searches for “vacuum cleaners” increased as searches for “housekeeping” declined:

While this surely affected performance of cleaning industry search accounts, the cause of the change to search traffic is COVID-19, something totally external to ad groups and bid strategies.
Don’t assume that every change in account performance is because of something you did.
Check factors like:
- Seasonality: The “predictable, repetitive rise and fall of time-based outcomes.”
- Promotions: Strength of offer, changes to offer, start and end dates, offline promotion efforts.
- Competition: Use Auction Insights but also observe how they’re positioning their offers.
- Tracking changes: Broken pages, missing conversion tracking, new conversion types, etc.
- Asset relationships: Do the search terms, ads, and landing pages all match?
- External: Use Google Trends and check both recent and long term patterns.
4. Accept Uncertainty
The lure of being “data driven” is the idea you can know with certainty what works and what doesn’t.
But in digital marketing, that’s rarely the case.
Interpreting data correctly means not being “fooled by randomness” or subconscious bias in the face of volatility, uncertainty, complexity, and ambiguity (also known as VUCA).
Here are a few guiding principles that will help you analyze your results.
The Law of Large Numbers Doesn’t Work in Reverse
There’s a theory in probability called the law of large numbers.
It states that with enough trials, the aggregate results of random events become predictable.
The law of large numbers applies, appropriately, to large amounts of data.
It works for casinos or Amazon.
It doesn’t apply to a small campaign with a few dozen clicks. There’s no “law of small numbers” where limited observations can accurately give you an expected value.
When it comes to scaling, forecasting, “picking winners” or otherwise estimating future performance, understand the limitations of a small sample set.
If your only conversion happened at 7 p.m., please don’t tell your client that 7 p.m. is the “best time” to advertise.
Beware the False Security of ‘Statistical Significance’
Marketers love to cite “statistical significance” even when they don’t understand what it means. (Hint: it’s not “significant” results that involve statistics.)
Significance testing can be challenging even for experts, who may conflate statistical significance with “substantive importance.”
Many studies incorrectly cite a gray area of significance, such as these findings published in peer-reviewed journals:
- “just escaped significance” (p=0.07)
- “not fully significant” (p=0.085)
- “quite close to significance at the 10% level” (p=0.104)
Even your online testing calculator could be leading you astray:
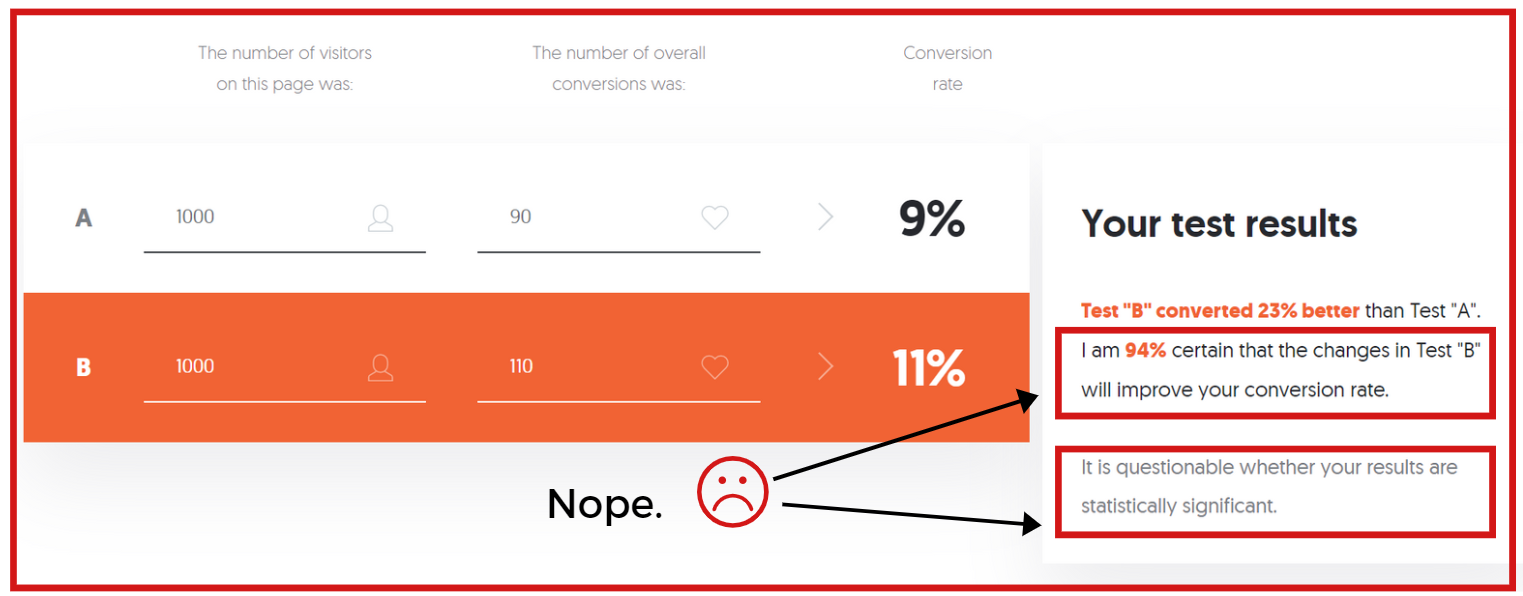
While statisticians debate the very merits of statistical significance, marketers often think of confidence levels as something to chase, and unwittingly p-hack and data dredge their way to faulty conclusions (if they even know what significance levels are in the first place).
At its best, statistical significance shows you the likelihood of getting your outcome if the null hypothesis were true (i.e., it was due to chance).
It doesn’t tell you if your conclusion of what caused the result is correct, nor does it ensure practical significance (whether the result was large enough to care about).
So how does this affect your quest to correctly interpret PPC data?
It simply means that the burden of having a plan and knowing your own risk tolerance is on you from the beginning.
If you haphazardly launch and then try to blindly plug numbers into a formula to derive insights, you’re unlikely to learn anything meaningful or “significant.”

Conclusion
The paradox of “data driven decisions” is that data doesn’t make decisions.
You have to make decisions about the data.
You may not have an academic background in statistics, but you’ll be able to hold your own on the quantitative side of digital marketing as you:
- Develop critical thinking skills.
- Learn key calculations.
- Dig deeper into the story of your data.
- Understand the constraints of your sample size.
Along with your own confidence (and vocabulary), your insights, reports, and client relationships will dramatically improve.
More Resources:
- How to Measure Success in PPC Campaigns With & Without Conversion Data
- How Data Science Empowers Performance Marketing & SEM
- How to Use Paid Search Insights to Optimize Other Marketing Channels
Image Credits
In-post correlation chart: tylervigen.com
All screenshots and compilation images by author, June 2020
