This post was sponsored by DebugBear. The opinions expressed in this article are the sponsor’s own.
A fast website provides a more pleasant experience for users and can lead to higher conversion rates.
But Google also takes website speed into account as part of the Core Web Vitals and uses it as a ranking factor.
Learn how Google’s Core Web Vitals assessment works and what you can do to ensure your website loads quickly and provides a good experience once it’s loaded.
In This Guide:
What Are The Core Web Vitals?
Google’s Core Web Vitals (CWV) aim to measure website quality and user experience.
To do that, several new metrics were developed which can be collected in the Chrome browser.
Three of these metrics form the Core Web Vitals:
- Largest Contentful Paint.
- Interaction to Next Paint.
- Cumulative Layout Shift.
Largest Contentful Paint
The Largest Contentful Paint (LCP) metric measures how quickly the single biggest piece of page content appears on the page after a visitor opens a page.
You can see an example of the LCP in this DebugBear rendering page speed filmstrip, which shows what content would be visible to users at different points in time.
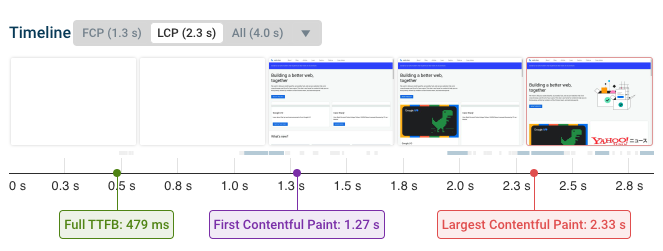 DebugBear filmstrip showing how page content appears gradually on a website, November 2023
Here content starts showing up after just 1.27 seconds.
However, the image on the right is identified by Chrome as the LCP element, and this image only shows up 2.33 seconds after the navigation.
The Largest Contentful Paint is closely related to two other Web Vitals metrics that are not part of the Core Web Vitals: Time to First Byte and First Contentful Paint.
Time To First Byte
Time to First Byte (TTFB) measures how quickly the server responds to the request for the HTML document that’s loaded at the start of the page load process.
Without the HTML document, the browser can’t show any content or start loading any other resources.
First Contentful Paint
The First Contentful Paint (FCP) looks at how soon any content appears on the page.
Content here usually means text or an image.
However, when this milestone is reached by the page most of the content may still be unavailable to the visitor.
The FCP can’t happen until after the TTFB milestone. In turn, the Largest Contentful Paint is always greater than or equal to the First Contentful Paint.
That means that TTFB and FCP put lower bounds on the LCP and looking at these two metrics can help you understand the loading behavior of your website.
Interaction To Next Paint
Interaction to Next Paint (INP) measures how responsive a website is to user input.
It generally looks at the slowest interaction a user has on a web page.
INP reports how much time elapsed between two timestamps during a page interaction:
- The user input, for example, a click or keypress.
- The next visual update (“paint”) of the website (whether the content changes or not does matter).
For example, this filmstrip shows a “View Details” button being clicked.
The click is handled by JavaScript code on the page and running this code takes some time. While the click is being processed the website UI remains frozen. Once the CPU processing is complete the browser renders the new content.
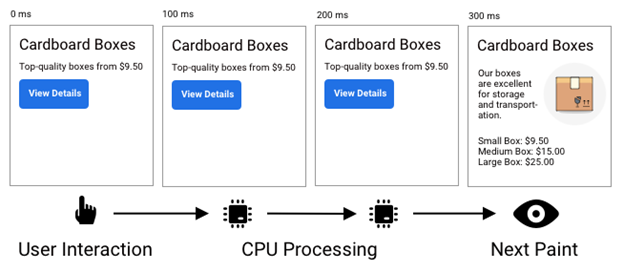 Screenshot by DebugBear showing the steps involved in a page interaction, November 2023
Technically, Interaction to Next Paint isn’t one of the Core Web Vitals yet, but Google has announced that INP will replace the older First Input Delay metric in March 2024.
Cumulative Layout Shift
The Cumulative Layout Shift (CLS) metric checks whether page content is visually stable after it appears.
An unstable UI disorients users and can lead to unintended page interactions.
This screenshot shows an example of a layout shift that happens during the page load process.
At first, the image in the top right is not yet visible as the browser is still downloading it. Once the image appears, the size of the image element updates. In this case, the element becomes larger and therefore pushes down content that’s below it on the page.
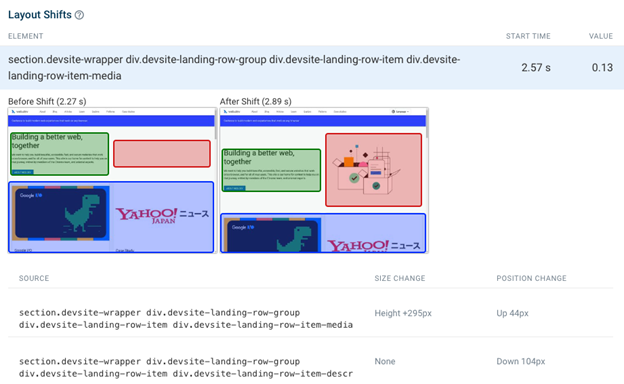 DebugBear screenshot showing layout shifts on a website, November 2023
CLS is called “cumulative” because the impact of different shifts is added up.
Originally this spanned the entire time the page was open, but this unfairly gave long-running single-page applications a poor rating. Google has now switched to the windowed CLS definition which only looks at a time window of up to five seconds.
What Is Google’s Core Web Vitals Assessment?
Google performs a Core Web Vitals assessment on your website and uses the results as a ranking signal.
If your website does not meet the Core Web Vitals, you will get a warning in various tools, for example, the “Core Web Vitals Assessment: Failed” alert in Page Speed Insights.
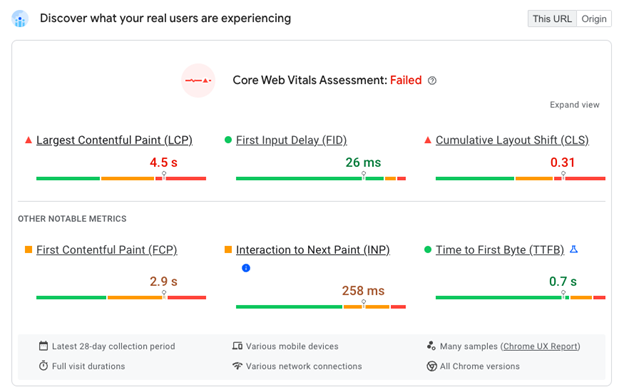 Screenshots of page speed insights with a failed Web Vitals assessment, November 2023
The data for the Core Web Vitals assessment comes from the Chrome User Experience Report (CrUX), which collects real user data from Chrome users.
In addition to PageSpeed Insights, Google Search Console also checks your web vitals and explains what URLs aren’t considered “Good”.
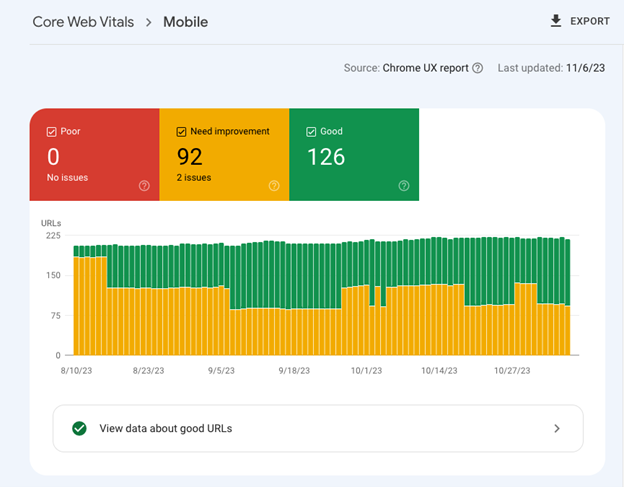 Screenshot of Google Search Console showing Core Web Vitals data, November 2023
What Makes A Good Core Web Vitals Assessment?
Google defines “Good”, “Poor”, and “Needs Improvement” thresholds for each metric.
| Metric | Good | Needs Improvement | Poor |
| Largest Contentful Paint | Below 2.5 s | Below 4 s | Over 4 s |
| Interaction to Next Paint | Below 200 ms | Below 500 ms | Over 500 ms |
| Cumulative Layout Shift | Below 0.1 | Below 0.25 | Over 0.1 |
To get the maximum ranking benefit, your website should be rated “Good” across all three Core Web Vitals. As your website gets worse, this gradually impacts your rankings until the “Poor” threshold is reached.
How To Speed Up Largest Contentful Paint (LCP)
To improve your LCP, you need the main content of your website to load faster.
- Run a free website speed test to understand what is causing the main content of your webpage to lag.
- Receive and review the insights from the visual filmstrip and high-level performance metrics to uncover what your next steps are.
- Use those insights to optimize your page load speed.
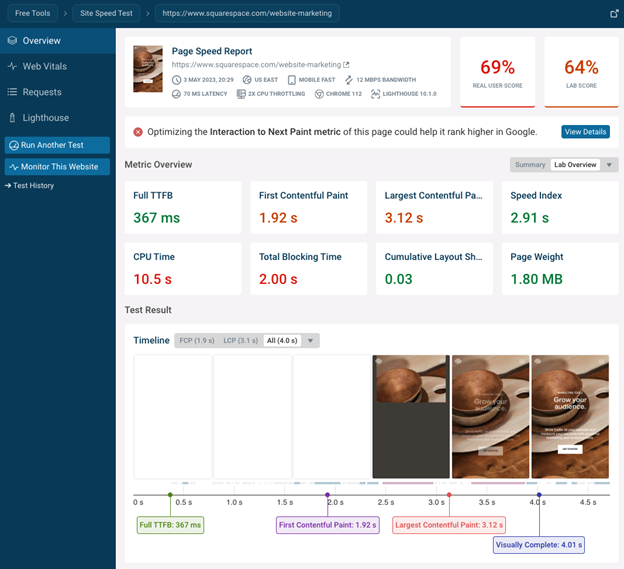 Result of a DebugBear website speed test, November 2023
You can then dive deeper into the specific metric by clicking on the “Largest Contentful Paint” metric title in the test result.
This will show you:
- What page element is responsible for the Largest Contentful Paint.
- If the LCP is an image, what the image URL is, and what request priority was used by the browsers.
- If the LCP is an image, what other requests the image file depended on.
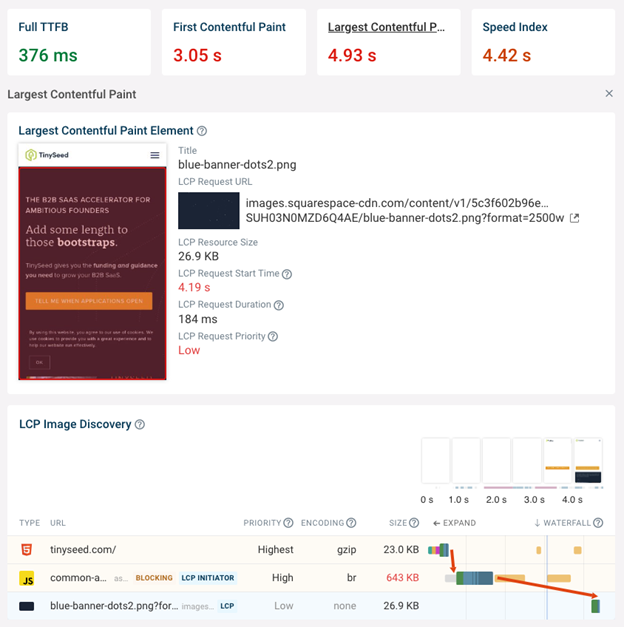 DebugBear screenshot showing an analysis of the Largest Contentful Paint, November 2023
Request waterfalls show what resources were loaded over the network and how long they took to load. In this case, the partial request waterfall focusing on the LCP image shows that the image depends on first loading a large JavaScript file. This is a common problem and you should aim to load LCP images directly from the HTML document.
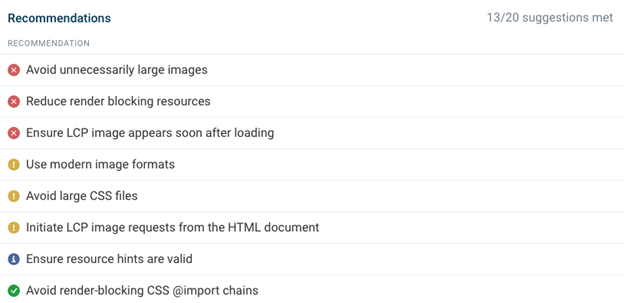
The DebugBear test result also offers many automated recommendations and ranks them by expected impact.
How To Improve Interaction To Next Paint (INP)
Only 64% of mobile websites currently provide a Good INP experience, making it an important metric to optimize.
The INP metric can be hard to debug as it depends on a user interaction that can’t be tested as easily.
You can manually test out page interactions and measure them using the Chrome DevTools performance profile.
This works well if you know what page elements users typically interact with. DevTools is also really helpful once you’ve identified a slow interaction, as the Chrome developer tools will tell you exactly what the browser spends time on during that interaction.
The INP Debugger tool can also be handy as it automatically simulates interactions with different page elements. All you need to do is enter a website URL.
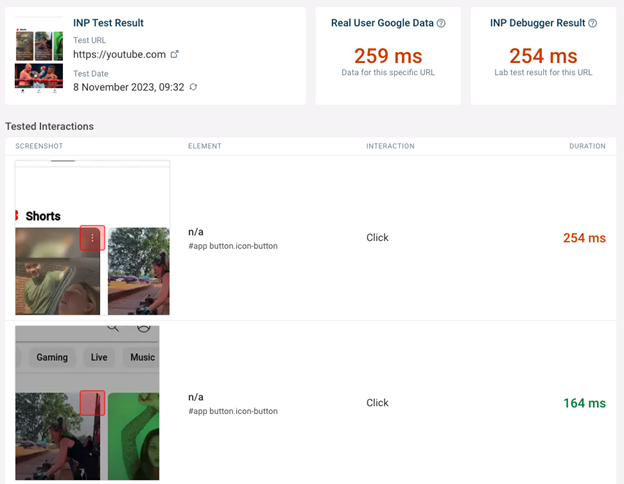 Screenshot of the free INP Debugger tool, November 2023
However, the INP Debugger won’t be able to identify all interactions, especially if they are part of a longer user flow. This is where collecting real user monitoring (RUM) is useful, as it allows you to focus your optimizations in exactly the right place.
With RUM data you can see exactly what page elements most users are interacting with and whether they are experiencing interaction delays.
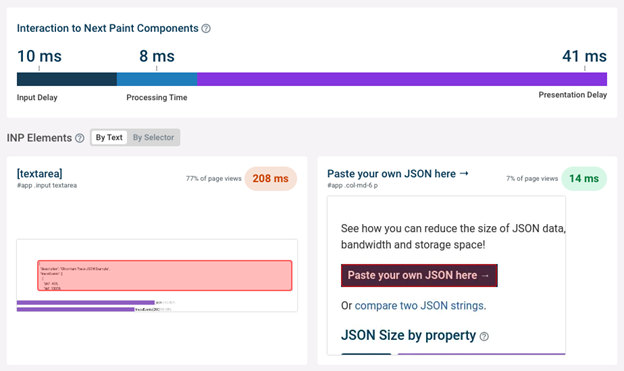 Screenshot of real user monitoring data in DebugBear, November 2023
You can also see a RUM breakdown into its different components:
- Input Delay.
- Processing Time.
- Presentation Delay.
Input Delay measures how long after the user interaction the browser started processing the user input. A high Input Delay indicates that background tasks or previous event handlers are blocking the user interaction.
Processing Time measures the actual time spent handling the user input. If this is slow, your developers need to look at what code runs in response to the interaction and how that code can be optimized.
Presentation Delay measures how much time elapsed between the event being handled and the next paint. This number can be high if rendering the page is complex, or if other CPU processing has been queued up while the interaction was handled.
How To Reduce Cumulative Layout Shift
Similar to INP, Cumulative Layout Shift can be hard to fix as it often happens when the user scrolls down the page or when additional content appears after the user clicks on a UI element.
If the layout shift happens during the initial load of the page, it’s easy to identify by:
- Running a page speed test.
- Clicking on the “Cumulative Layout Shift” metric title to see what page elements have moved.
- Fixing the element that is causing the shift.
For example, here, additional content was loaded causing the layout to change.
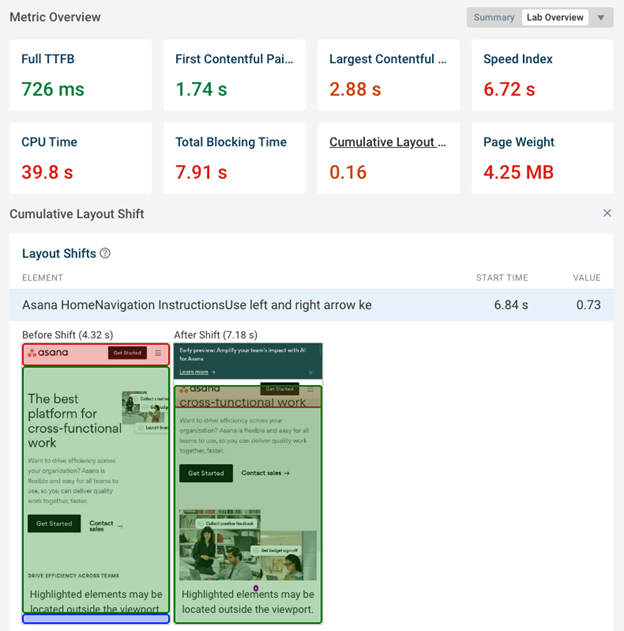 Screenshot showing lab-test layout shift in DebugBear, November 2023
How To Fix Layout Shifts
To fix layout shifts, ensure that appropriately sized placeholders are in place if some content only appears later on in the page load process.
You can also work on ensuring the other content loads earlier – if the content is ready as soon as the page starts rendering then there’s no layout shift.
If your CLS score is hard to replicate you can use DebugBear real user monitoring to see what’s causing layout shifts for your real users.
In addition to looking at high-level distributions you can also look at individual user experiences and what led to layout shifts for them.
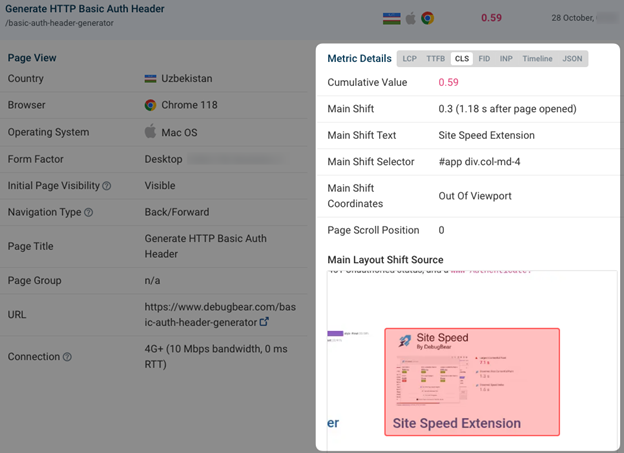 Screenshot showing real user layout shift in DebugBear, November 2023
Monitor Page Speed & Core Web Vitals
If you’re struggling to pass the Core Web Vitals assessment, DebugBear monitoring can help you identify issues on your website and make sure you get alerts when there’s an issue.
Simply start a free trial and enter your website URLs. See all your page speed metrics at a glance on the dashboard. DebugBear also keeps track of Lighthouse scores and the real-user Google data that impacts rankings.
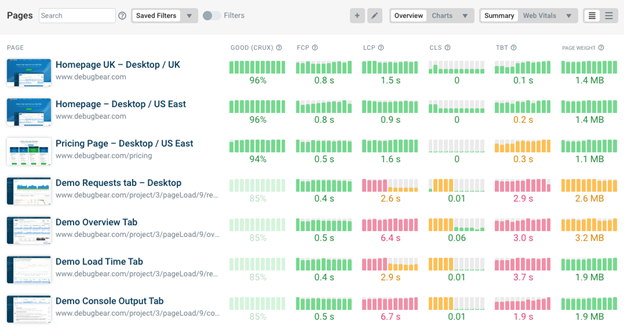 Screenshot showing key page speed metrics in DebugBear, November 2023
In addition to continuously testing your website in a controlled lab environment, you can also install an analytics snippet on your site to track real user experiences.
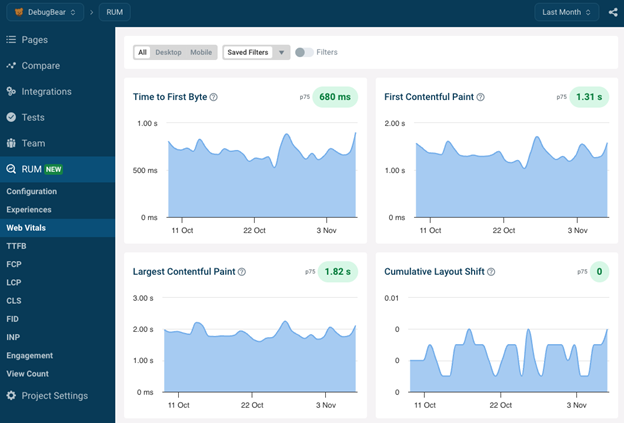 DebugBear showing real user Core Web Vitals charts, November 2023
In addition to the high-level Web Vitals overview, DebugBear RUM lets you break down user experiences by page speed, country, or web browser.
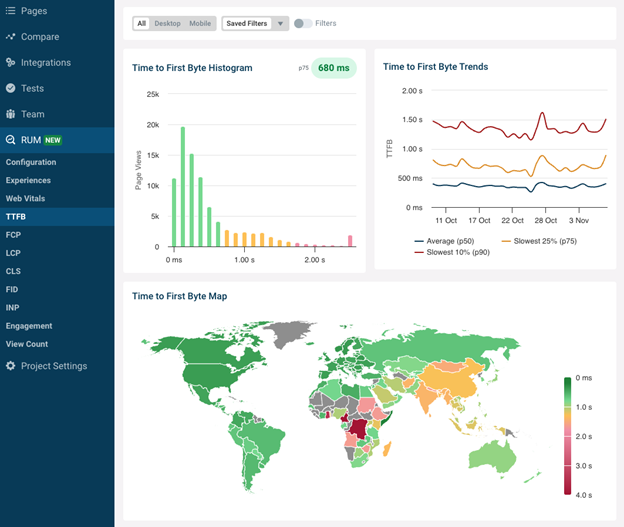 DebugBear screenshot showing a real user TTFB analysis, November 2023
Having detailed lab reports and real user data allows you to get ahead of the Google CrUX data that impacts rankings and is reported with a 28-day delay. DebugBear provides powerful insights into your Core Web Vitals and helps you communicate with the rest of your team and management.
Ready to start optimizing your website? Sign up for DebugBear and get the data you need to deliver great user experiences.
Image Credits
Featured Image: Image by DebugBear. Used with permission.

