
While presenting “Reporting and Analyzing PPC Campaigns” at SES New York last month, I noticed that many participants were interested in learning more about how to meticulously analyze campaign performance. In response, I have decided to write a series of posts that describe a few simple mathematical steps I have been using to analyze campaign performance. Through this series, you will learn how to use these handy quantitative measurements to:
- Validate campaign performance
- Identify improvement opportunities
- Confirm optimization outcomes
- Visually present your findings in Excel
Let’s start with validating Click-Through-Rate (CTR) performance on two small ad groups. Both ad groups have 9 keywords and deliver an average CTR of 5% over a week. Assuming the other campaign performance parameters are equal, would you say Ad Group #1 and Ad Group #2 have the same performance?
EXAMPLE One: CTR Performance Comparison with Avg. CTR
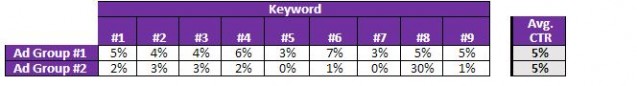
After a quick scan of the table you conclude most of the keywords in Ad Group #2 have a lower CTR, but that one of its keywords has an out-of-the-ordinary CTR (30%), significantly increasing that Ad Group’s average CTR. On the other hand, keywords in Ad Group #1 perform more consistently, which makes its average CTR more credible. As this simple example illustrates, checking the consistency of your ad group data is an important first step toward optimization because it helps you better prioritize your optimization efforts and identify more insights. I would like to share fours simple steps for conducting a similar assessment on bigger ad groups:
Step One: Use the Median to Assess the Validity of the Average
- Your Average value adds up each individual value within a group and divides it by the number of values within that group. Consequently, it can be adversely affected by some very high or very low values within the group.
- Your Median value is the middle value within an arrangement of values from lowest to highest. You can quickly assess whether your average is influenced by outliners by comparing your average and median.
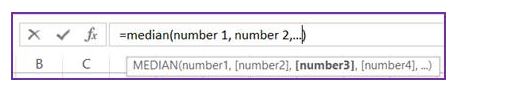
- The easiest way to calculate Median is using Excel’s median function:
Exhibit One: Excel Median Function
Applying Median and Average to Example One:
- The median CTR for Ad Group #1 is 5%, which is equal to its average CTR. This confirms its average is a strong representation of CTRs distributed within Ad Group #1.
- The median CTR for Ad Group #2 is 2%, which is 3 percentage points away from its average CTR. That difference is alarming and we need to take additional steps to validate whether Ad Group #2’s data distribution is outside the norm to confirm the validity of its average CTR.
EXAMPLE Two: CTR Performance Comparison with Median CTR and Avg. CTR

Step Two: Use Standard Deviation to Identify Exceptions
- Standard Deviation measures how spread out a group of numbers are from their average; a lower standard deviation implies a closer distribution within a group of numbers.
- Empirical Rule is the rule of thumb for using standard deviation to identify out-of-ordinary values: 95% of data should be distributed within 2 standard deviations of its average.
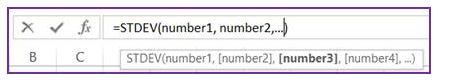
- The easy way to calculate Standard deviation is using Excel’s stdev function:
Exhibit Two: Excel Standard Deviation Function
Applying Standard Deviation and the Empirical Rule to Example Two:
- In Ad Group #1, applying our empirical rule, 95% of the CTR data should fall between 3% and 7%. We see that the data is all within this range.
- In Ad Group #2, 95% of its CTRs should fall between 0% and 25%, but we see only 89% (8 out of 9) of its data falls within this range. We need to remove the outliner before summarize its performance and investigate why one of its members has out-of-the-norm performance.
EXAMPLE Three: Monthly CTR Performance Comparison with Standard Deviation, Median CTR and Avg. CTR

Step Three: Exclude Exceptions (“Outliers”) to Better Assess Performance
- Separate outliers (i.e. values that fall outside 2 standard deviations from the average) from the rest of the values
- Use the remaining values to compare performance, prioritize works and deliver scalable outcomes.
After removing 30% (Ad Group #2’s outlier), the new average CTR is 2%, with a standard deviation of 1. From there we can have a fair performance assessment between these two ad groups.
EXAMPLE Four: Adjusted Monthly CTR Performance Comparison with Standard Deviation, Median CTR and Avg. CTR

Step Four: Analyze Exceptions (“Outliers”) to Identify Improvement Opportunities
- Repeat Step One and Step Two to assess outliners’ consistency over a period of time.
- If they consistently perform differently from the result of the ad group, identify the cause and capitalize your findings.
Take the same approach to analyze Ad Group #2 outliner’s performance over prior 7 weeks. As shown below, its average and median are the same and all of the values are within 2 standard deviations of their average, we can positively confirm its consistency and should further investigate this exception.
EXAMPLE Five: Daily CTR Performance on Keyword #08 at Ad Group #2
![]()
Positively identifying improvement opportunities is the shining moment for all of us working on campaign optimization. My most recent encounter took place while analyzing an ad group centered around fireplace accessories: I noticed a set of keywords that have a much lower CTR than their counterparts. After applying the above four steps to confirm their consistency, I further reviewed this ad group components and found:
- All of its keywords are relevant and supported by well-designed landing pages.
- Most of those outliners are durable parts of fireplace, they are more expensive than expendable ones.
- There are two ad copies associated with this ad group, both adopt low-price as their selling points.
I sampled marketplace competition on those durable parts and noticed most of the top ranking ads adopt best-quality as their selling points. I recommended account owner move durable parts-oriented keywords to a new ad group and adopt quality or services as the selling points on their ad copy. We immediately notice an improvement right after making those changes and the satisfaction is beyond any math could measure. While we will go over how to use simple math to validate optimization outcomes in Part Two of this series, today’s takeaways are:
- The Average can be overly influenced by a few extreme values within a group, the Median can help you quickly assert the validity of the average.
- 95% of data should fall within 2 standard deviations of their average, exclude outliers while drawing actions from the data.
- Analyze outliers’ root causes to identify trends and improvement opportunities.
