

Nothing is more frustrating than a slow website.
Slow load times disrupt the overall user experience and have negative impacts on the conversion potential of your landing pages.
From an SEO perspective, Google is less likely to promote webpages that take too long to load.
Yes, site speed is a ranking factor, so taking the time to improve it can drastically improve your ranking positions.
So if you’re ready to go from slow to fast, Google’s PageSpeed Insights Report can help you identify whether or not your pages meet performance standards and, if not, how to improve them.
Use this guide to understand your PageSpeed Insights report and learn how to leverage it for better SERP performance.
What Is Page Speed?
Google defines page speed in two ways:
- How long it takes to display content above the fold.
- How long it takes a browser to fully render the page.
But a lot goes into how fast our webpages are. The user’s internet connection, a domain’s web hosting service, and cache clearance can impact load times.
So when we talk about page speed, some elements are out of the site owner’s control. But there are plenty of elements that the webmaster can optimize, such as images, videos, JavaScript, and more.
Because page speed is so essential to the user experience, Google considers the overall performance of a page when determining whether to promote it in the SERPs.
Taking the time to optimize your content for speed shows Google that you want to create a high-quality experience for your site visitors.
What Is Google’s PageSpeed Insights (PSI)?
PageSpeed Insights is a free performance tool that analyzes the content of a given webpage and provides page speed scores for both the mobile and desktop versions of the page.
The tool also identifies opportunities for optimization and makes specific recommendations for improvement.
PageSpeed Insights is one of many page speed audit tools available to site owners, but it is by far the best for those interested in improving speed for SEO purposes.
With PageSpeed Insights, site owners can see in detail how Google understands the technical performance of their pages.
PageSpeed Insights And Ranking
Although site speed is a ranking factor, the PSI score is not. The score is designed as an estimated performance overview.
PSI isn’t a ranking factor, it’s just a “lab” tool to help you to find issues to work on. It does test from certain locations, so for PSI the location/network can play a role. It’s similar when you test locally with Lighthouse. Both do try to emulate general user connections too.
— 🥔 johnmu of switzerland (personal) 🥔 (@JohnMu) July 6, 2021
Some of the metrics the tool relies on to calculate PSI scores, like Core Web Vitals, are a part of Google’s ranking algorithm.
All of that is to say that PSI scores are a good indication of whether or not your pages are meeting Google’s speed and performance standards. There is a strong correlation between higher scores and better keyword rankings.
When slow speed is left unresolved, any SEO strategy will be derailed by underperforming pages.
Page Speed And The User Experience
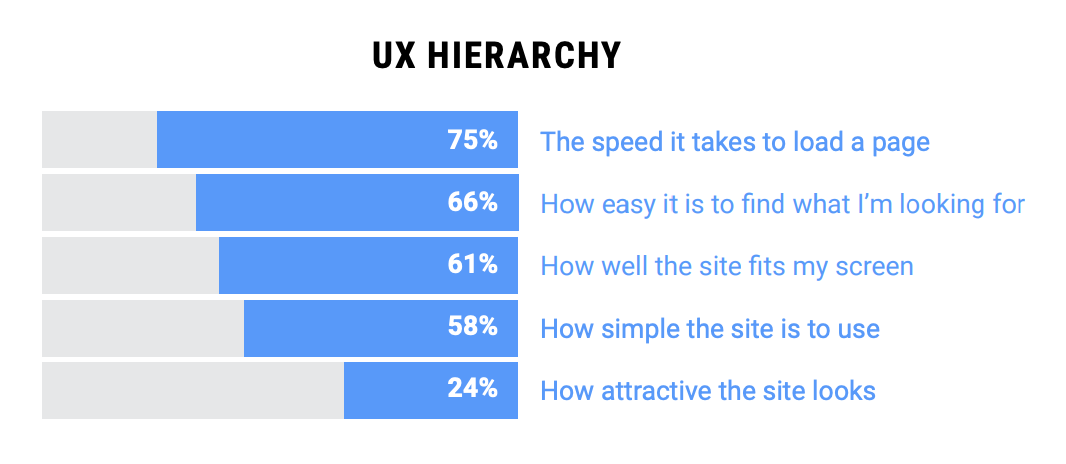
Beyond SEO, page speed is also essential to the overall user experience.
For mobile users, page load speed is considered the most important factor, even more so than quickly finding what they are looking for or the aesthetic quality of the page.
A one to three-second delay increases the visitor’s likelihood to bounce by 32%.
Worse, conversion rates drop by an average of 4.42% with every additional second of load time.
Improving site speed is non-negotiable to any search engine optimization and conversion optimization strategy.
Google’s PSI tool is the best place to get started to understand your site speed and how to improve it.
Using The PageSpeed Insights Tool
To use Google’s PSI tool, enter any URL into the toolbar, press Analyze, and PSI will get to work.
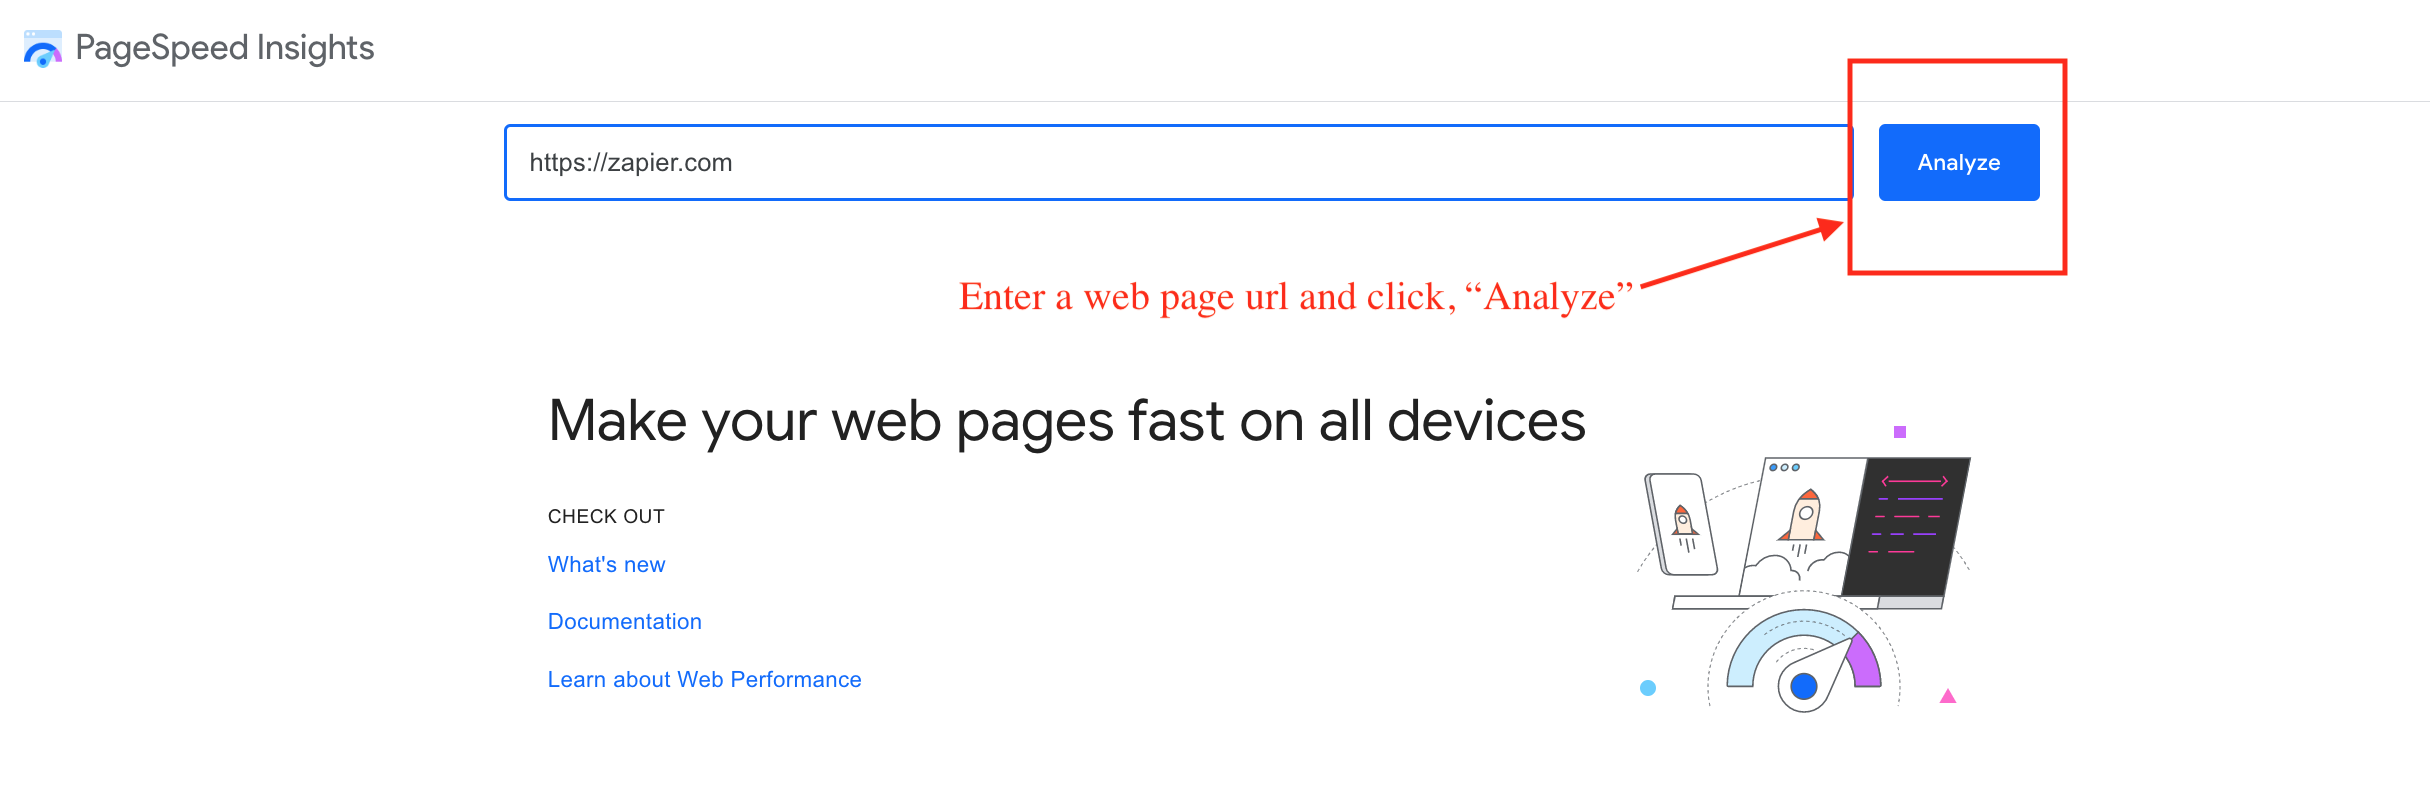
As you wait for your report to generate, the tool is doing two main things.
First, it’s gathering the page’s “Field Data,” or the performance data contained in the Chrome User Experience Report (CrUX).
Second, it measures your page performance via the Lighthouse API. This is called “Lab Data” because it measures the webpage’s speed in a simulated, controlled environment: mobile networks and a mid-tier device.
This helps eliminate some variables that can impact a webpage’s speed and performance.
Understanding Your PSI Report
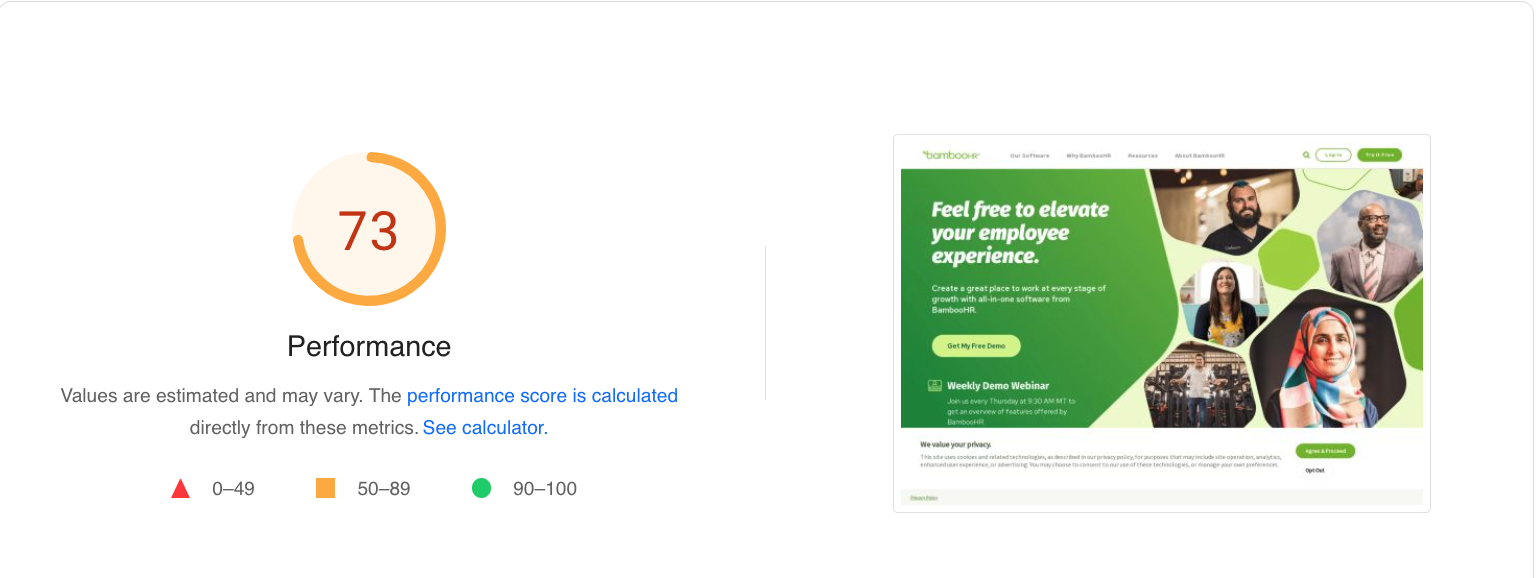
Google’s PSI tool will generate a detailed report that includes Core Web Vitals assessment, Lighthouse lab data, opportunities, diagnostics, and passed audits.
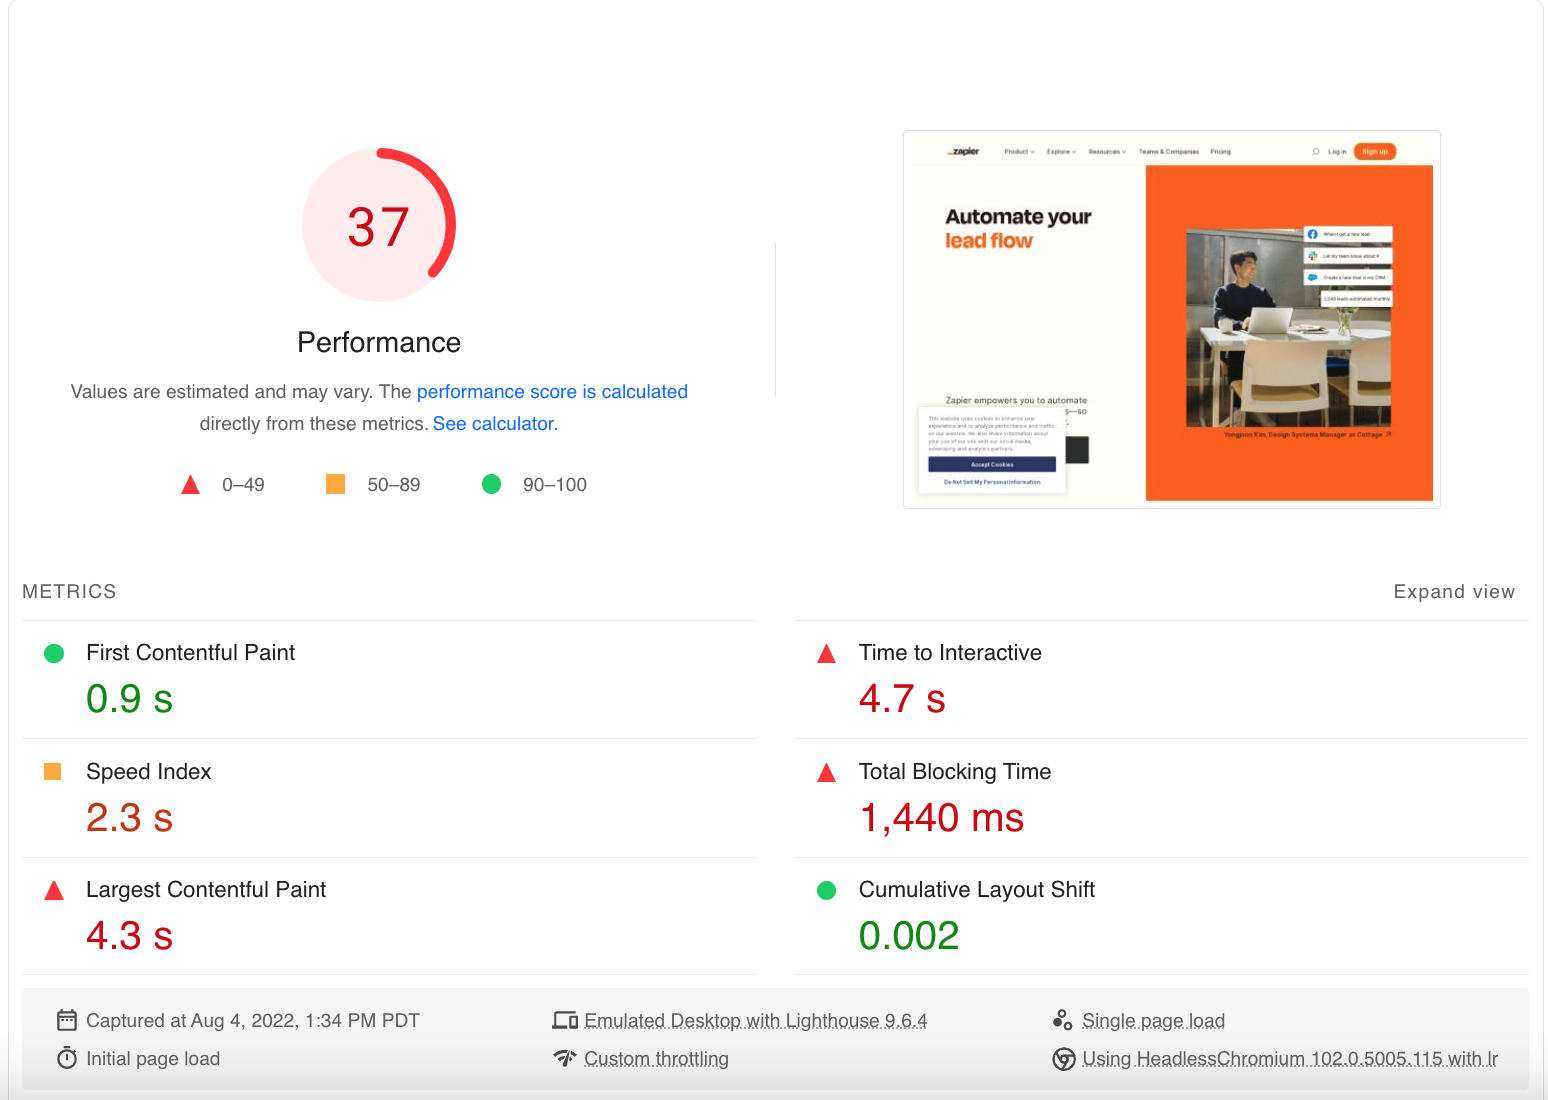
Throughout the PSI report, color coding makes it easy to understand the areas where the page is performing well, still needs improvement, or is underperforming.
- Green = Good.
- Yellow = Needs Improvement.
- Red = Poor.
Here is how to interpret the information in each area of the report.
Core Web Vitals Assessment (Field Data)
PSI’s Core Web Vitals data comes from the Chrome UX Report and includes three primary metrics. Each captures a different aspect of speed and load time.
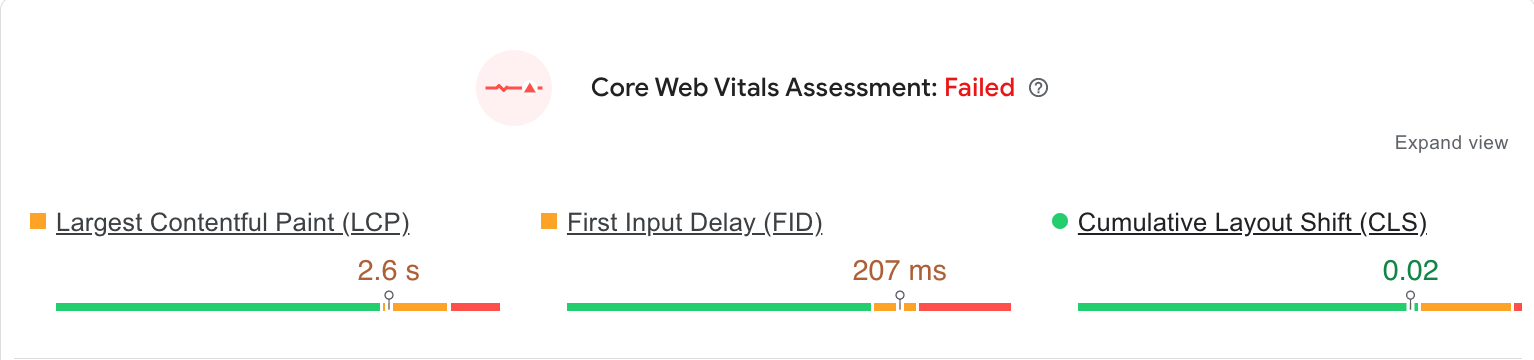
- First Contentful Paint (FCP): The time it takes for the first text or image asset to load.
- Largest Contentful Paint (LCP): The time it takes for the largest text or image asset to load.
- First Input Delay (FID): The time it takes for the browser to respond to the user’s first interaction.
- Cumulative Layout Shift (CLS): This measures any movement of the page in the viewport.
Each performance metric is measured in seconds or milliseconds, except for Cumulative Layout Shift (CLS).
CLS is calculated through a specialized formula. A CLS score below 0.1 is considered good, while a CLS score above .25 is considered poor.
The field data presented in the report comes from the previous 28 days and will always be presented with accompanying distribution bars.
That’s because Field Data is made up of aggregated data from the CrUX report, and the same webpage never performs the same way for all users.
For example, in the above report, the page met FCP standards 69% of the time but failed to meet those standards 31% of the time.
Lab Data
Google’s PageSpeed Insights Lab Data includes synthetic data from the Lighthouse API. Lighthouse measures Core Web Vitals and three additional metrics.
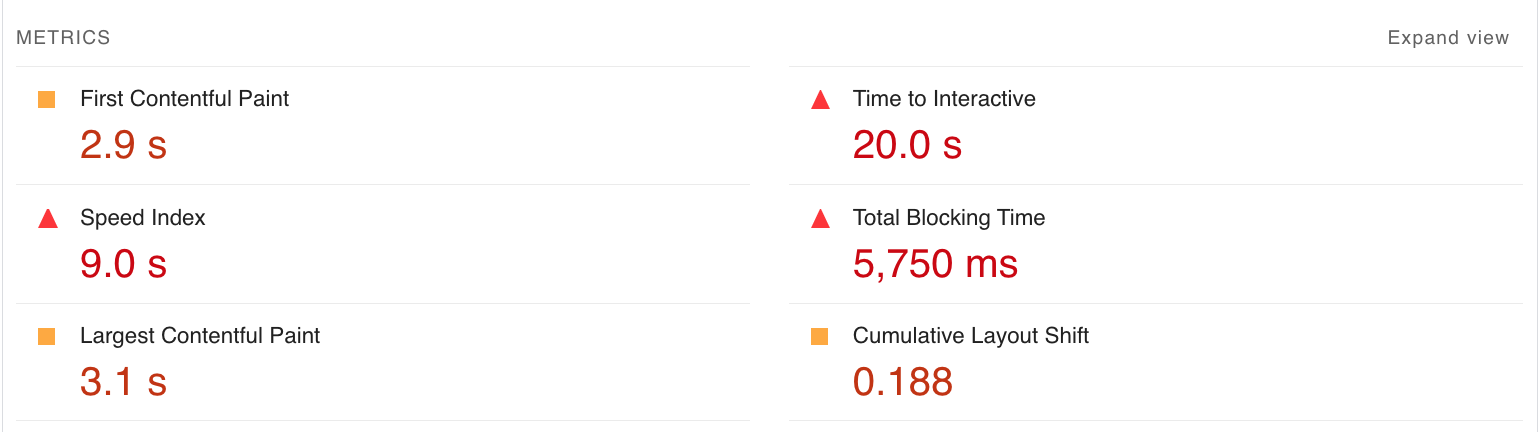
- Speed Index: The time it takes for the content to visually appear during page load.
- Time to Interactive: The time it takes for the page to become fully interactive.
- Total Blocking Time: The sum of time between FCP and full interactivity.
Unlike Field Data, the metrics measured in the Lab Data will not contain a display bar but simply the time stamps or results from the lab test.
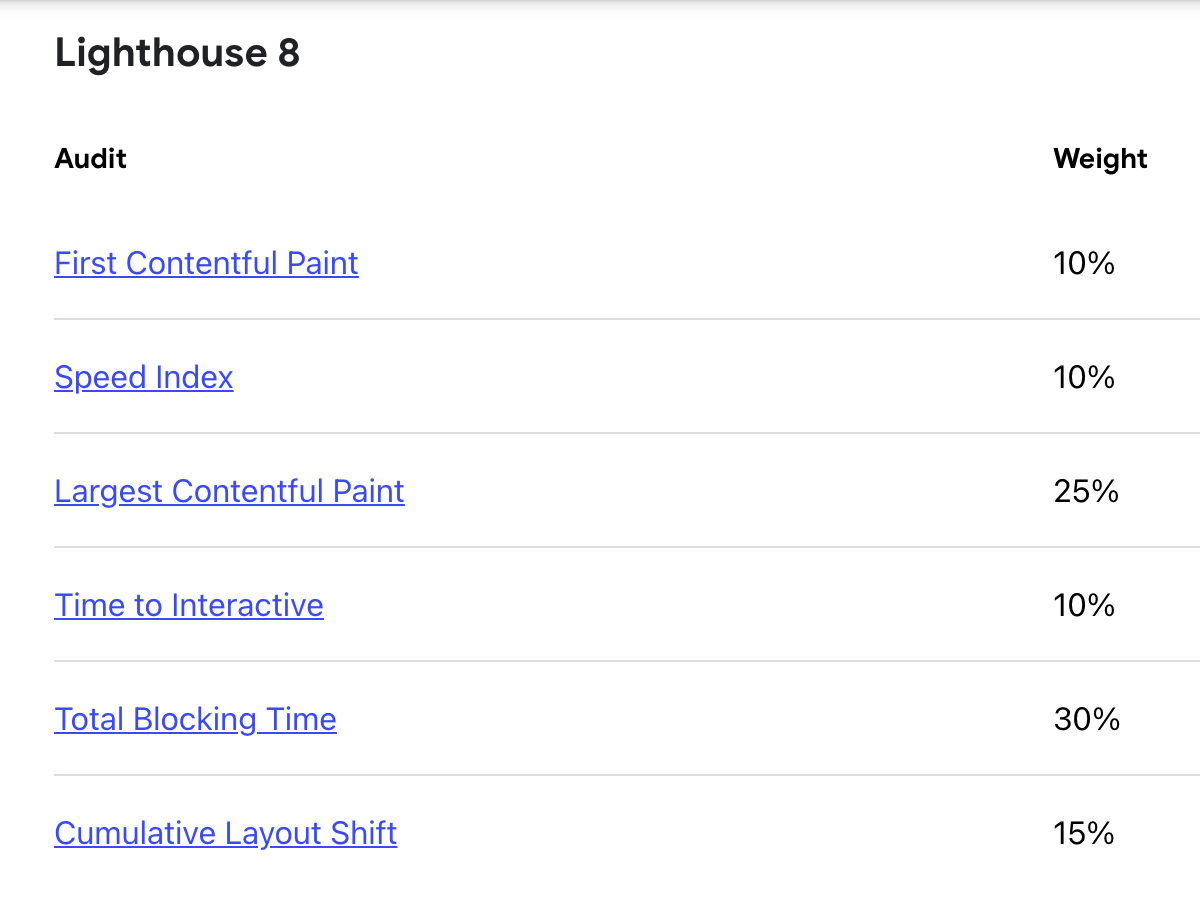
It’s important to note that some of these metrics carry more weight in the overall PSI score. Here is the current weighted rubric for Lab Data in Lighthouse 8.
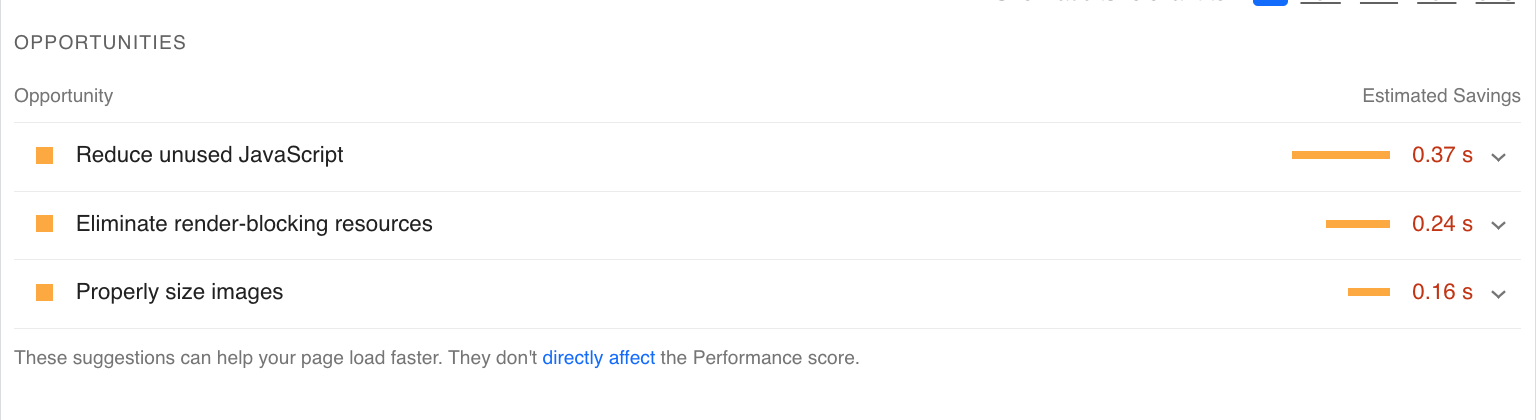
Opportunities & Diagnostics
The Opportunities and Diagnostics sections provide specific recommendations for improving page speed.
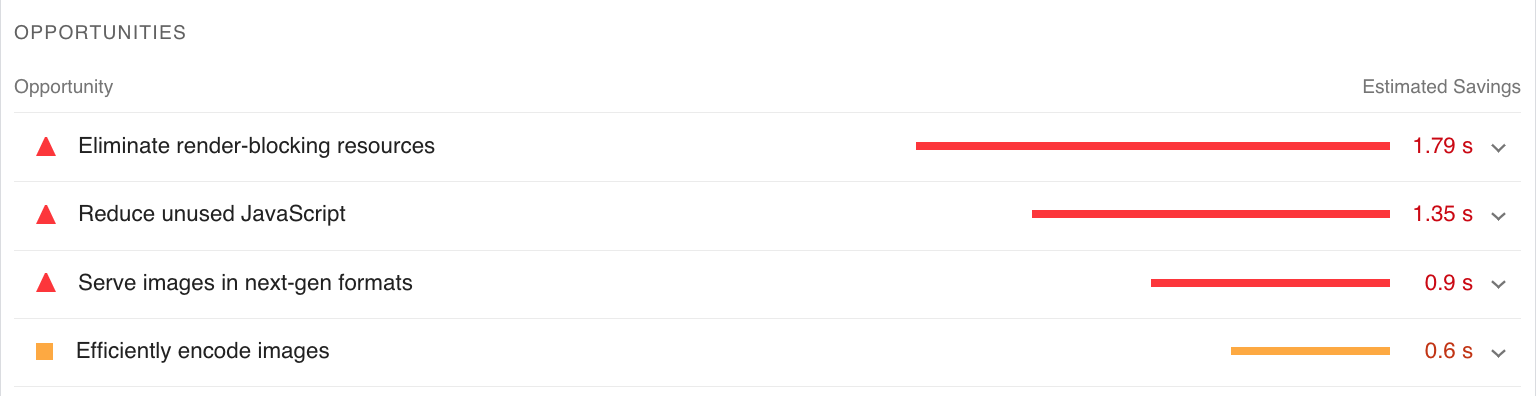
The report also details the estimated time savings that following the recommendations could bring.
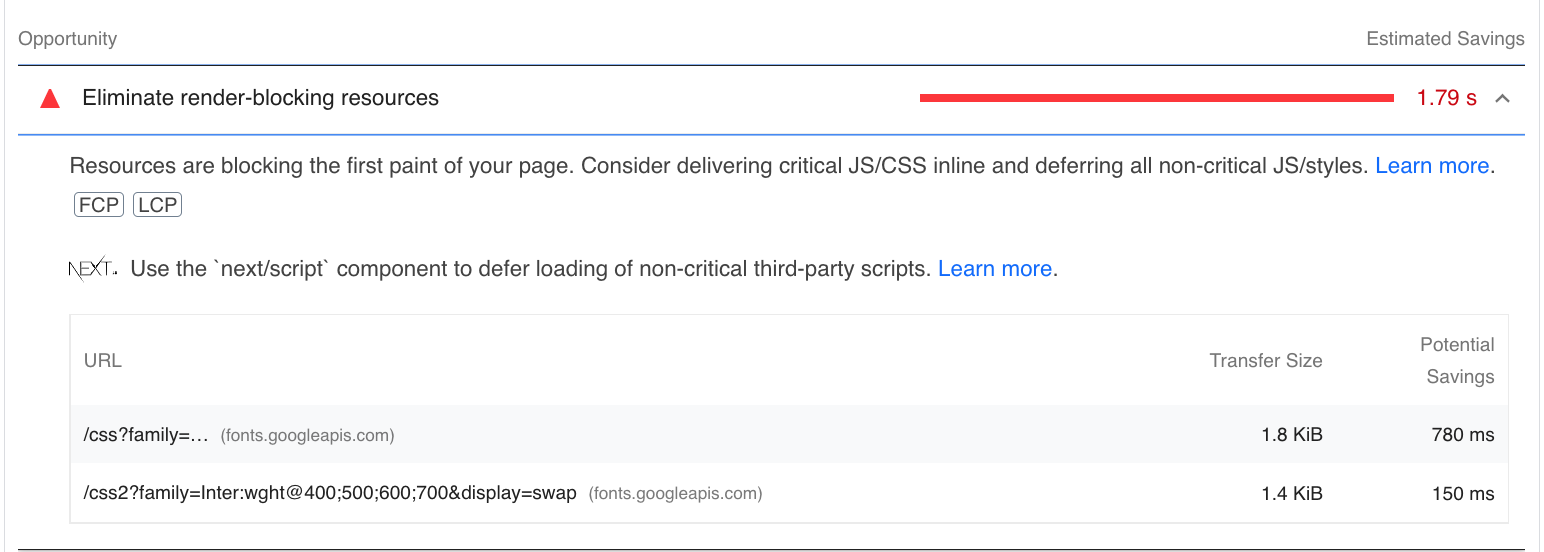
To get more details about the next steps, click on the dropdown arrow next to any given Opportunity in your report.
The tool will explain the issue and provide guidance on how to fix it.
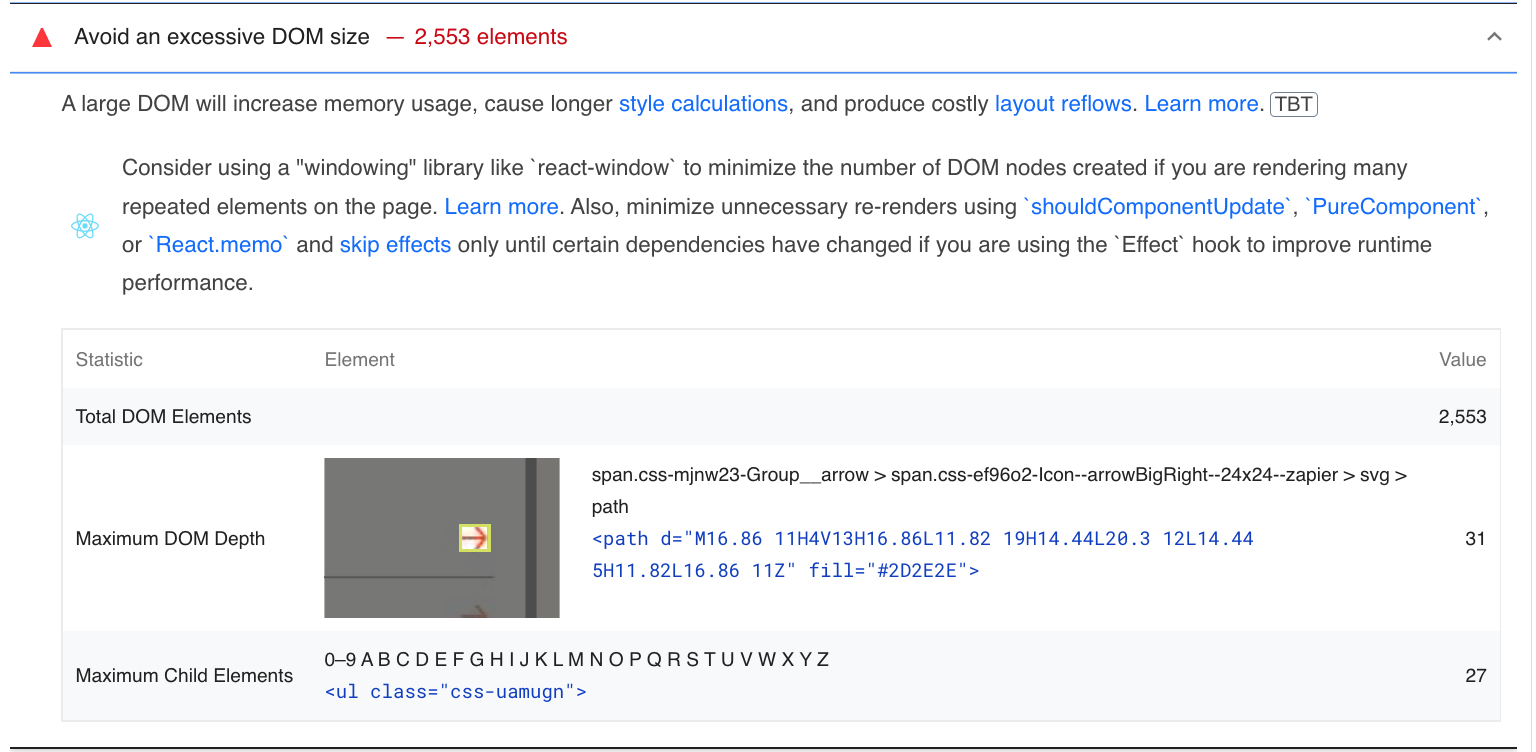
Similarly, the Diagnostics section of the report details best practices that the webpage does not appear to be following based on the page analysis.
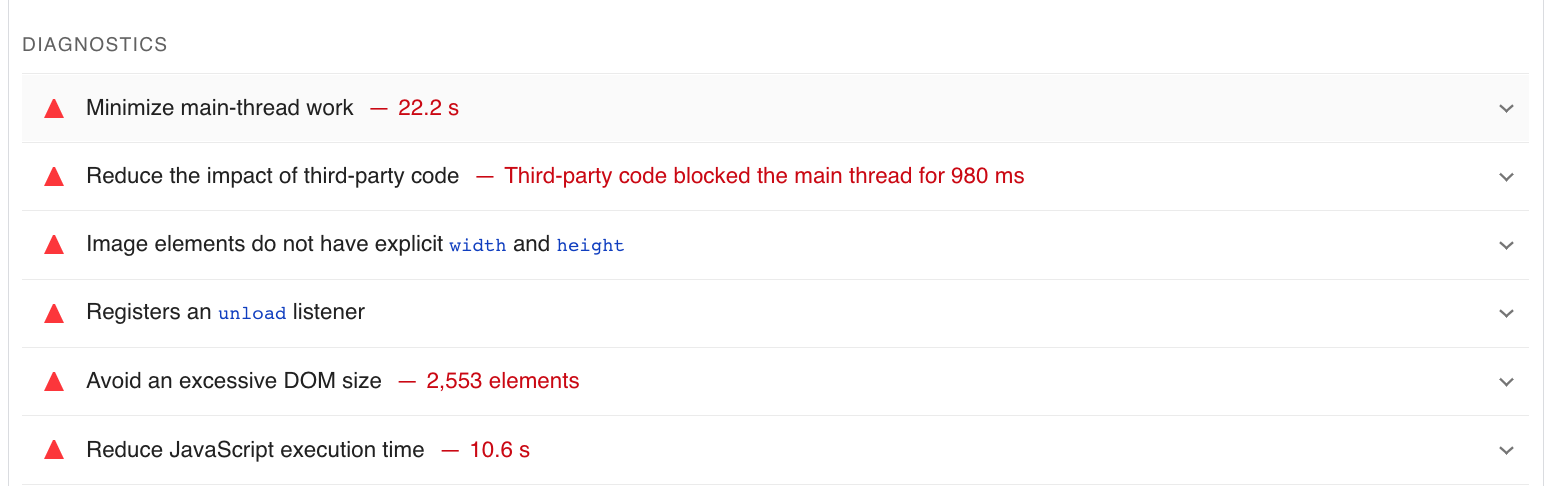
Select the dropdown arrow to get more information on the best practice and the specific data from the page’s analysis related to that issue.
The number of opportunities and diagnostics that may be listed in this section of the report is quite long and will depend on the specific issues that the PSI tool detects on the page.
Passed Audits
This section of the report basically lets site owners know what the page is doing right.
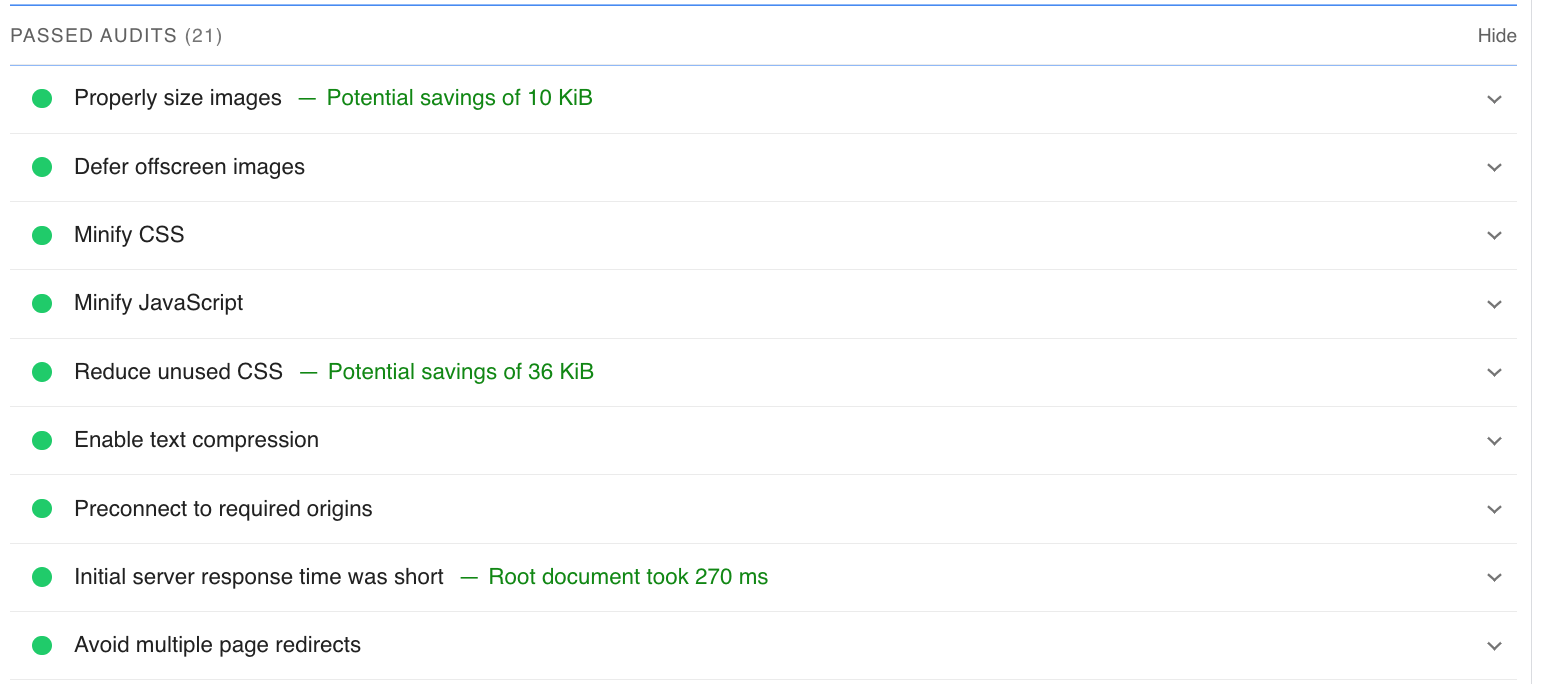
A long list of passed audits is a good sign and means that your page is displaying page speed best practices.
After The PSI Report & 6 Tips To Improve Page Speed
For those who are new to SEO, the PSI report can feel overwhelmingly technical.
But thankfully, Google is always thinking about the user and does a great job of providing detailed action items in the Opportunities section of the report.
Depending on the Opportunities and issues that the PSI tool identifies, the next steps for any site owner will vary.
However, some common issues impact page speed that webmasters tend to make.
The following best practices are some simple optimizations that can help improve speed and load times for the majority of webpages.
1. Optimize Your Images
More than any other content asset, images and videos are the most likely to produce issues related to a slower speed and load times.
Properly optimized images can go a long way in reducing FCP and LCP times and avoiding CLS issues.
Some best practices include:
- Resize and compress images.
- Set a specific height and width for each image.
- Use a content delivery network (CDN) to deliver your images.
2. Embed Video Content
If you have videos on your site that feature your products or services, avoid uploading them to your site.
Not only do they take up a lot of space, but they can also place stress on your web server if lots of users are playing the videos at the same time.
Instead, store videos somewhere else (like YouTube) and embed video content on your web page to significantly improve load times.
3. Avoid Excessive Redirects
Redirects can increase time-to-first-byte (TTFB) or the time between the request to the server and when the first data is sent back to the requester.
Avoiding excessive redirect chains can help you improve page speed and is a good practice for better SEO overall.
4. Choose A Faster Website Theme
Specific website themes are optimized for speed and can significantly improve your load times. Some themes are more lightweight, use GZIP compression, or have a more responsive design.
Check out this list of fast-loading WordPress themes, and consider whether you should update your theme to improve your PSI scores and overall SEO.
5. Use Asynchronous Loading For JavaScript
To keep it simple, asynchronous loading helps the web browser become a better multi-tasker.
In synchronous loading, the browser pauses all other actions while the JavaScript file loads.
Asynchronous loading lets the browser accomplish other tasks, like painting a table or loading a CSS Stylesheet, while simultaneously downloading the JavaScript.
This optimization requires more backend knowledge, so make sure you consult a web developer to implement this strategy.
6. Enable Browser Caching
This is a fundamental optimization that helps your webpages load faster for returning visitors.
With browser caching, images and videos will be stored on the user’s device and loaded from there the next time they visit the page.
Enabling browser caching requires editing (or creating) a .htaccess file, which is also better implemented by a skilled web developer.
Final Thoughts On PageSpeed Insights
Understanding PageSpeed Insights reports doesn’t require a technical SEO background.
Although specific fixes may require the assistance of your web developers, the PageSpeed Insights report will provide a clear roadmap to faster site speed.
If Google sees that you’ve taken the time to follow the recommendations in the report and provide searchers with a better quality web experience, they are more likely to reward you in the SERPs.
More Resources:
- How To Improve Speed And Performance For A WordPress Site
- How Quickly Should A Page Load For Optimal Experience?
- 18 WordPress Plugins That Will Speed Up Your Site
- Advanced Technical SEO: A Complete Guide
Featured Image: Roman Samborskyi/Shutterstock
