
Google has announced that the “average position” metric will no longer be supported starting in September.
Having been a Googler myself for almost a decade, I can only imagine the trepidation the Google Ads marketing team must have felt before making this announcement.
With the near continuous change that is part of Google Ads, any update could set off a firestorm in the advertising community.
The retirement of one of the oldest metrics certainly seems like it could have been received poorly.
But as it turns out, most advertisers are OK with the announced change, especially in light of some of the new position metrics Google has introduced to replace average position.
Here’s how the new “top” and “absolute top” metrics can do a better job than average position ever could when guiding advertisers to optimizing their PPC accounts.
The Metrics Replacing Average Position
First, here are the new metrics Google introduced in the past year that they feel can help advertisers better understand how their ads are doing, and that are hence seen as the replacement for the average position metric that is being retired.
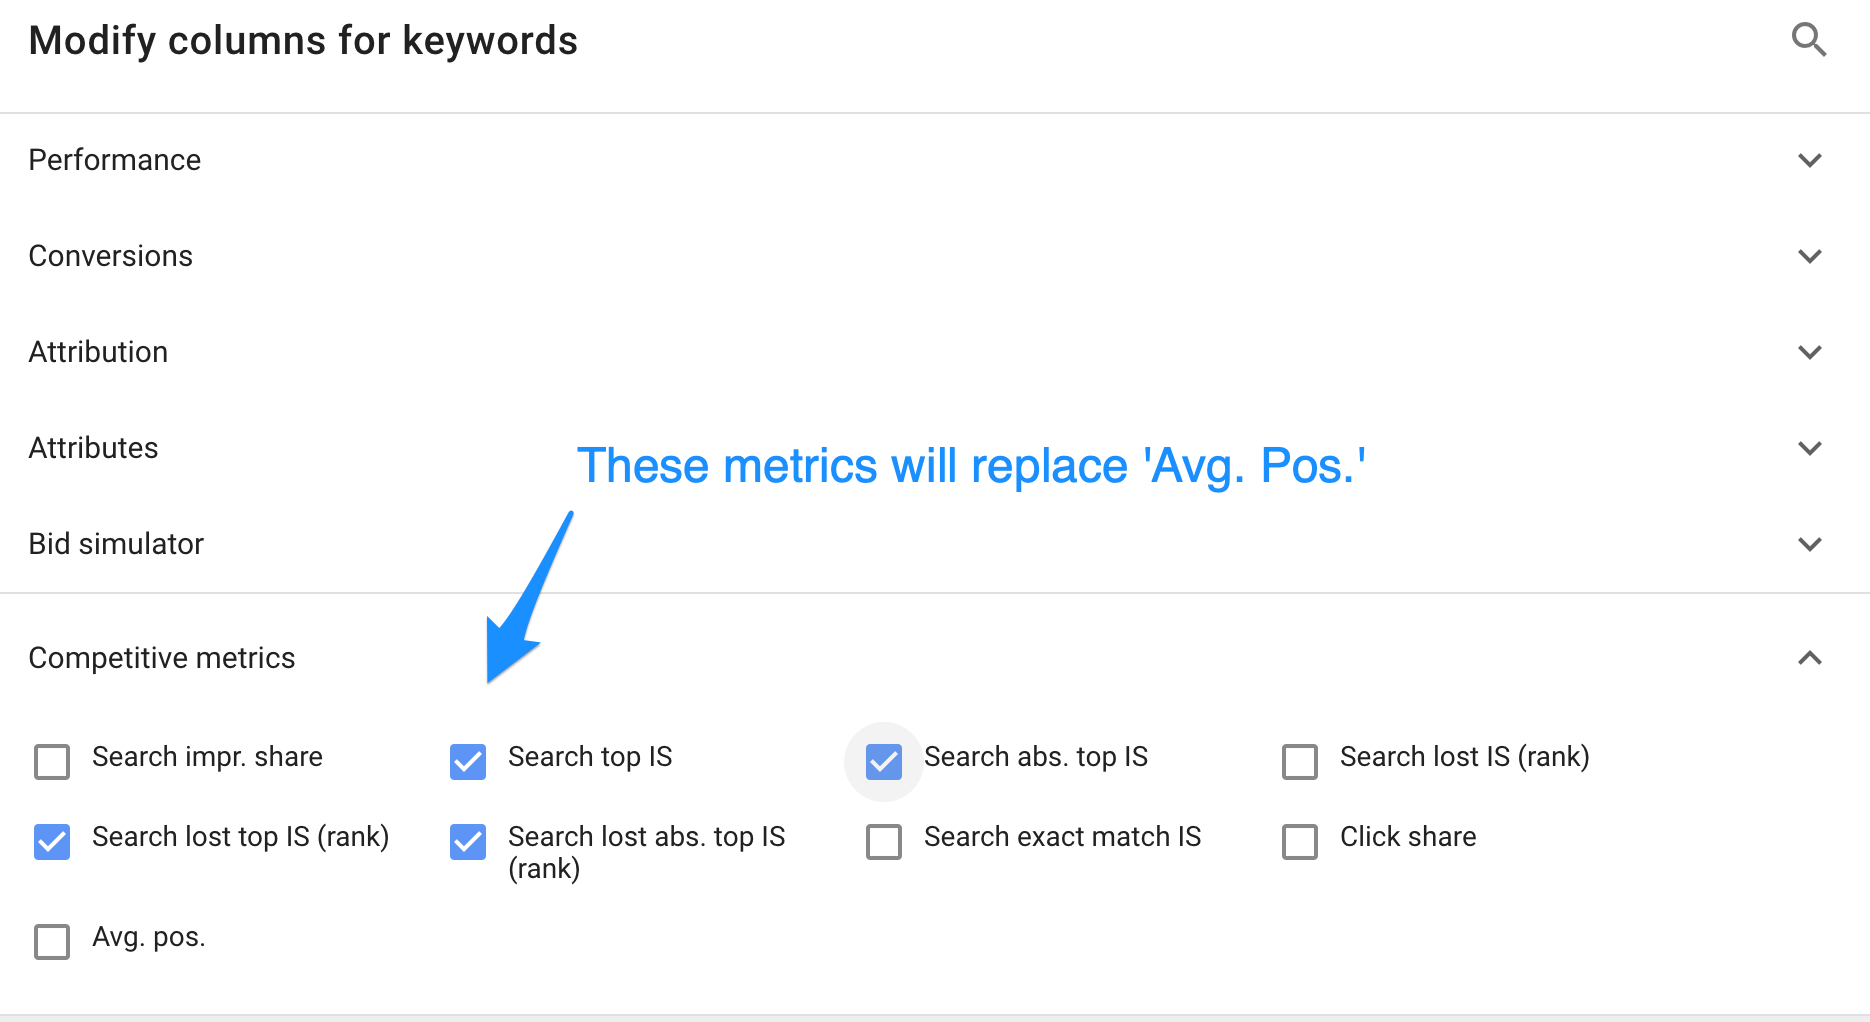
Metrics to Understand How Often Your Ad Was at the Top or Absolute Top When It Was Shown
- “Impr. (Abs. Top) %” – The percentage of received impressions that were at the very top of the page
- “Impr. (Top) %” – The percentage of received impressions that were above the organic results
Metrics to Understand Opportunities to Get More Impressions at the Top
- “Search absolute top IS” – The percentage of opportunities to appear at the absolute top you’re actually turning into impressions in that space.
- “Search top IS” – The percentage of opportunities to appear above the organic results you’re actually turning into impressions in that space.
Metrics to Understand What Optimization to Do
Once you know you’re losing top impression share, it helps to understand what can be done about it.
Just like we’re already used to with impression share (IS) metrics, Google gives us a breakdown of how much budget and rank are the issue for losing impression share at the top or absolute top.
- Search lost absolute top impression share (budget)
- Search lost absolute top impression share (rank)
- Search lost top impression share (budget)
- Search lost top impression share (rank)
Why Average Position Is a Risky Metric to Use
Average position is such a fundamental metric in search advertising that it’s likely been automatically included in many reports that account managers share with their clients.
But the fact that it’s included in reports doesn’t mean the metric is actually used to make any decisions.
And that makes sense because while it’s perhaps a nice indicator to keep some high-level pulse on the account, it can easily lead to confusion.
Here are three scenarios where average position tells an incomplete story and how an advertiser could use the new metrics to make a better decision.
Scenario 1: Only ads that meet the relevance threshold can show at the top
- Advertiser 1: position 4 (the final ad above the organic results)
- Advertiser 2: position 4 (the first ad below the organic results)
Two advertisers both see that their ad appeared in average position 4.0.
However, for one advertiser, that meant an impression above the organic results whereas for the other it meant an impression below the organic results.
The metric reports the same number, but clearly one advertiser fared better than the other.
This happens because not all SERPs show ads in the same places. How many ads are shown and in what locations on the page depends on whether those ads meet certain thresholds for relevance and ad rank.
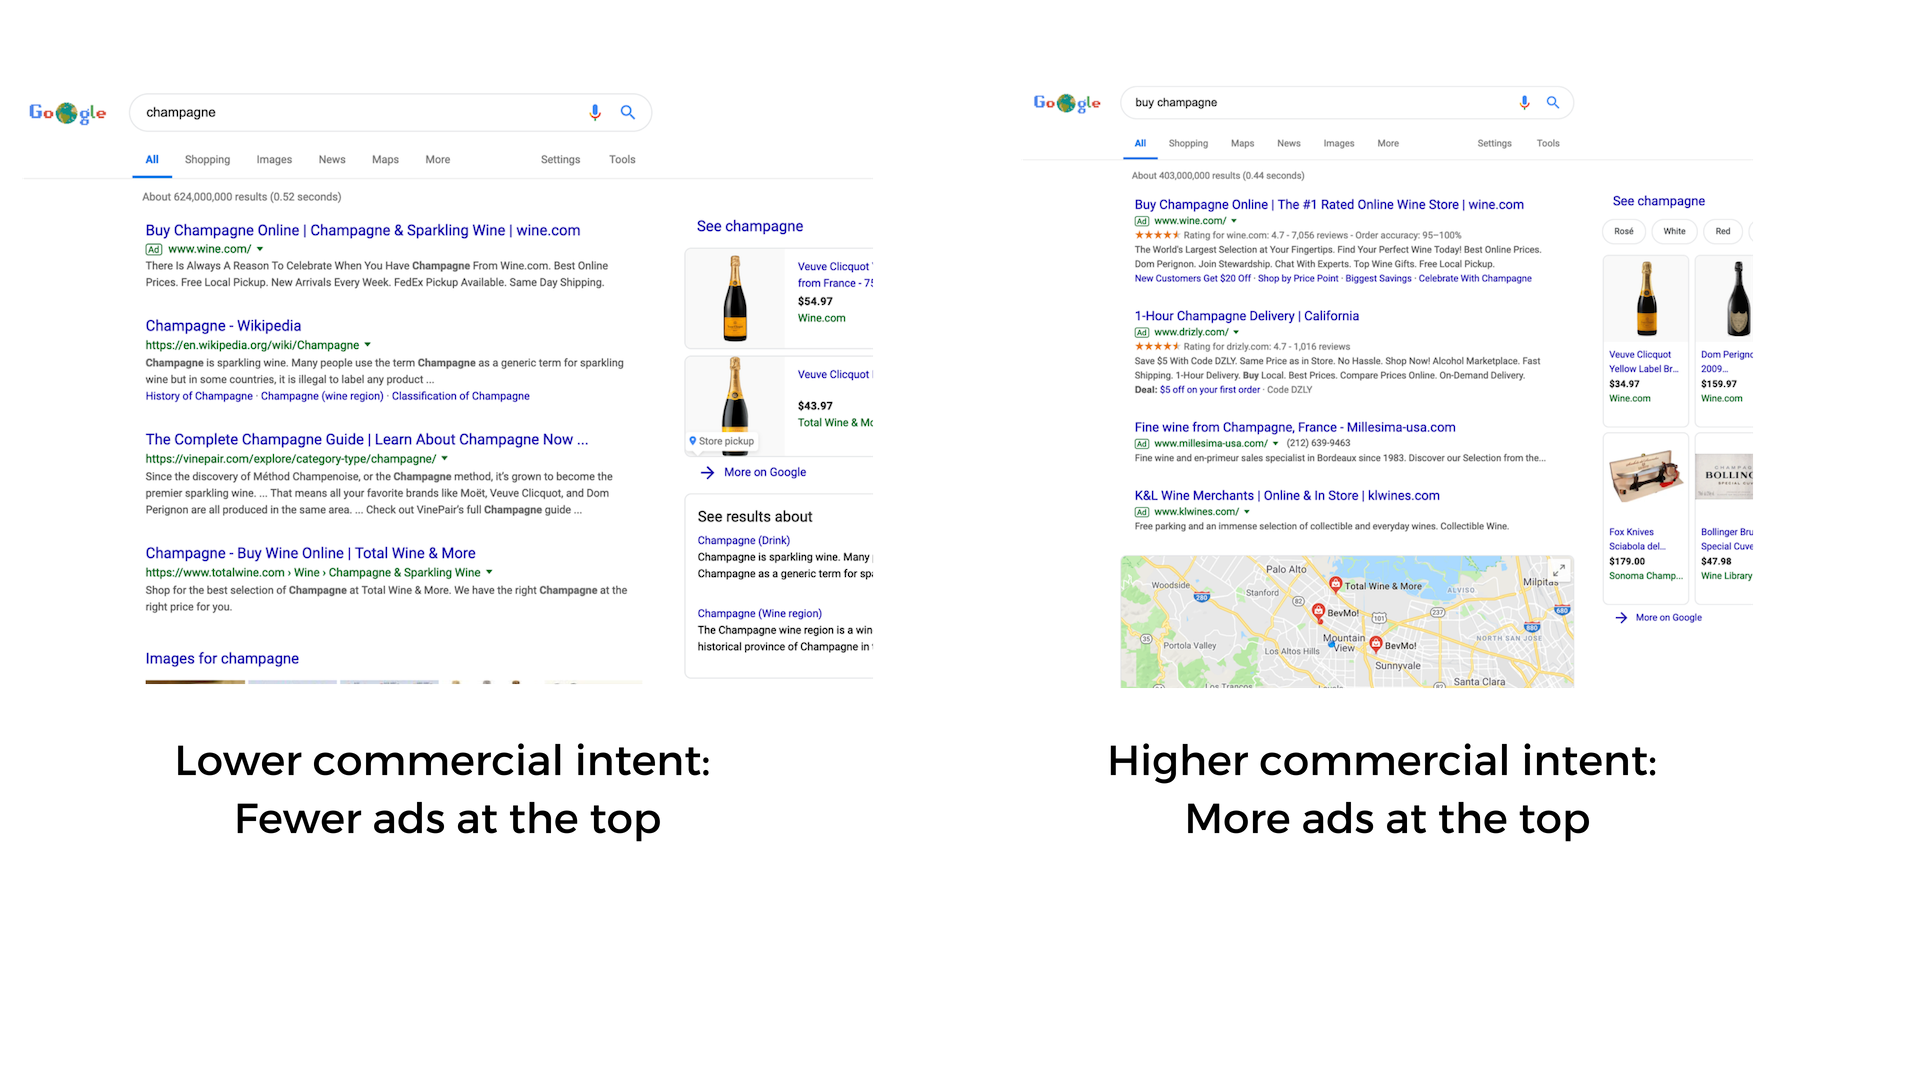
This is not simply a factor of the ads but also of the query. If you do a query that is less commercially oriented, you’ll see fewer ads than for a more clearly commercial query.
For example, use an incognito browser and search for [champagne] (might be commercial) and [buy champagne] (definitely commercial) and see how many ads appear and in what locations on the page.
If the search is probably commercial and some ads qualify to be shown, then relevance thresholds for top of page promotion come into play.
Relevance is calculated by the Quality Score system which tries to predict the click-through rate (CTR) of an ad. It tries to predict for every ad in every auction what is the percentage chance that the ad will get a click.
This prediction is position-normalized so it expects an ad that shows in the top position above the organic results to get a far higher CTR than if the same ad was shown as the last one below the organic results.
If the ad doesn’t meet a certain relevance or quality threshold, it may still be shown on the page, but it may not be promoted above the organic results.
This threshold exists because Google wants to show users the most helpful results and if ads don’t seem that relevant, they may be relegated to the bottom of the page.
How the New Metrics Help
Thanks to the new Impression Top (%) metric, an advertiser can better understand if their ads were good enough to meet the top promotion thresholds.
In the example above, the advertiser whose ad was in position 4 and shown at the top of the page would realize all was well.
The other advertiser with the same position of 4 would have found out that despite being the 4th highest ranked ad, they didn’t qualify for top of page promotion and could have gone on to improve their quality score.
Scenario 2: Averages Disguise the Real Truth
Three advertisers all see they got an average position of 3.0. But the average is actually quite useless at helping to understand what could be optimized.
Here are the positions in which the ads showed. All have the same average, but it was attained with very different individual placements.
- Advertiser 1: position 1 + 4 + 4 → avg. pos. 3
- Advertiser 2: position 2 + 3 + 4 → avg. pos. 3
- Advertiser 3: position 1 + 5 + not shown → avg. pos. 3
These advertisers could make better optimization decisions if they understood how their average position was attained.
How often were they shown at the top of the page and how often were they the absolute top ad?
How the New Metrics Help
Advertiser 2 never got the absolute top impression (they never were position 1 relative to other advertisers) and hence may want to optimize their quality score or increase their bid if they care about being the first ad shown above the organic results.
Advertiser 3 may realize that their Impression (Top) % is only 50 percent even though the average position of 3 may have led them to believe they usually were a top 4 ad and likely shown at the top of the page.
With this better knowledge, they can make a more informed decision about what to do next.
Scenario 3: Average Position Is Only Reported When an Impression Happens
In this scenario, two advertisers both get average position 1.0, yet only one of them consistently shows their ad. The other is missing out on a lot of impressions but when they get the impression, it’s in a great position.
- Advertiser 1: Not shown + Not shown + 1 → avg. pos. 1
- Advertiser 2: 1 + 1 + 1 → avg. pos. 1
This is once again an example of how average numbers fail to tell the whole story.
How the New Metrics Help
Advertiser 2 can now understand that they have a search top IS of 100 percent. They are turning every opportunity to show an ad into an actual impression at the top of the page.
Advertiser 1, on the other hand, sees that their search top IS is only 33 percent. They are missing a significant number of opportunities.
With the Search lost top impression share (rank) they can better understand in how many cases their rank is the issue and try to address problems with QS and bids.
When You Raise Bids to Get More IS but Instead Get Lower IS
Something that PPC experts probably already know but that might be surprising to newer account managers is that raising a bid to fix low top IS may actually exacerbate the problem further and increase the IS lost.
This is because a higher bid can make the keyword eligible to participate in more auctions and in those new auctions, it may lose more top impressions than it did in its current set of auctions.
It’s similar to how a decrease in bid sometimes makes the CPA worse because it makes keywords eligible for fewer good auctions where the conversions may have been more frequent.
Conclusion
There are a few months left to transition from using average position to the new top impression metrics. But given how misleading average position can be, it’s probably worth considering making the transition as soon as possible.
More Resources:
- 5 Useful & Easy Google Ads Metrics You Should Monitor
- The 10 Most Important PPC KPIs You Should Be Tracking
- PPC 101: A Complete Guide to Pay-Per-Click Marketing Basics
Image Credits
All screenshots taken by author, March 2019
