
Building for the web is harder than ever. Better mobile technologies and web standards roll out every day.
So, how are websites keeping up?
Unlimited data plans are a luxury. But how much data gets downloaded when visiting a website, and what’s the environmental impact of our web today?
Google search engine’s mobile-first index prioritizes websites that deliver buttery-smooth page experiences. Does your business ship with search discoverability in mind?
Developers have a lot of influence on how successful a site’s performance is on Google – but do they always focus on search?
Good developers strike a balance between aesthetics and website performance. Is your team setting web performance budgets with measurable goals?
In this piece, I explore ways to improve communication with your dev team. Chrome’s Developer Tools have the data that devs need to fix issues faster.
We’ll see how the Canary browser is a great place to start a technical SEO audit.
I’ll share new feature updates SEO pros should be testing today.
How Chrome Releases New Features
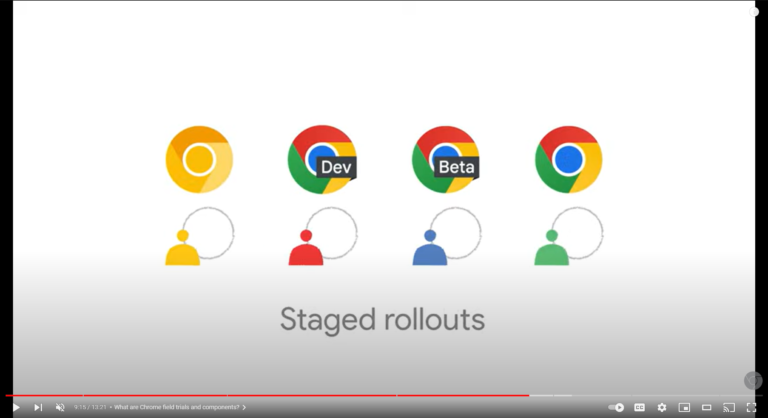
Canary is the early-release version of Google Chrome.
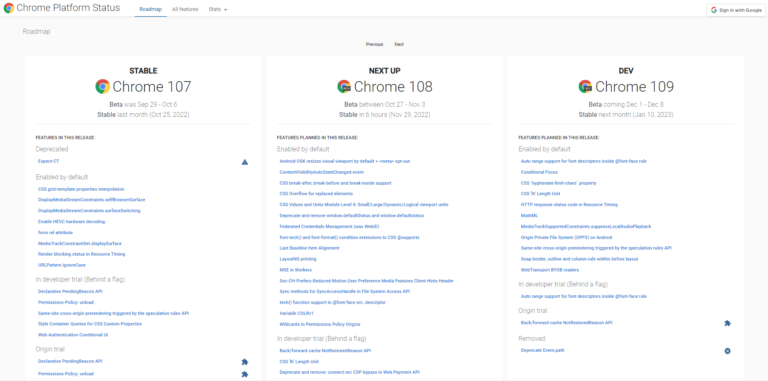
Google releases its features in four stages it calls release channels. The channels are Canary, Dev, Beta, and Stable. Chrome Canary, Beta, and Dev can install side-by-side on Android, Mac, Windows, and Linux.
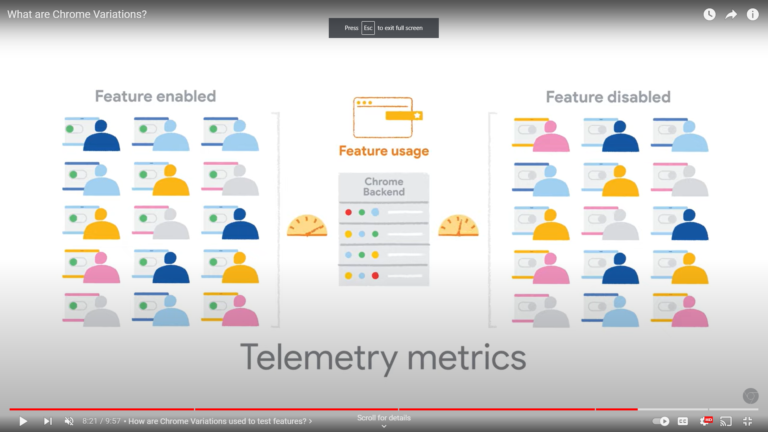
Chrome engineers test new features on real users to see if they run into any issues before releasing the feature to the next channel.
Canary gets the updates first with nightly releases at 2 AM PST. You get the latest features, browser experiments, and web platform APIs. Updates also include bug fixes, browser improvements, code clean-up, safety, and security.
Features get iterated on over a six-week release cycle before going live to all 3.2B users.
Users get to test upcoming features on their websites, web apps, content management system (CMS), themes, and plugins. They report bugs and give feedback on new features.
Not all features make it past Canary. The experimental browser is used by browser enthusiasts, developers, enterprise users, and technical SEO pros.
Debugging SEO With Developer Tools
Chrome DevTools is a diagnostic browser toolkit for testing websites inside the browser. Developers test, build and maintain websites with instruments that measure page speed performance.
Browser tools test website performance in different conditions. It gives you a head start on getting websites fixed.
For devs, the tools are almost as important as the browser itself.
No need to wait for a long and expensive crawl to finish; You can find technical SEO issues and file them right away with Canary.
Setting Up Chrome Canary For SEO
Websites need to perform well across different locations, devices, and networks. DevTools let you simulate browsing at different places and at slower speeds.
Set Canary up to browse as the Googlebot user agent in Chrome’s settings.
Take a look at what Google sees when it loads a site.
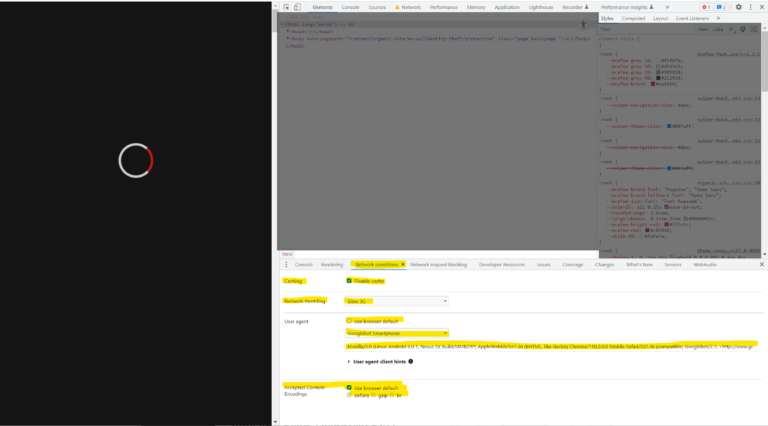
Don’t let browser extensions interfere with the accuracy of your tests.
Download Canary as a separate browser dedicated to technical SEO auditing and debugging.
Plug And Scan Technical SEO Troubleshooting In Canary
Chrome DevTools lets you look under the hood of a website.
It tests and prints detailed performance reports in seconds – but it can overwhelm you at first.
Technical SEO pros inspect the web in the same way that mechanics troubleshoot cars; We plug and scan sites into browser tools and analyze how they load and respond.
With Canary you can record and measure key moments like page loading, navigating, and user interactions. You can also get status codes, Core Web Vitals (CWV) readings, waterfall and timeline charts, and much more.
Sometimes troubleshooting in Canary only points toward a symptom instead of the problem. More capable tools offer advanced readings, yet the troubleshooting process remains the same.
Technical SEO Auditing With Google Chrome Canary
Google wants websites to load fast, but a page won’t rank well if Googlebot doesn’t understand the main content.
DevTools can measure and help debug website delivery and performance.
Audit and debug Javascript, CSS, and CWV issues with Canary.
Use DevTools to check your pages and templates right away.
It helps to see how a site is guiding visitors and Google’s crawlers. Check for internal links, content duplication, broken links, missing images, and 404 pages.
Check your on-page metadata to see if it’s all there and optimized. Look for structured data problems, and investigate content Google didn’t index because of JavaScript rendering problems.
Throttle network settings to examine latency across different web conditions, and analyze the website run time performance to identify bottlenecks.
Look for opportunities to optimize your content delivery.
Check how a site’s resources load and render. Not all resources are equal – better resource delivery can improve the user experience.
Using DevTools In Canary For Technical SEO Website Audits
The following are some of the popular use cases in DevTools for SEO pros:
Lighthouse
- A score-based audit of performance, accessibility, best practices, SEO, and PWA.
- Actionable insights to improve performance.
Network Panel
- Search engine crawler emulation.
- Network condition and speed simulation.
- Network requests and connections information per frame.
- Resource loading and rendering information.
- Waterfall chart visual of website resources as they download.
- Server responses.
Performance Panel
- Records the browser rendering process of a website.
- Shows how the site got stitched together after downloading and evaluating the files.
- Waterfall visualization of the runtime of each frame as it loaded.
- Helps understand the Critical Rendering Path.
- Identifies performance bottlenecks and resources that impacted the Core Web Vitals score.
- Check for dropped frames or “Jank.”
Other SEO DevTools Workflows
- Disabling JS setting to debug Javascript SEO issues.
- Mobile device testing.
- Accessibility Checks.
- Remote Headless Browser Testing.
- Programmatic DevTools browser testing and automation.
Do You Need Help Making A Business Case For SEO?
Use data to prove the value of technical SEO.
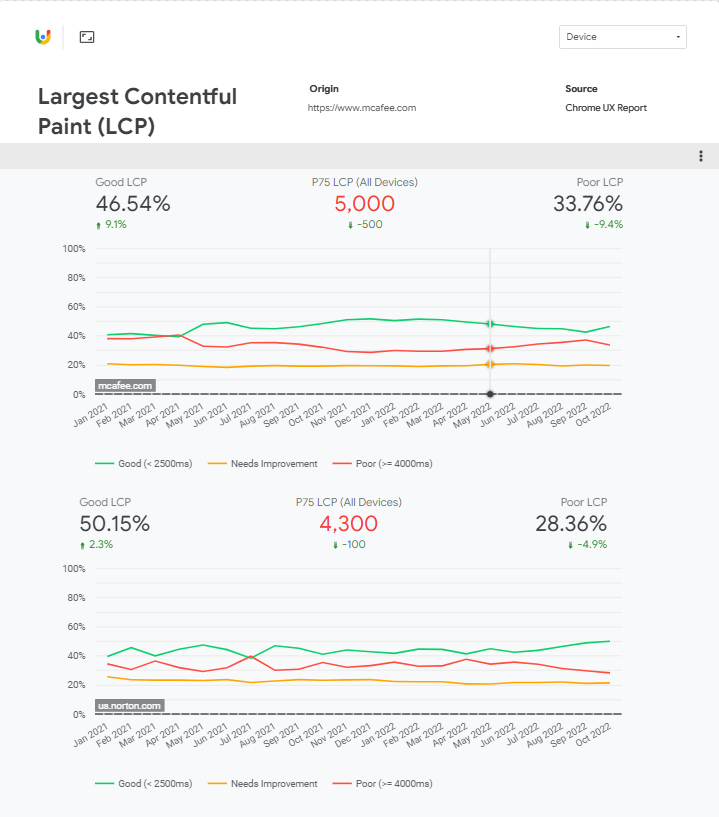
Benchmark site performance and compare the content delivery against your competitors.
Use Canary to keep up with your site as it changes.
Chrome Browser Development Ecosystem
Chrome’s software development strategy runs several rolling and side-by-side deployments. This method lets it run A/B and capacity testing.
Chrome’s engineers automate feature rollbacks and avoid cold starts, and downtimes. It’s a simplified process that gives granular browser version control.
Make sure to track features as they evolve across each channel. Read feature abstracts and understand what business problems they can solve.
Join the conversation.
Chromestatus.com tracks features as they progress. Subscribe to the Chrome Developer’s blog to keep up to date with the Chrome tools and libraries.
Experimental DevTools Features In Chrome Canary
New Performance Insights Panel In Chrome DevTools
Professional athletes watch gameplay films to understand their performance. In a similar vein, the Performance Insights panel lets you playback and share recordings of a webpage load.
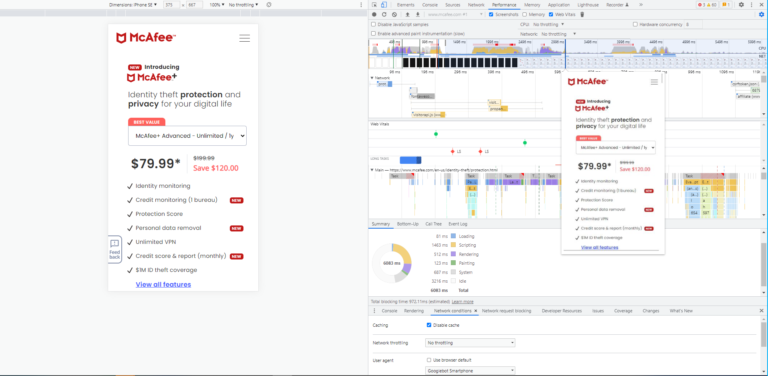
The new panel shipped with Chrome 102. It’s a streamlined update of the Performance panel which gives insights without requiring a deep technical understanding of browser rendering.
The panel has a simple UI for measuring page load CWV performance. It gives actionable page insights, finds render-blocking requests, layout shifts, and more.
Future releases will expand use cases like testing interactivity.
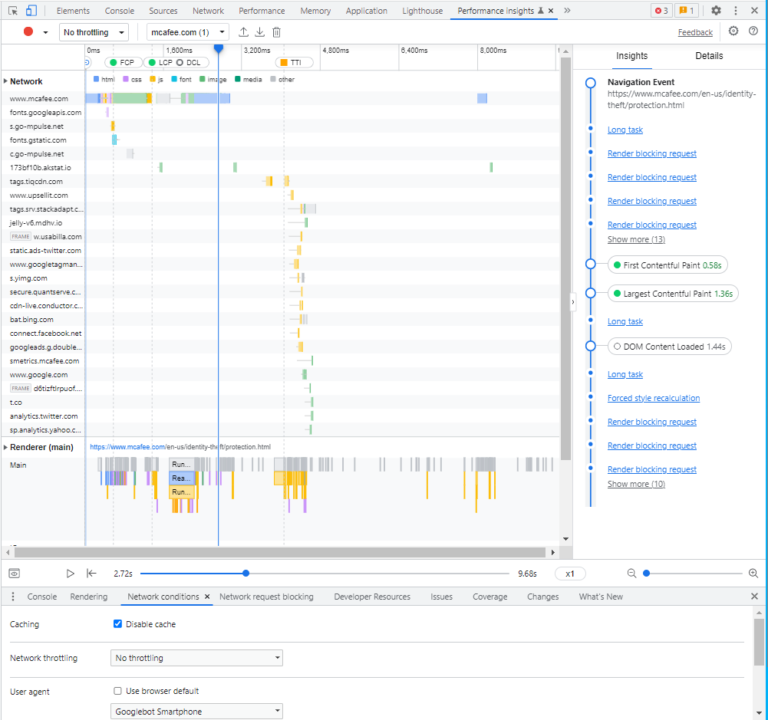
Share network delays in your critical rendering path, and show GPU Activity for dropped frames that cause your site to lag.
Save your devs some time and attach Performance recordings when submitting tickets. Show them exactly what’s wrong with your pages to inspire action right away.
New Recorder Panel Updates In Chrome DevTools
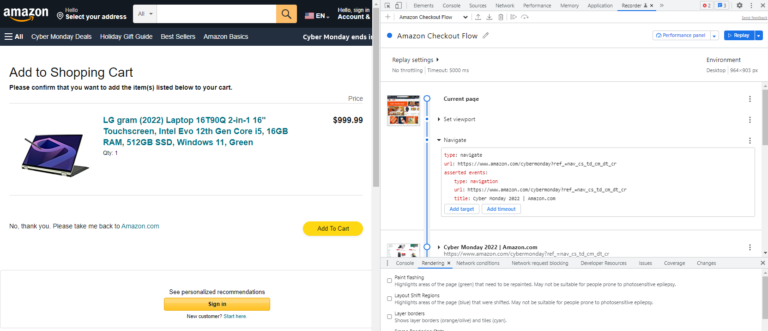
The Recorder panel is an experimental feature that gives user flow insights.
It records runtime performance for multi-step user flows via the Performance Panel.
Use this feature to audit your primary website user flows performance.
Most users interact with your site after it loads. So, it’s a good idea to record user interactions like clicking, scrolling, and navigating. Record and edit your user flows for simulated network conditions.
Also, record an eCommerce checkout flow, and measure checkout performance by setting up different add-to-cart steps.
You can also script a page load and button or link click interaction and measure its CWV.
Google lists support for several user input properties.
It auto-detects ARIA and CSS selectors. You can also add custom data-* selectors used by popular JS and CSS frameworks. The latest Chrome 108 release expanded support to XPath and text selectors.
Pages can load fast but run slowly – and a poor user experience has an impact on the perception of your brand.
Make sure visitors aren’t abandoning a site because it froze when they clicked around.
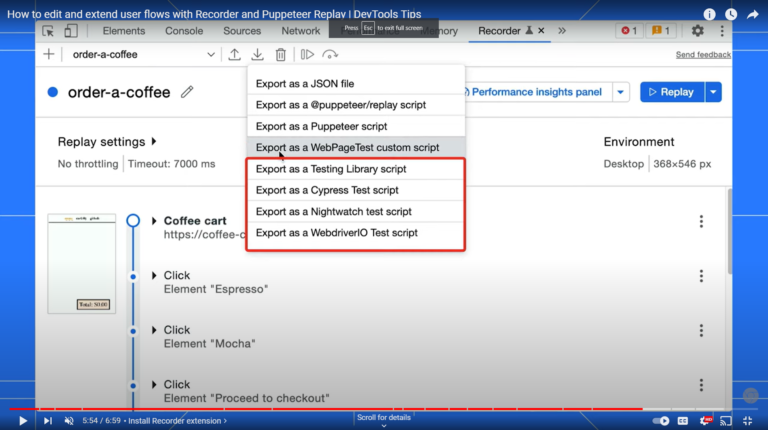
Exporting Recorder Panel Scripts For Third-Party Playback
Export your main user-flow recordings into different formats for popular front-end testing tools.
Use the JSON exports to edit flows and import them back into Recorder and watch replays.
Export custom scripts with Chrome extensions.
Support exists for exporting recordings into Google’s Node.js Puppeteer library. You can also use them with Cypress, Nightwatch, Sauce Labs, and TestCafe.
Automate Headless Browser Testing With Puppeteer
Headless browsing is when you visit a website without the browser’s UI. You can launch Chrome in your computer’s background and operate browser tools.
Puppeteer Chrome is an API that runs over the DevTools protocol. Puppeteer can also run browser tests without using the Chrome UI via headless mode.
Set up automatic periodic CWV testing, and grab screenshots of your pages loading on different devices and networks. Devs automate form submissions and UI testing.
Automate your page speed performance reporting.
Chrome lets you work smarter, not harder. Devs save a lot of time, and so can you when performing technical SEO audits with Canary.
Automate Timeline Traces For Synthetic Testing
Synthetic tests are timeline trace recordings from different browsers, devices, and networks.
Synthetic simulates performance testing for your user’s real-world experience.
Set up user flow recordings in the Recorder Panel and export the script into a WebPage test. You can export custom Recorder scripts via the WebPage Test Recorder extension.
Web Platform API Testing On Chrome Canary
The Chrome engineering team publishes experimental APIs.
Third-party tools and businesses depend on them for testing new features. Origin Trials are like Feature Flags – they toggle off and don’t always make it to Stable Chrome.
The feature proposal documentation gives context and explains how they can help users.
Check the status of Chrome Feature Flags and APIs on chromestatus.com.
Developers use APIs for automated web performance testing. Real User Monitoring (RUM) analytics providers use Chrome’s APIs to track and report real users’ CWVs.
Chrome is built on the Chromium open-source project and bugs are tracked on the Chromium bug tracker.
Back/Forward Cache Testing For Smooth Page Navigation
Modern browsers recently added a feature that loads pages faster using a new type of cache.
The Back/Forward (bfcache) cache captures a snapshot of the page in the browser’s memory when you visit.
It reloads pages without making a new network request to your server.
Users that navigate back to a previously visited page on your site get a quicker page load experience. Loading from the bfcache is faster than the traditional HTTP cache, as it saves your visitor from downloading extra data.
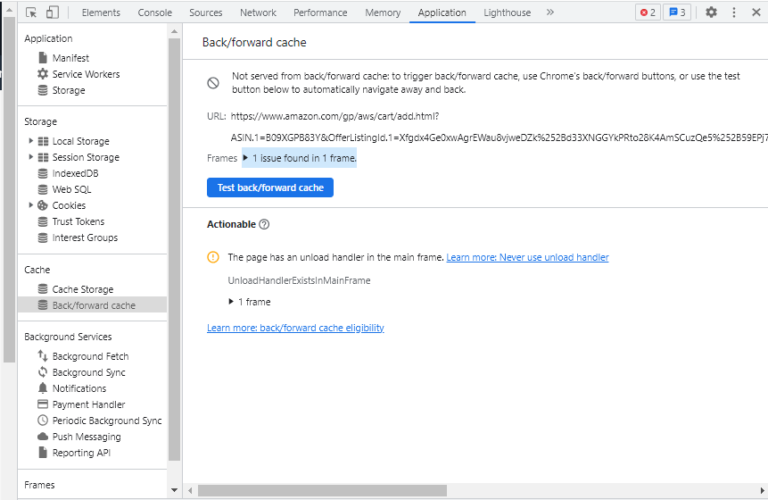
Chrome 96 Stable release shipped the bfcache test in the Application panel. It checks pages if the Back/Forward caching is being deployed.
Fixing Analytics Underreporting From Bfcache Browser Feature
The bfcache browser optimization is automatic, but it does impact CWV. Analytics tools may underreport pageviews because a page gets loaded from its bfcache.
Is your analytics set up to detect when a page gets loaded from bfcache?
Test your website for bfcache to make sure your important pages are serving it.
Keep an eye on when your pages no longer serve from the bfcache.
New Update To The Back/Forward Cache Testing API
The new NotRestoredReason API feature improves error reporting for bfcache issues. It helps understand why a page isn’t serving the cache to returning visitors.
The API will ship with Stable Chrome 111.
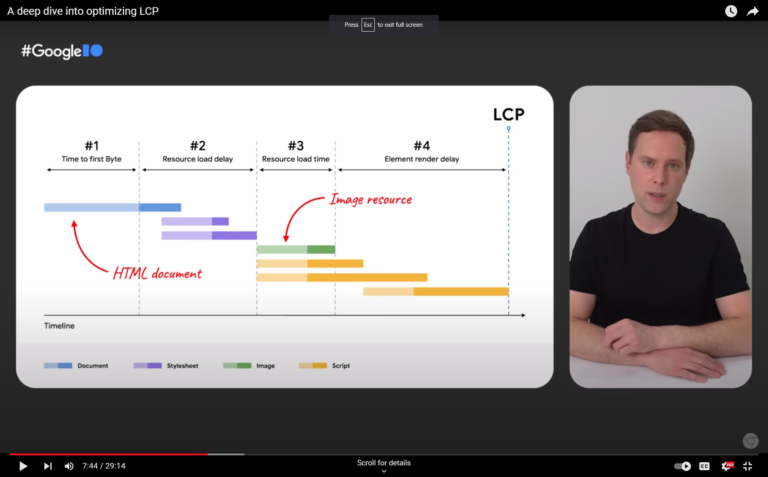
Identifying Render Blocking Resources With The Performance API
RUM tools did not have a simple way to check if a resource was blocking rendering.
Chrome 107 shipped a new feature for the Performance API that identifies render-blocking resources. This update helps RUM users save time and optimize rendering paths.
The Performance Panel helps identify render-blocking resources like CSS, which delay the loading of a site.
When a browser comes across a stylesheet it holds page loading up until it finishes reading the file. A browser needs to understand the layout and design of a page before it can render and paint a website.
Devs can help minimize re-calculation, styling, and repainting to prevent website slowdowns.
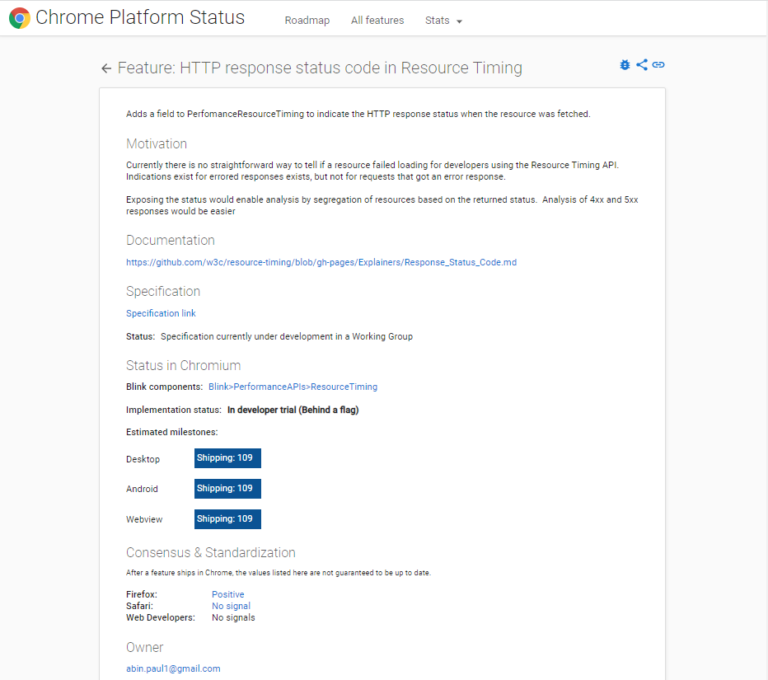
Improved HTTP Response Status Codes Reporting For The Resource Timing API
The Resource Timing API did not support failed response code reporting. Chrome 109 will be shipping with a new feature for the Performance API that captures HTTP response codes.
Developers and SEOs can now segment their RUM analytics for page visits that result in 4XX and 5XX response codes.
The Future Of Core Web Vitals Is Here
Google owns 86% of the search engine market share, and Chrome commands 66% of the global browser market share.
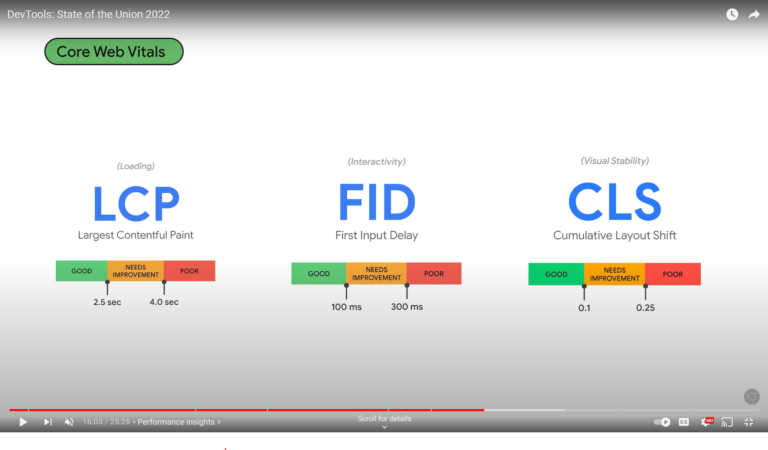
Google launched its web performance Core Web Vitals (CWV) metrics in 2020 to help quantify the user experience on a webpage.
First Input Delay (FID) is a CWV that measures a page’s interactivity.
Since it was first launched as a metric, people have been improving the FID of their websites – and today, they are crushing it. 92% of websites now have a good FID score for mobile users, and 100% for desktop users.
But FID only tests for the first user interaction. It does not measure the user experience beyond the initial page load.
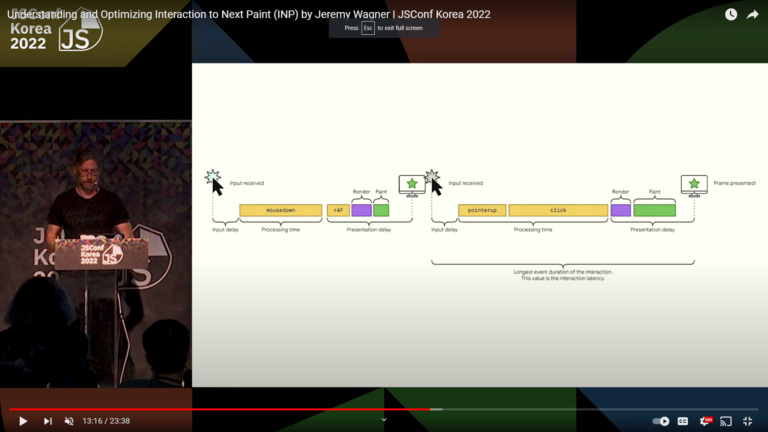
According to Jeremey Wagner,
“Chrome usage shows that 90% of a user’s activity happens after the initial page load.”
Google recently launched the experimental Interaction to Next Paint (INP) metric at Google I/O 2022 – and it could soon replace FID as the CWV interactivity field metric.
INP paints a more accurate picture of the interactive user experience. It captures clicking, tapping, keyboard, and scrolled tabbing activity, and also measures the page’s average response time for any interaction that occurs.
The HTTP Archive reported a stronger Total Blocking Time (TBT) correlation with INP over FID.
Google continues to experiment on and refine INP.
INP-optimized sites will have a competitive advantage when Google evolves past FID.
Is your website ready for when INP becomes a CWV and affects ranking?
Closing Thoughts On Using Chrome Canary For SEO
In order to perform well and score high on usability, a site must look, feel, navigate, and load fast – and also be accessible. Delightful design and fast browsing allow for better visibility on search.
We’re seeing better-looking websites now, but it can sometimes come at the cost of a good user experience. Dev teams need to consider the environmental cost of shipping bloated websites.
A website loads the way our developers build them.
Devs have to take into account design, content, performance, accessibility, frameworks, networks, and devices. They need to build sites while balancing priorities from marketing, management, and SEO.
SEO pros and devs can work together to drive better website performance. Google’s out-of-the-box tooling offers a great starting point for technical SEO auditing.
DevTools helps cut down time on debugging and troubleshooting, while Canary lets you streamline CWV reporting with browser automation.
Find and share the data your devs need to get started fixing SEO issues right away.
More resources:
- How To Use Chrome UX Report To Improve Your Site Performance
- 9 Chrome Extensions To Increase Your Productivity
- Advanced Technical SEO: A Complete Guide
Featured Image: Studio Cantath/Shutterstock
