Many of you may have noticed a little checkerboard in the corner of your Google Analytics screens. This fairly subtle icon has been showing up more and more in the past few months, and is an indication of the measures Google is going through to use sampled data for Analytics reports. At first, it appeared only on screens with advanced segments turned on, but recently begun appearing even on reports and data views with low sample sizes. Of growing concern is the fact that sites with larger traffic are forced into sampling mode for any report, and the default accuracy is balanced in the middle between “Faster Processing” and “Higher Precision.” On a website with lots of traffic using multiple months of data, a custom segment, even the “Higher Precision” setting can yield data reporting that is based on less than 25% of the actual traffic.
When Big Data Means Shortcuts
What we have here is a Big Data problem. Google has an unbelievable amount of data collected in aggregate with Analytics properties worldwide, and it is understandable that the load on their data centers is immense. In order to save processing power and reduce load times, data sampling can be used in reports. In theory, using sampling should not reduce accuracy, because the data must be statistically significant and within a measured probability of accuracy. If you have a problem with sampled reports, you can pay six figures for enterprise-grade Analytics, but most businesses simply cannot afford premium Analytics.
Beware the Checkerboard
While in theory sampled reports should be as statistically accurate as unsampled reports in Google Analytics, we should question the assumption before trusting it. In real world reporting, there is actually a wide range of variation from one page refresh to another during the course of normal report viewing. This level of variation is not acceptable from an accountability standpoint, as pay per click advertising, marketing, and e-commerce managers require accurate data for making key decisions for marketing campaigns and strategies.
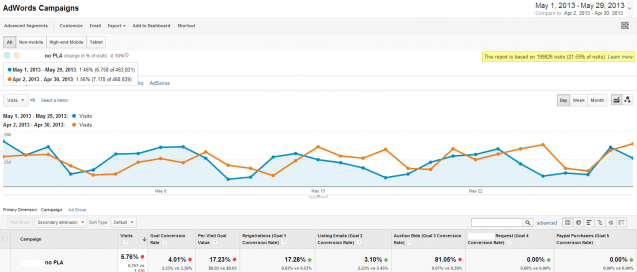
Let’s look at the real world example below. In this report, two date ranges are being compared and a custom segment to remove product listing ad campaigns is applied. The traffic for each date range is over 460,000 visits.
The Default Sampling
In the first view of the report, the data sampling rate has been applied by default, which based the report on 21.59% of visits. Note that this is total visits combined for both date ranges. The report calculates that the conversion rate has fallen 4.01% month over month, from 3.36% to 3.23%. Note also that the “listing emails” goal rose 3.10% month over month.

The Adjusted Sampling
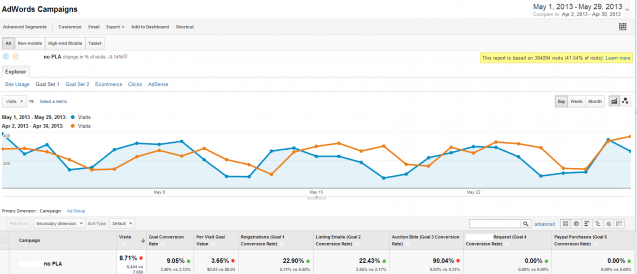
Now look at this report, where we have chosen the furthest setting on “Highest Precision” for sampling. It still samples the data, but it gives us a report based on 41.54% of total visits, which is nearly double the default sample size. Now notice that the conversion rate actually rose 9.05% instead of falling 4.01%. The “listing emails” goal now shows a 22.43% increase month over month, which is quite a bit different than the 3.10% reported earlier.

This is just one of many comparisons, but it shows the radical difference that data sampling can have on your Analytics reports. The more visitors your website has, the more often sampling will occur. In the example above, even selecting the maximum accuracy did not yield a result with all visits included. On smaller traffic websites, sampling may have a negligible effect.
Conclusions
All users of Google Analytics need to be careful about sampling settings when viewing a report. Sampling will happen more often for larger traffic websites and when you request more data in a report. You may notice that sampling will be 100% on a report for a month of data, while it could be sampled at 60% for a six-month view. Agencies need to educate their clients about the differences and potential discrepancies, and in-house marketers need to educate other staff. Sampling may be a significant push for high volume sites to upgrade to Premium Analytics, but as long as sampling is understood and the potential pitfalls are considered, free Analytics will likely remain the standard for websites.


