Interactive live content is becoming an increasingly popular form of content marketing for site owners. With the ever-increasing need for brands to engage their audiences with high quality content, interactive live data to create content is becoming a weapon of choice for many brands to stand out from the crowd. But what makes live content so effective?
Using live data to produce agile content
The beauty of using live data when producing interactive content is that it shows a snapshot of what’s happening right now at any given moment. With Google continuing to give priority to fresh high quality content, live data-fed content provides a creative solution to keeping your content relevant.
Live content also lends itself fantastically well to producing real-time content around live events, such as the Olympics, the Royal Wedding, or the US election.
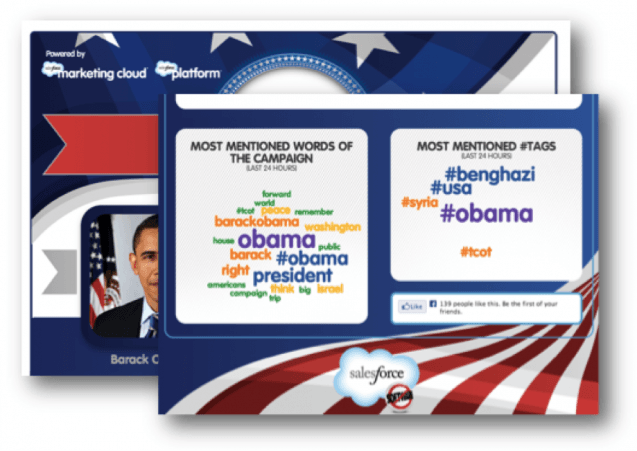
Salesforce launched this interactive infographic last year around the US election using live data feed from their Marketing Cloud platform. The infographic is still running today using data from the past 24 hours.
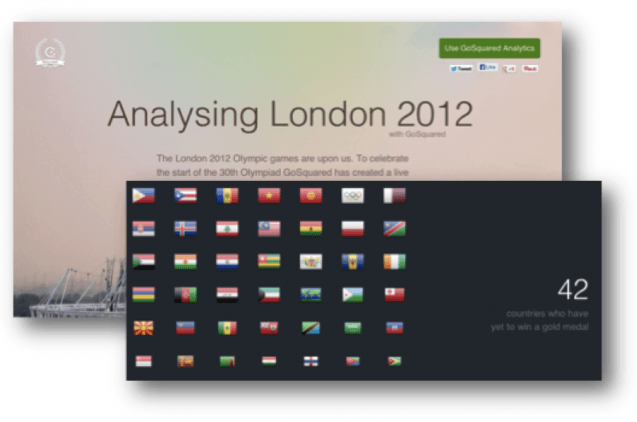
GoSquared Analytics produced a live interactive infographic on the London Olympics. As you scroll you can see a live update on how may countries were yet to win a gold medal, how many medals were won in total by different countries, the estimated viewership of the games, and more. Of course, this is no longer updating in real time, but it has become a nice citable piece of content that will forever remain accurate.
One of my favorite live data visualizations, is Bruno Imbrizi’s real-time visualization on the complicated London Underground system. While not necessarily created for content marketing purposes, it shows the potential of what can be done at the intersection of live data feeds and intelligent data visualization.
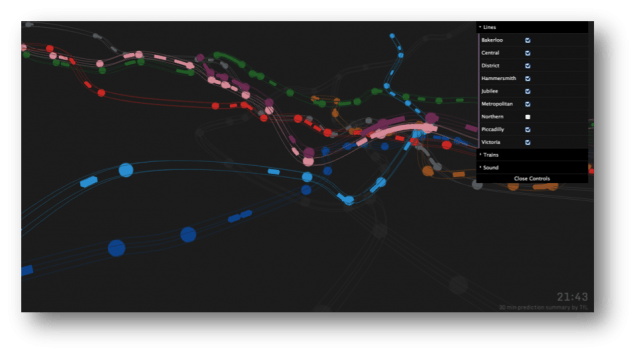
The visualization shows (in real time) where different tubes are on the various London Underground lines using live data from TFL. The ability to zoom, pan, and change your vantage point is just the icing on the cake!
How is this content created?
While there is no end to the number of ways in which this type of content can be created, and, surprisingly, it is not as hard as it may seem. As someone without a programming background, I’ve managed to find a few resources that have enabled me to produce a handful of interactive infographics with only basic HTML, CSS, and PHP coding knowledge.
The first lifesaver for producing interactive live content is a tool called Datownia. This service enables you to turn any data set into an API by dropping data into an excel spreadsheet and then putting the spreadsheet in a Dropbox. It’s extremely simple and opens up a huge range of possibilities – you then just need to update the spreadsheet, which can be done automatically or manually. The point of Datownia is that it means you’re not limited to using pre-existing APIs anymore.
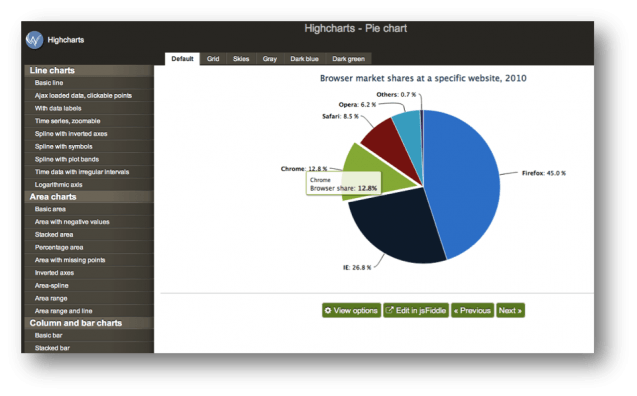
My next recommendation would be to use a HTML5 chart tool. Instead of hand coding beautiful charts, services like Highcharts and KoolChart enable you to create embeddable charts to use in interactive infographics using a WYSIWYG interface.
While not necessarily linked with the content being live, one of my favorite plugins when creating interactive content is John Polacek’s Scrollorama plugin. This enables you to bring your data to life with awesome transitions.

Why Create Live Content?
While all of these examples are inspiring and show the potential of what is currently on the cutting edge of digital content creation, the downside is that interactive live content is time-consuming and expensive to create. Is it worth the investment?
For me personally, I believe interactive content provides a fantastic opportunity to stand out from the crowd and build a compounding collection of evergreen content. By its very nature, live content does not go out of date – so you don’t have to worry about constantly running on the content treadmill. Instead, you build up a bank of evergreen content that will continue to show results over the years.
From a search perspective, this type of content is also fantastic. One of the major setbacks with traditional ‘static’ infographics is that the content is embedded in an image, and therefore unable to be crawled by Google. With interactive live content, not only is the content constantly refreshed, it’s crawlable, more shareable (due to share buttons being embedded within the content), and can provide a better experience on mobile devices. Whether your motive is driving shares or links, interactive content provides an alternative avenue worth exploring.
Final Thoughts
I believe we’re in a sweet spot right now where it’s easy enough to produce interactive live content, but not so easy that everyone with an online presence doing it.
If anyone has any great examples of interactive live content, or any other tips for producing them, please share in the comments below!


