


Perficient researched traffic statistics of trillions of site visits within the United States and globally, broken down by industry and year. They uncovered shifts in user behavior and surprising gains in visitors using desktop devices.
Methodology
Perficient used the Google Analytics Benchmarking Feature to derive insights from trillions of site visits in the United and around the world. The research also divided the traffic metrics by industry to show how user behavior differed according to what device was in use.
Page Views Per Visitor
Page views per visitor is the average amount of pages a site visitor viewed in a visit.
For both USA and Global traffic, the page views per visitor metric went up in 2020 over 2019 for desktop visitors but declined for visitors on mobile devices.
Regarding the decline in Page Views Per Visitor for mobile, it may reflect a change in the context of where people are searching, which may have influenced what mobile users are looking for in 2020 during the pandemic.
The “where” part of the search activity might favor desktop sites since people are spending more time at home as well as working from home.
I asked Eric Enge of Perficient about the desktop increase in page views per visitors and he replied:
“My belief is that this relates to people being at home more. For those that have desktop devices as an option they’d be more likely to use devices with a larger screen and keyboard since they are handy.
Similarly, for desktop devices since they might have more time available, they’d be inclined to go a bit deeper in their research.”
Consumers are shopping from home more so that makes sense.
Of particular interest is that site visitors averaged one page more per visit on desktop devices than visitors on mobile devices for both years, 2019 and 2020. This trend held up for both USA and Global site visits.
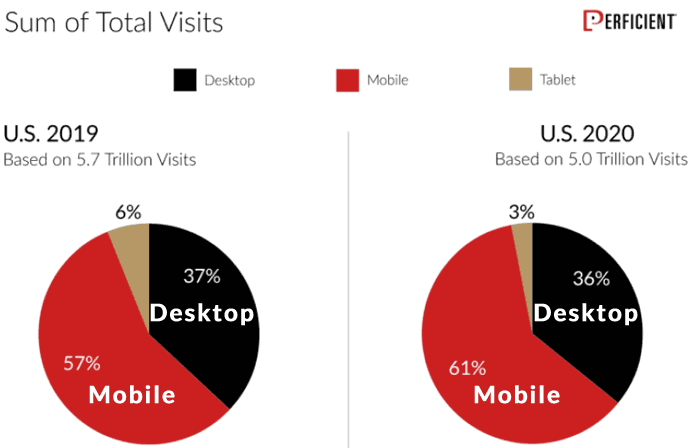
USA Trends
Average Page Views Desktop Versus Mobile 2019
- Desktop 2019 3.59
- Mobile 2019 2.59
Average Page Views Desktop Versus Mobile 2020
- Desktop 2020 3.68
- Mobile 2020 2.54
Desktop Page Views Per Visitors Increased in 2020
- Desktop 2019 3.59
- Desktop 2020 3.68
Mobile Page Views Per Visitor Declined in 2020
- Mobile 2019 2.59
- Mobile 2020 2.54
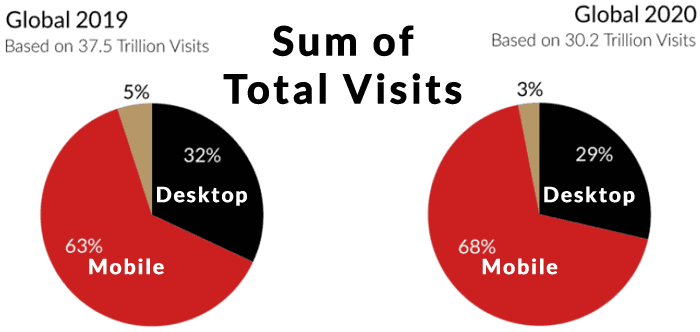
Global Trends – Page Views Per Visitor
Globally the average page views trended upwards for desktop in 2020, from 3.75 page views in 2019 to 3.95 page views in 2020.
Mobile average page views decreased slightly from 2.68 pages to 2.67 pages.
2019 Average Page Views (based on 37.5 trillion visits)
- 2019 Desktop Average Page Views 3.75
- 2019 Mobile Average Page Views 2.68
2020 Average Page Views (based on 30.2 trillion visitors)
- 2020 Desktop Average Page Views 3.95
- 2020 Mobile Average Page Views 2.67
Average Time on Site
The Average time spent on site grew year over year for both Desktop and mobile. Obviously people spent more time on site in 2020 than they did in 2019 because of the pandemic.
But what’s notable is that the time on site measurements for visitors to desktop sites were nearly double that of mobile visitors for both 2019 and 2020.
This statistic (based on 5.7 trillion visits in 2019 and 5.0 trillion visits for 2020), seems to underline the fact that people tend to feel more comfortable researching on desktop sites than on mobile sites for long term engagement with a website.
While more people in general are on mobile, the data is clear that people tend to linger at least twice as long on desktop devices than on mobile devices.
Average Time on Site (measured in seconds)
2019 Average Time on Site:
- Desktop 2019 289.48
- Mobile 2019 136.40
2020 Average Time on Site:
- Desktop 2020 323.47
- Mobile 2020 158.21
Visits using a tablet device accounted for 3% of all total visits. The average time on site metrics were higher for tablet than mobile but lower than desktop, right in the middle area between the two devices (desktop and mobile).
Global Average Time on Site
The Global Average Time on Site metrics are based on 37.5 trillion visits in 2019 and 30.2 trillion visits in 2020.
2019:
- Desktop 2019 313.99
- Mobile 2019 154.37
2020:
- Desktop 2020 351.54
- Mobile 2020 160.13
Similar to the USA metrics for tablet devices, tablets accounted for 3% of total visits and occupied average time on site scores between desktop and mobile, higher than mobile but lower than desktop, right in the middle.
Perficient Research Study by Industry
The Perficient research breaks also down the metrics by niche and discovers subtle differences between global and United States trends.
The research concludes with four takeaways:
- Mobile experiences are continuing to improve
- Desktop remains very important.
- Compare your site’s behavior to industry norms
- Pay attention to page speed
The Perficient research breaks down the metric by niche so it may be helpful to visit the research page and compare your metrics to what the industry metrics are. If there’s a difference between where the industry is at then it may be time to consider what kinds of changes need to be made.
Citation
Read the Perficient Research
Mobile vs. Desktop Usage In 2020
