
We know that in search, not all things are created equal.
Not every tactic will yield the same results.
Not every link has the same value.
Not every keyword you rank for is valuable.
We tend to spend an inordinate amount of time thinking about rankings strictly at the domain level.
We look at a site, figure out its Domain Authority, try to gauge whether or not that site will have an easier or more difficult time getting visibility.
This principle is invaluable and still is considered a best practice to this day.
What we might not think about as much is that groups of pages within a site might have different abilities of ranking. This is especially true if you’re an ecommerce site with a large variety of SKUs.
For example, Walmart offers a huge variety of products in their store – everything from clothing to grills and trampolines.
It’s unlikely that these product groups all have the same chance of ranking well just because Walmart has strong domain-level authority.
Some of these products might have more backlinks at the page level.
Some might be in less competitive industries.
Google might view Walmart as more of a topic-level authority for some of these.
One interesting type of analysis we’ve done for clients with a large number of page groups is designed to answer the question, “Which of our pages are most likely to rank well?”
Answering this one question can help steer the direction of your SEO or content campaign.
It can show you potential quick-win opportunities for categories where you can create new content and stand a better chance of ranking.
It can help you identify low-performing groupings and see where more time and investment are needed.
So how do you do this? I’m going to show you our process of answering this question using keyword segmentation.
Please note: While we use ecommerce sites as an example here, with proper tagging, this type of analysis could be performed for many different types of sites.
What Is Keyword Segmentation?
One of my favorite sayings from a digital marketer comes from the legendary Avinash Kaushik, who once proclaimed that, “All data in aggregate is crap.”
While he was referring to web analytics, he could very well have been talking about web rankings.
While it’s certainly helpful to look at overall ranking data, the ability to segment into more meaningful groupings can help provide you with a lot more insight.
While we often think about Google Analytics segments, we often don’t apply the same logic to our ranking data.
For this type of analysis, we’ll need to figure out a way to segment our keywords into different groups.
Fortunately, there are tools out there that make this really easy to do. STAT is one of the most robust ranking tools available and allows you to easily create custom keyword segments.
Other tools such as Moz Pro and Ahrefs can also help you segment your keywords.
For this article, I’ll be using examples from STAT.
1. Upload Your Keywords
Your first step is to upload keywords to STAT.
You need a way of associating your keyword data with the mapped URL.
Since STAT will automatically find the URL that’s ranking for a given keyword, it should do it for you.
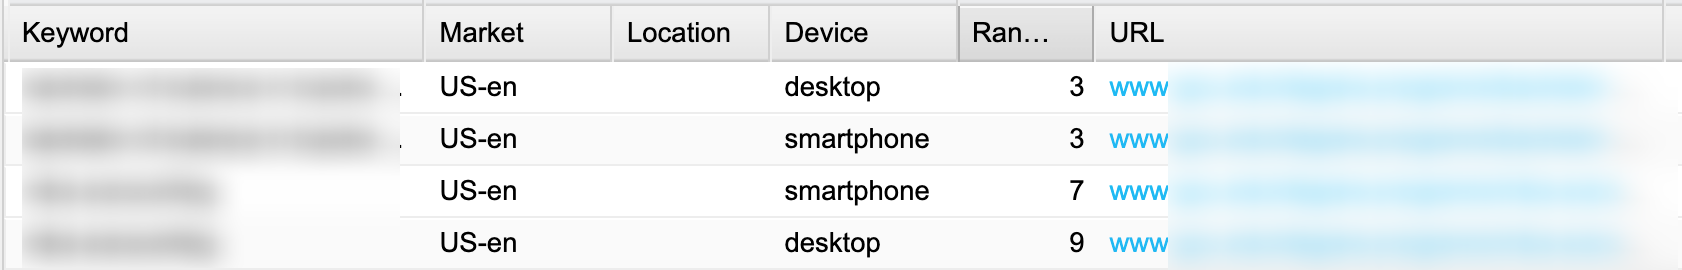
Once you see that data, you’re good to go.
2. Segment Your Keywords Into Relevant Groups
The next step is to take your keyword list and segment them into relevant groups.
Most ecommerce sites will generally want to segment by product category (clothing, outdoors, electronics, etc.). That’s the example we’ll be using here.
However, you can segment by many different variables. Categories, search volume, revenue potential, it’s all on the table.
Here, you can see an example of where we’ve grouped a website’s bedding pages into different keyword segments:
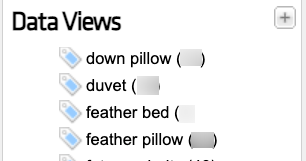
This allows us to drill down into rankings for each specific grouping.
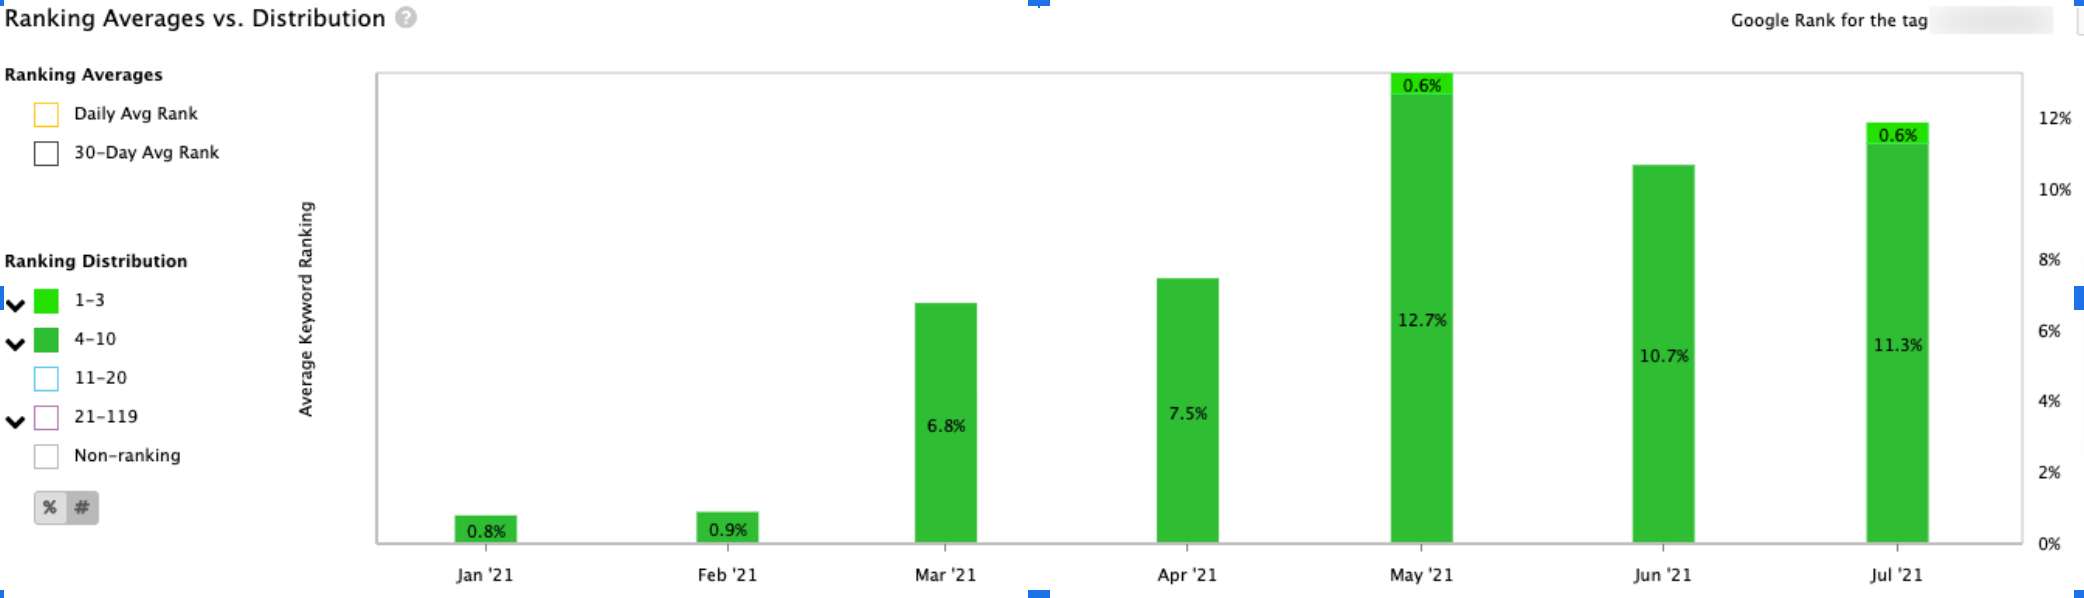
For instance, clicking on down pillow might show us rankings for down pillow pages:
However, clicking on the duvet group will us ranking data for a separate grouping of keywords:
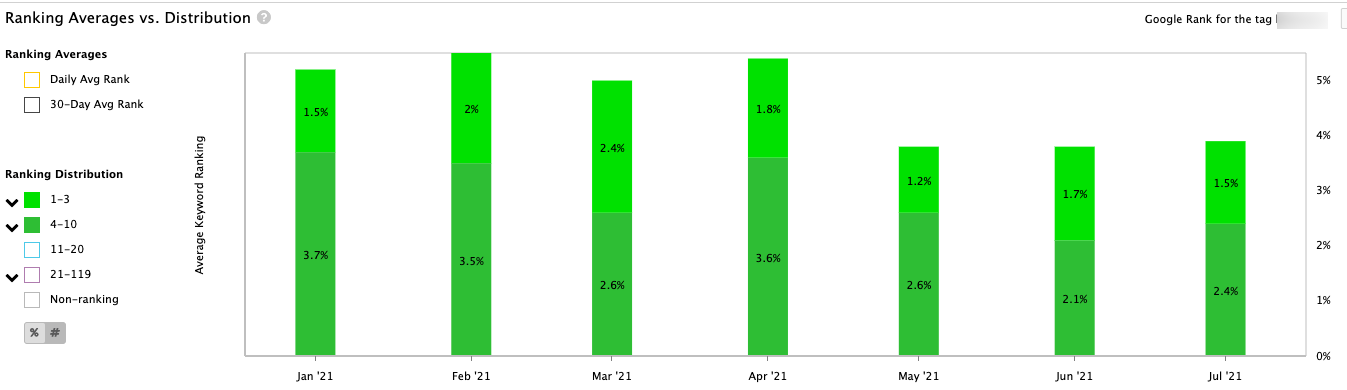
Here we can see that on the same website, there are two completely different stories happening here.
Rankings for “down pillows” have been climbing while “duvets” have been dropping. Segmentation allows us to easily see that.
Creating Segments At Scale
If you work on a large ecommerce site, you might be thinking that just creating segments alone will create a week’s worth of work. If you’re tracking 10,000+ keywords, creating meaningful groups seems like a monumental task.
Fortunately, many ecommerce sites have already properly taxonomized pages using breadcrumb internal links.
These breadcrumb internal links have already done the categorization for you, so all you need to do is extract the breadcrumbs from your website and associate them with keywords you want to segment.

You can easily pull all of this at scale by using Screaming Frog’s custom extraction of your BreadcrumbList schema.
Since your breadcrumb categorizes your site’s products into categories, we should be able to use the same categories for our STAT segments.
The goal here is to create keyword segments based on the naming conventions of your website’s breadcrumbs.
Open up Screaming Frog’s custom extraction and change the dropdown to “Regex.” You’ll need to add the following regex (huge shout out to Brian Gorman for creating this):
"position":(\d+)(,)"item":\{"@id":"(.*?)"(,)"name":"(.*?)"\}
This should extract the position, item, and name of the breadcrumbs associated with each URL of your site.
For instance, when crawling the REI site, we get an example like this:
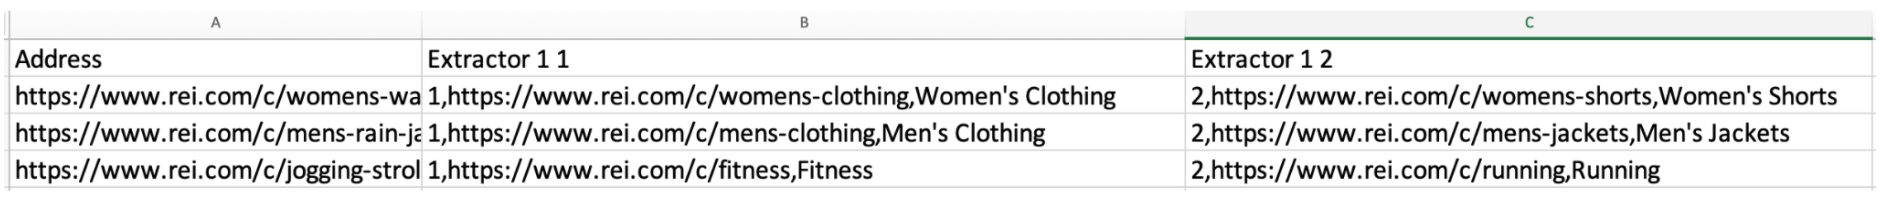
You’ll need to do a little bit of formatting using Text To Columns and concatenation.
But you should be able to get your spreadsheet to where each URL is associated with the proper categories:
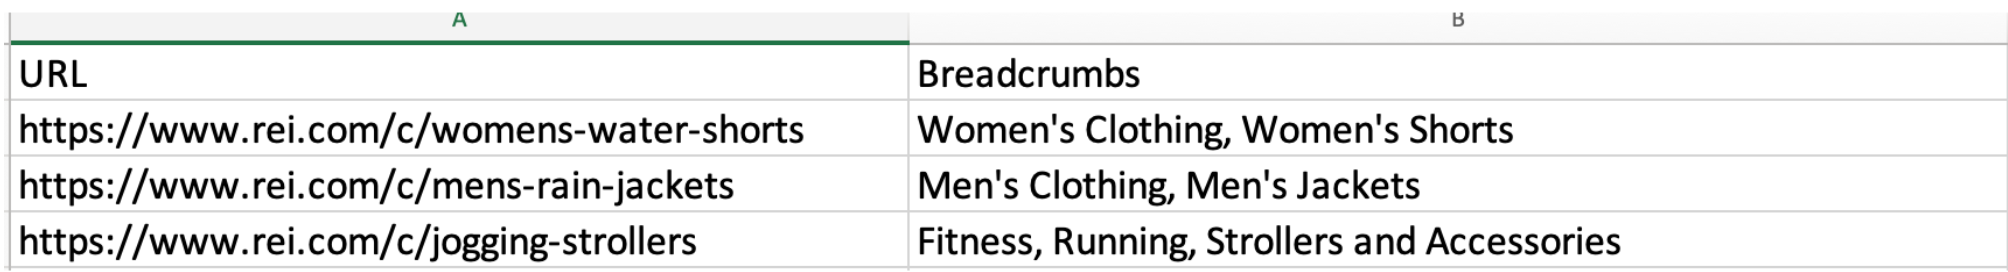
This is really powerful as now you have breadcrumbs for each URL.
However, in order to upload this, you’ll need to associate each breadcrumb at the keyword level.
You can do this by exporting your existing keyword ranking data.
You’ll want to export your keyword data and ensure that you’re exporting each keyword’s “Ranking URL.”
From there you can use a VLOOKUP to link the correct breadcrumb for each keyword. The final output should be your keywords associated with your breadcrumbs.
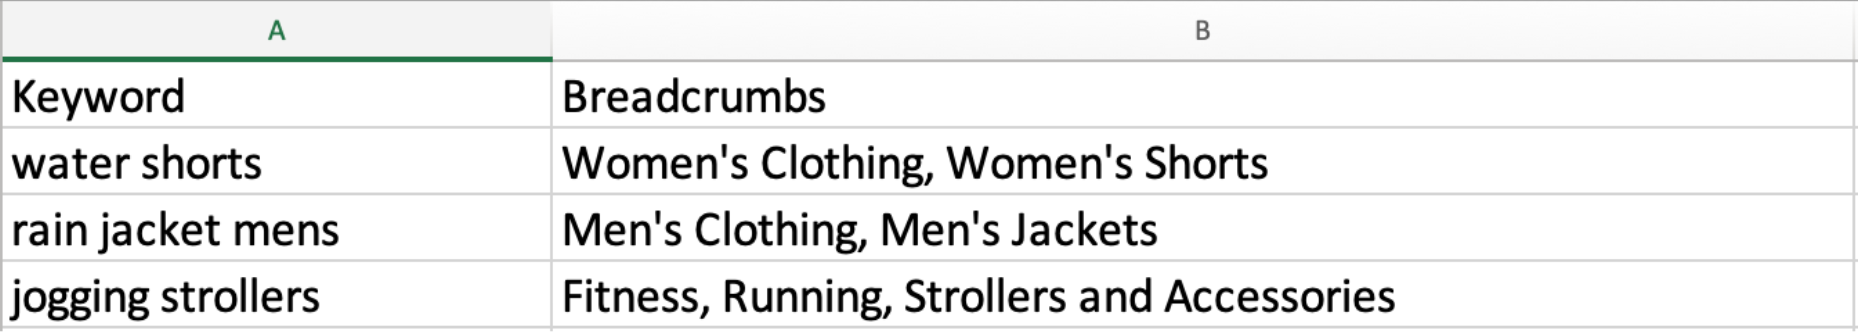
3. Re-upload Your Keywords With Associated Tags
In your new CSV file, you should now have a list of all of your keywords in one column and all of the associated tags in another column.
Reupload this keyword list to STAT to import your new tags to the database. I highly recommend using STAT’s bulk upload feature.
If you already have these keywords added to STAT, don’t worry. STAT won’t add them as duplicate entries and will simply apply the new tags to the keywords you’re already tracking.
Also, if you’ve already been tracking your keywords for a while in STAT, you can use their powerful “Backfill” feature.
This will actually prompt STAT to show historical data for all of the new tags that you just added so you don’t need to wait for the tool to collect new data.
We highly recommend doing this if you already have ranking data for the keywords in your tags.
4. Analyze Rankings By Category
So now that we have all of our data properly imported and segmented in STAT, we get to start analyzing to find insights about how our product categories perform as compared to each other.
Create a new spreadsheet.
Label the left-hand column as “Category” and add all of the product categories that you’re looking to analyze.
Label the second column as “Average Rank.”
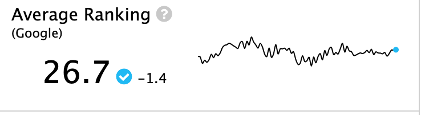
You’ll need to get the average rank for each category. You can get this by clicking on each individual tag and looking at the “Average Ranking” metric in the “Dashboard” tab.
Finally, you’ll want to calculate the average ranking of all of your product categories. Create a third column called “Difference From Average Rank.”
This column will show how that category performs relative to the average rank of the site.
For instance, if we were reviewing the product categories in Walmart’s “Home and Furniture” section and we know the average rank of the pages is 18, we might get an output like this.
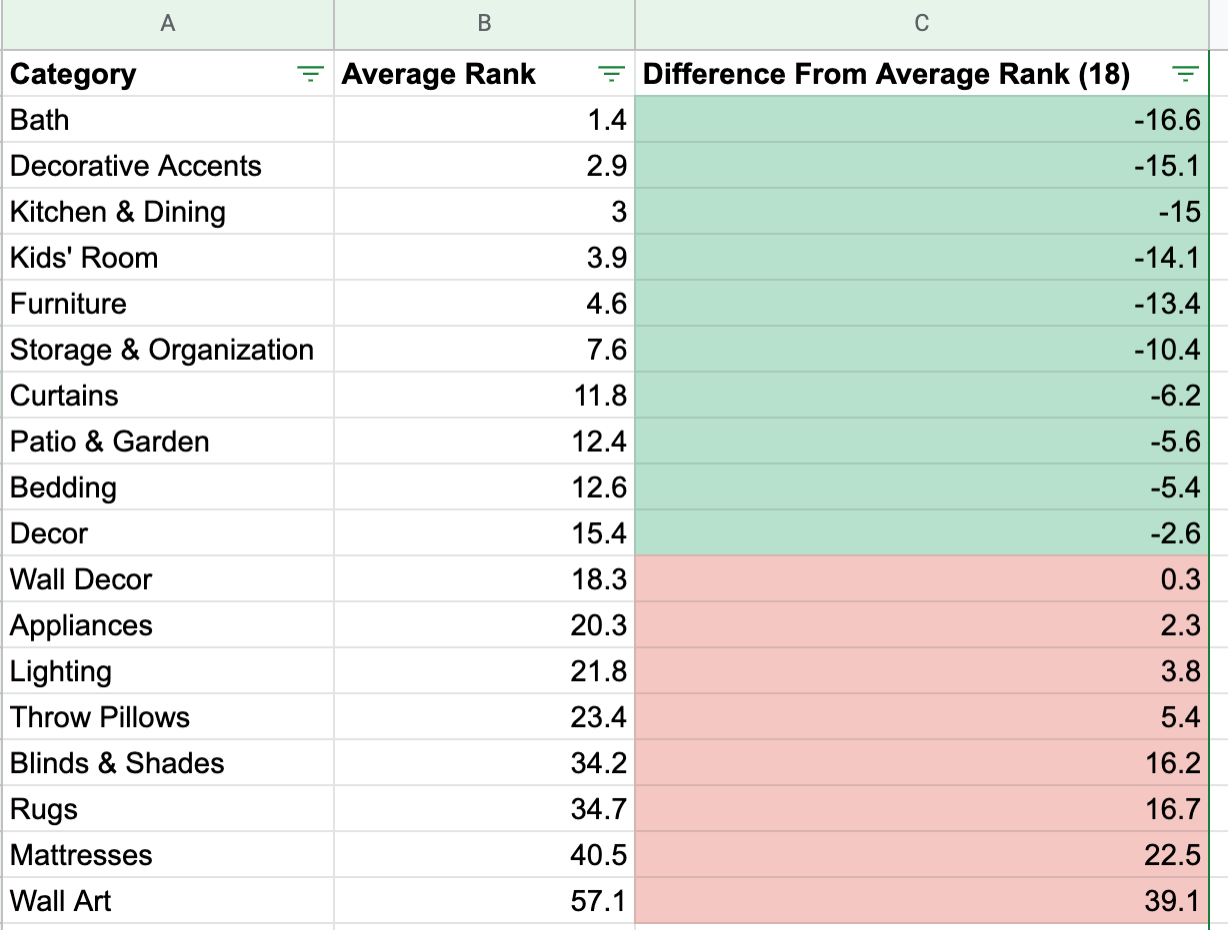
In this view, we can see that Walmart is doing really well for products around Bath, Decorative & Accents, & Kitchen & Dining.
Adding new category pages and products around these categories might have a better chance of performing well.
Conversely, Walmart doesn’t perform well for Wall Art, Mattresses, or Rugs when compared to other pages on the site.
If these are high-priority SKUs, Walmart might want to re-look at their SEO strategy to these pages and prioritize support around this content.
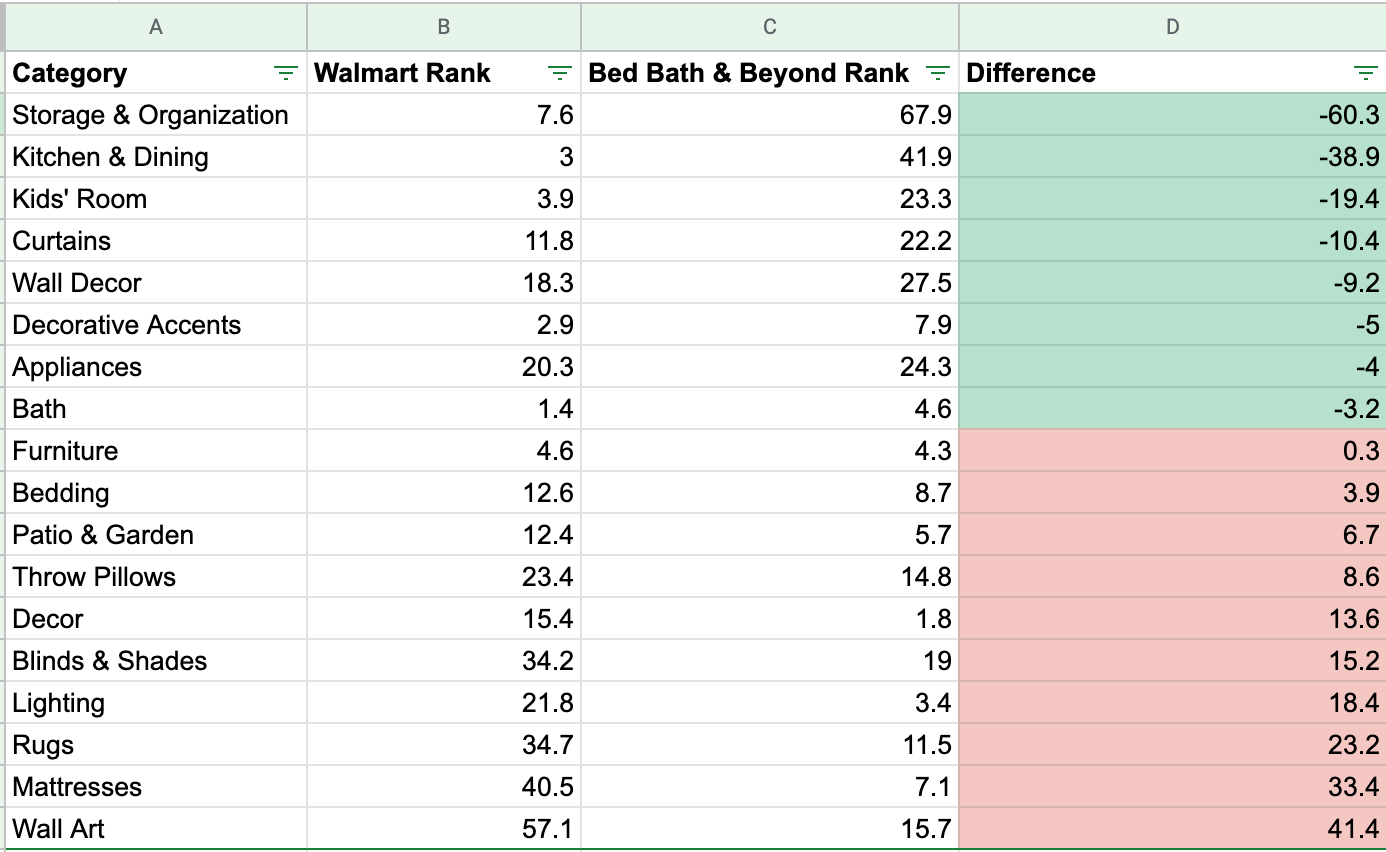
If you’re more interested in competitor data, you could view your product groupings through that lens, too. You could upload the same keywords and tags to STAT and track rankings for a competitor site instead of your own.
This could give you insights as to how each product group ranks compared to theirs.
For instance, here’s an example of that same analysis but looking at how Walmart’s categories rank in relation to Bed Bath & Beyond’s.
Conclusion
Overall, the goal of this is to help you drill down more specifically into product segments to find what’s performing well and what’s not performing well compared to the rest of your site.
This helps give you more insights as to visibility as opposed to just an overall view of ranking data.
This analysis will be especially useful for sites with large inventories or groups of pages where segmentation may be necessary to properly evaluate ranking performance.
Analysis like this can not only give you short-term insights but can help you guide your long-term decisions into where to invest in SEO and content resources.
More Resources:
- Google Reveals the Fastest Growing Product Categories in Search Results
- Article vs. Category Page Rankings: What Should You Focus On?
- Ecommerce Marketing: The Definitive Guide
Featured Image: TeraVector/Shutterstock
