

JavaScript has the capacity to break a whole lot of different things on a website for both users and search engines.
Thus, many SEO professionals and digital marketers are distrustful of JavaScript as a programming language due to the potential negative impacts it can have on their websites.
There is often an air of mystery surrounding JavaScript and rendering, which only adds to this mistrust.
That’s why I’ve written this guide with the aim of explaining exactly how you can test whether the JavaScript on your website renders properly…or not.
If you’d like to refresh your memory on some of the key terms and concepts before diving into the details of JavaScript auditing, make sure you take a look at this JavaScript fundamentals guide first.
JavaScript Issues You Need to Test For
The main priority for any JavaScript audit will always be to find critical issues that are stopping users and search engines from being able to see your content.
To be able to identify where JavaScript could be harming your website’s performance, you need to focus your analysis on answering the following questions:
Is the Page Indexable?
Google can only index content that it can render, but other search engines can’t render JavaScript at all or index the content it generates.
It’s important to test whether a JavaScript-powered page is being blocked from indexing, and whether crucial content is being served immediately without rendering.
What Is the Impact on Page Load Speed?
Having pages that render slowly will negatively impact user experience, and can also prevent search engines from being able to crawl them.
Are There Any Differences Between Unrendered and Rendered Content?
Google has a two-wave indexing process, meaning that it indexes HTML content in a first wave after initially crawling pages.
Pages with JavaScript that need to be rendered are added to a queue to be rendered days, weeks, or up to a month later.
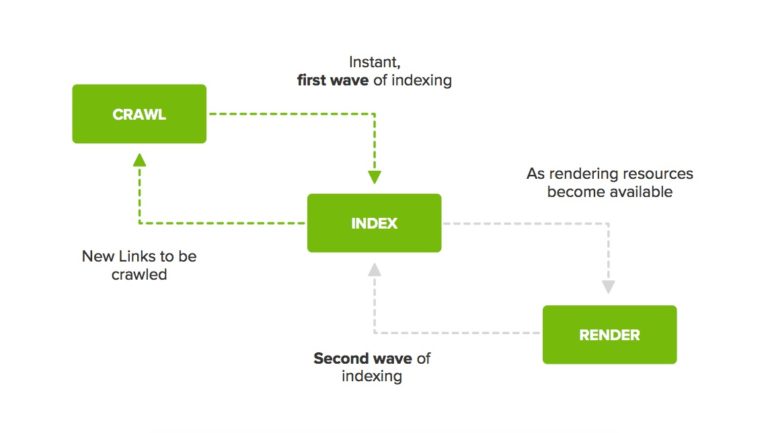
This creates problems if there are differences between what’s presented in the HTML for initial indexing and what’s found at a later date after the page has been rendered, because Google will be receiving conflicting signals about the page.
How Does Rendering Differ Across Devices & Browsers?
Rendering will be impacted depending on the device being used due to differences in their viewports, CPUs, and other factors.
Browsers also have varying rendering capabilities and use different rendering engines. This is why it’s important to test how your website renders across a variety of environments that reflect what your users would be browsing within.
The answers to these questions will give powerful insights into whether your website’s content is accessible to the users and search engines that need to interpret and use it.
The Tools to Use for Testing JavaScript
Now that we’ve covered the main JavaScript rendering issues to test for, let’s examine some of the different tools that can help with your analysis.
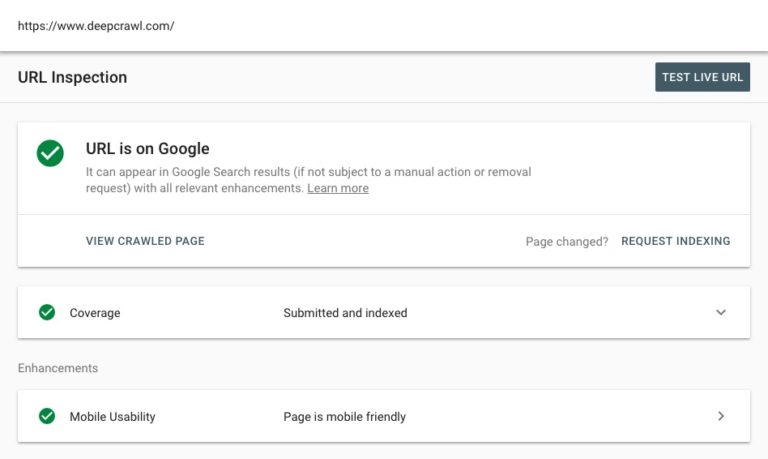
1. URL Inspection Tool
The URL Inspection Tool within Google Search Console shows information on whether Google was able to crawl and index a page.
The tool shows details on issues that are preventing a page from being indexed, including resources that couldn’t be loaded and JavaScript that couldn’t be processed.
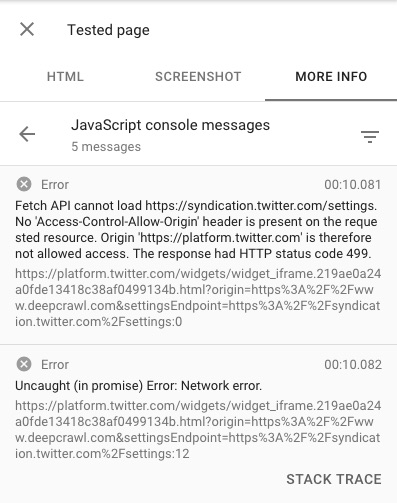
Highlight feature of the URL Inspection Tool: Real-time JavaScript console messages.
The URL Inspection Tool also allows you to run live tests for URLs, which shows real-time JavaScript warnings and errors that were encountered by Google which could be preventing your page’s content from being seen and indexed.
This section of the tool is especially useful for JavaScript debugging.
2. Mobile-Friendly Test
One benefit of the Mobile-friendly Test is that you don’t need a Google Search Console account to be able to use it as you do with the URL Inspection Tool. Anyone can use it to test how their pages render on mobile.
This tool shows you exactly how Google is able to render pages with its smartphone user agent. It also shows JavaScript errors and blocked resources that can stop search engines from being able to access your site’s content.
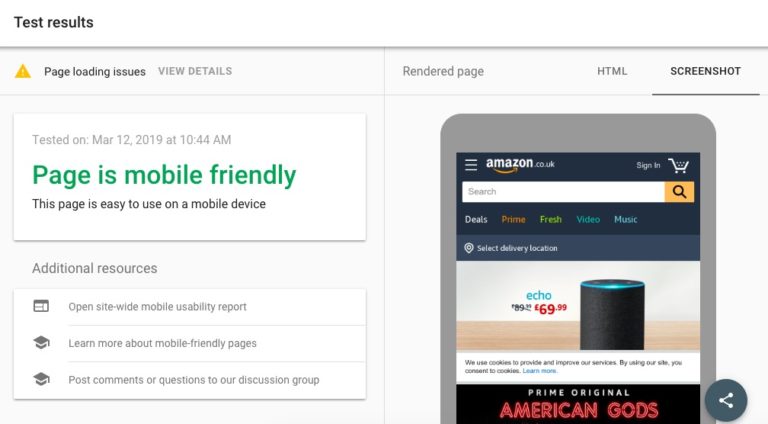
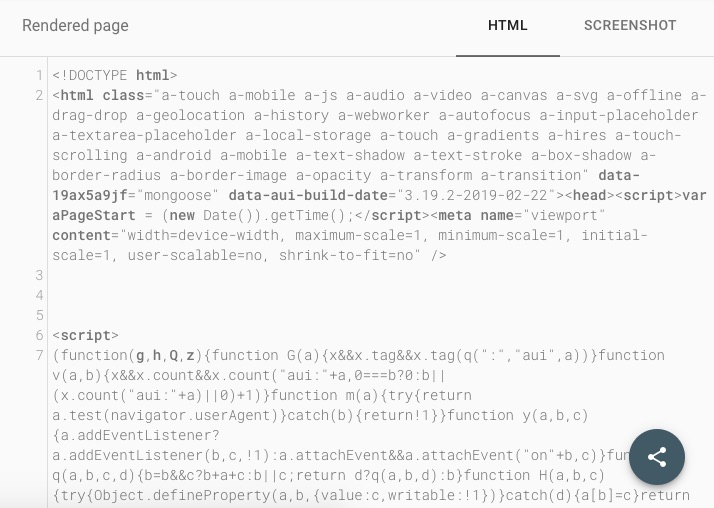
Highlight feature of the Mobile-friendly Test: Rendered page HTML snapshot.
While the screenshot of the rendered page only shows above-the-fold content, the HTML section shows the rendered code of the entire page, allowing you to see exactly what output code Googlebot smartphone was able to see and index.
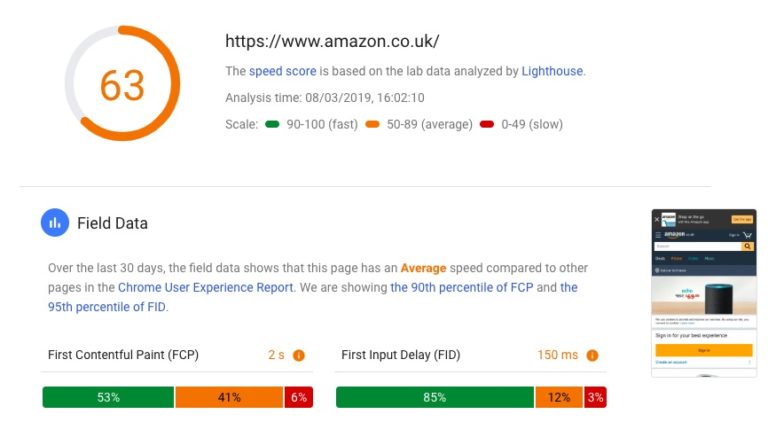
3. PageSpeed Insights
Google’s PageSpeed Insights tool uses a combination of lab data from Lighthouse and field data from the Chrome User Experience Report to document the speed and performance of a page.
It also includes a number of JavaScript reports, showing how the page could be improved by reducing JavaScript execution time, minifying JavaScript, and more.
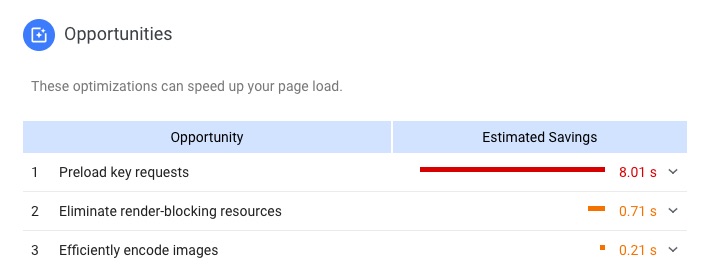
Highlight feature of PageSpeed Insights: The Opportunities section.
This tool prioritizes a list of opportunities in order of how much time could be saved on overall page load by fixing each issue.
This is a great place to look for JavaScript issues that are significantly contributing to page load time that need to be addressed.
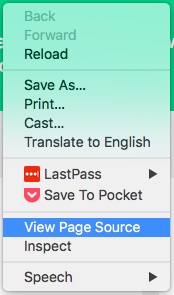
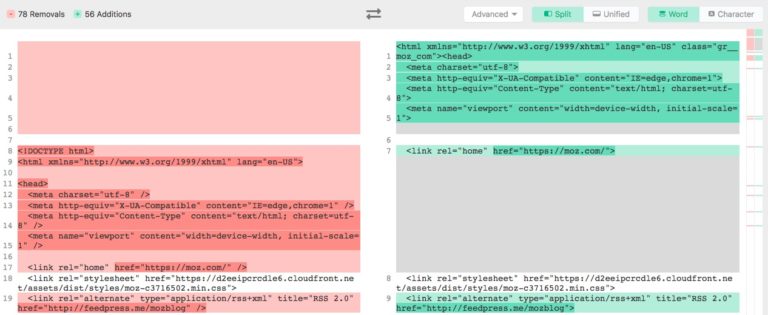
4. Diffchecker
With Diffchecker, you can perform an analysis of a page’s original source code side-by-side against its rendered code. This allows for detailed comparisons into how a page’s content changes once it has been rendered.
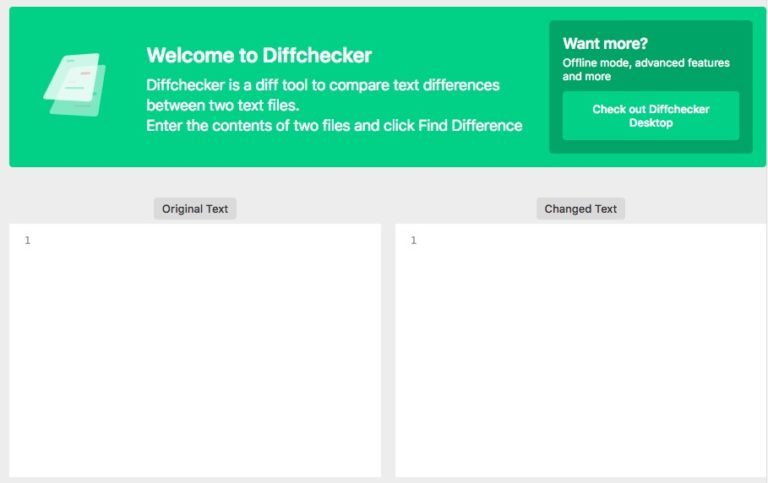
To get started with Diffchecker, try copying a page’s source code and pasting this into the Original Text box.
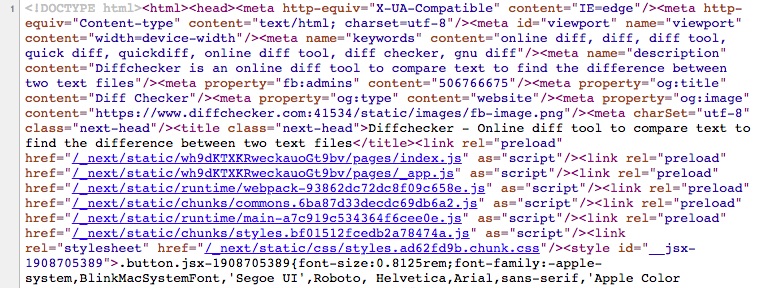
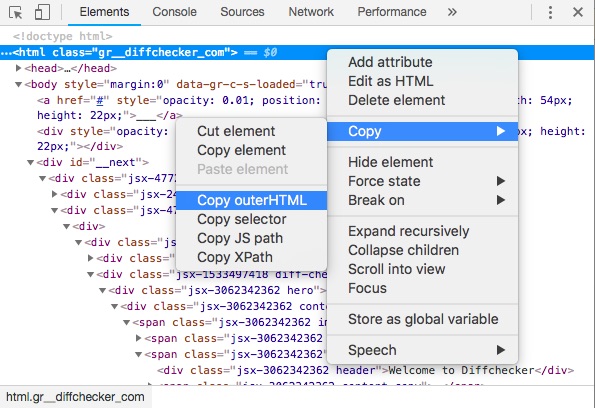
Then copy the outerHTML of the same page and pasting this into the Changed Text box.
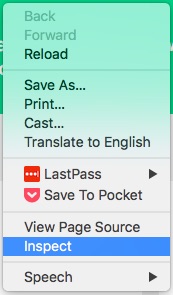
Then press Find Differences to compare the two sets of code.
Highlight feature of Diffecker: Removals and additions summary.
The tool provides top-level figures on how many removals and additions were made to the page after rendering, before having to drill down into detail and analyze both page versions side-by-side.
This gives an immediate indication as to how drastically the page is altered after rendering.
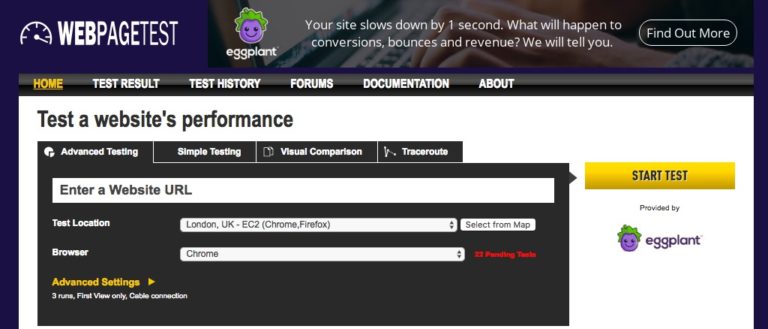
5. WebPageTest
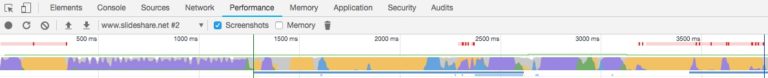
WebPageTest reports on the different resources on a page and how long each one takes to load. It splits out the load time of a page into the different stages and events required to process a page, such as scripting, parsing, and painting.
This provides useful insights into the different stages involved in processing JavaScript and which ones are causing the biggest issues, allowing you to spot performance bottlenecks and patterns.
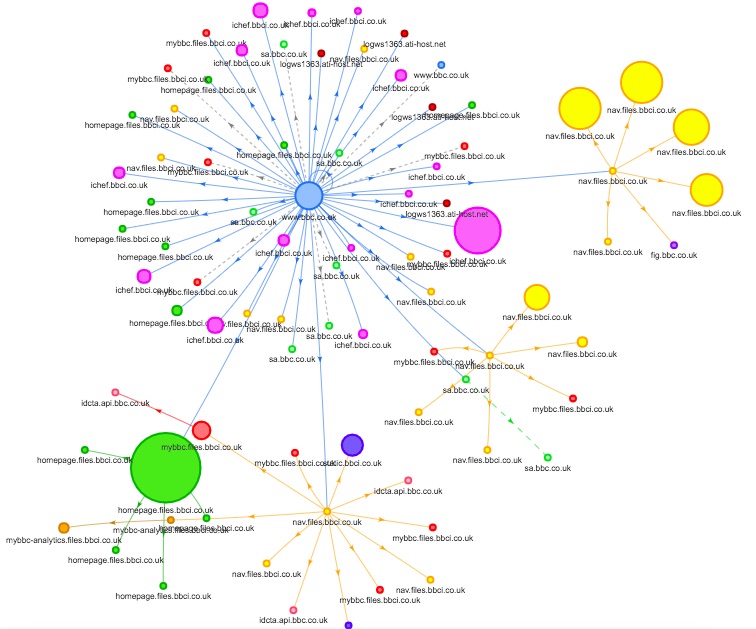
Highlight feature of WebPageTest: Request Map.
The Request Map within WebPageTest is one of my favorite features I’ve come across within a speed testing tool in a long time.
It visualizes all of the different requests that are made on a page, maps out the dependencies between them and shows the load times and relative size of each resource.
The larger the circle, the more bytes of data that will need to be downloaded for that particular resource, and the bigger the contribution to overall page weight.
The green circle in this Request Map was a JavaScript file that was the largest resource on the entire page:
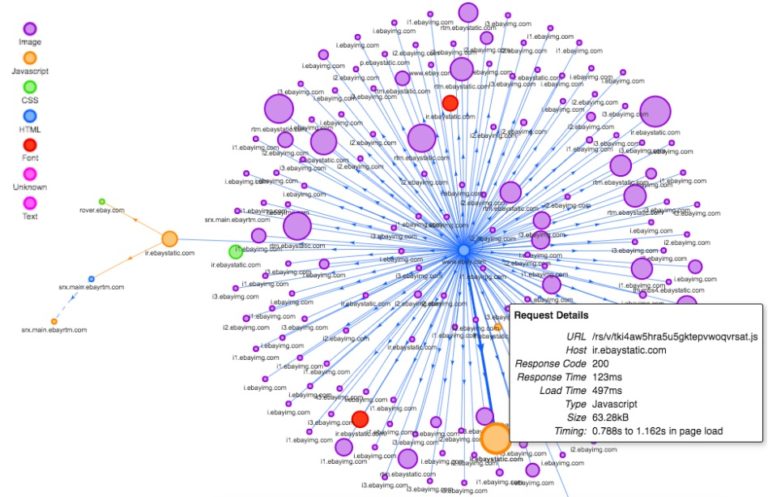
The Request Map is color-coded by the host of the resource by default, however, you can add the simple parameter ?group=mimeType to the end of your URL to color-code by resource type instead.
![]()
This makes the process of spot-checking JavaScript resource load times much quicker and simpler.
6. Chrome DevTools
If you use Chrome as your main browser, then make sure you utilize the JavaScript testing and debugging capabilities of Chrome DevTools. The DevTools dock has a wide variety of reports, such as performance monitoring, network conditions, JavaScript errors and much more.
This tool uses a number of different waterfall charts and timeline charts to map out load times and file sizes of resources.
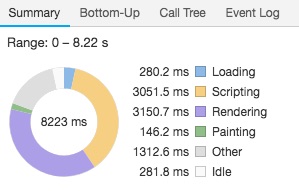
For example, the Performance tab shows a summary of how long is spent loading, scripting, rendering and painting a page. Watch out for spikes in orange and purple, as these colors relate to scripting and rendering respectively.
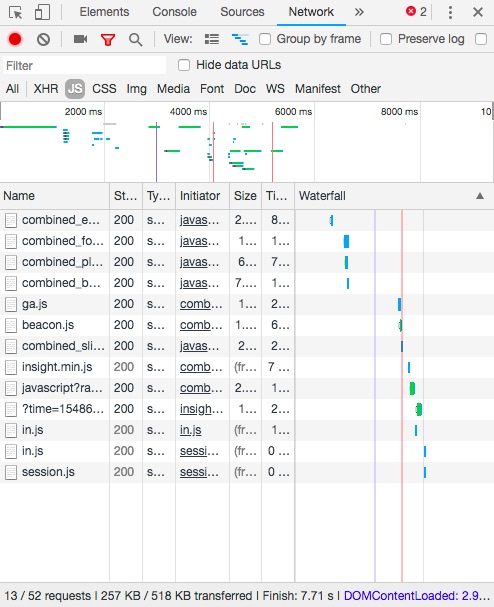
Another good visualization is found in the Network tab which shows the scripts that were run and in which order, as well as the Load Event which is displayed as a red line.
This is important because the Load Event is the point when Google finishes rendering and takes a snapshot of the HTML. Any scripts being run after this point have a low chance of being seen by Google.
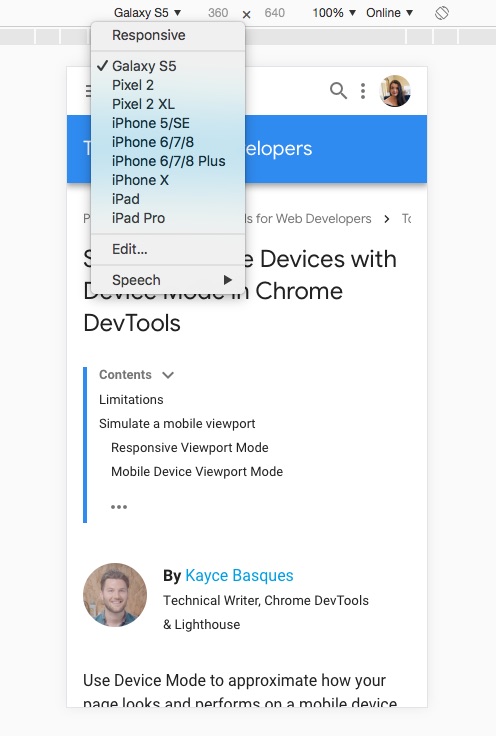
You can also use the Device Mode in Chrome DevTools to emulate rendering across different devices.
Other browsers also offer JavaScript debugging functionality through their own developer tools, such as Firefox, Opera and Safari. You don’t have to use Chrome to get important rendering insights.
Highlight feature of Chrome DevTools: The Coverage report.
This report reveals unused JavaScript code on a page, as it shows how much JavaScript was actually executed against how much was loaded in total. This gives an invaluable insight into the code that is necessary for users to be able to access your content.
7. DeepCrawl
Whereas the other tools mentioned above provide granular insights on a page-by-page basis, DeepCrawl (disclousre: I work for DeepCrawl) can be used to render JavaScript across all of the different pages of a website, in the same way that Google does.
This tool allows you to test and monitor rendering at scale, and shows you whether links and content that are generated or moderated by JavaScript can be crawled and indexed by search engines.
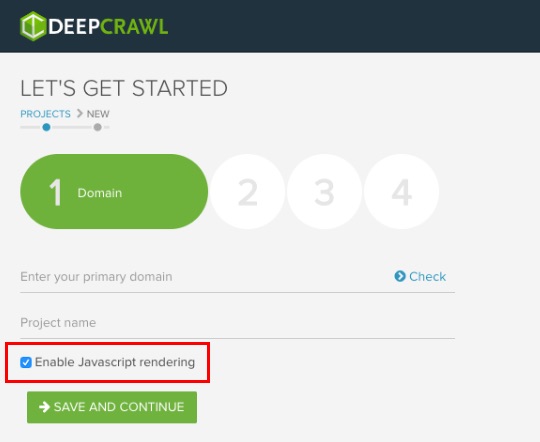
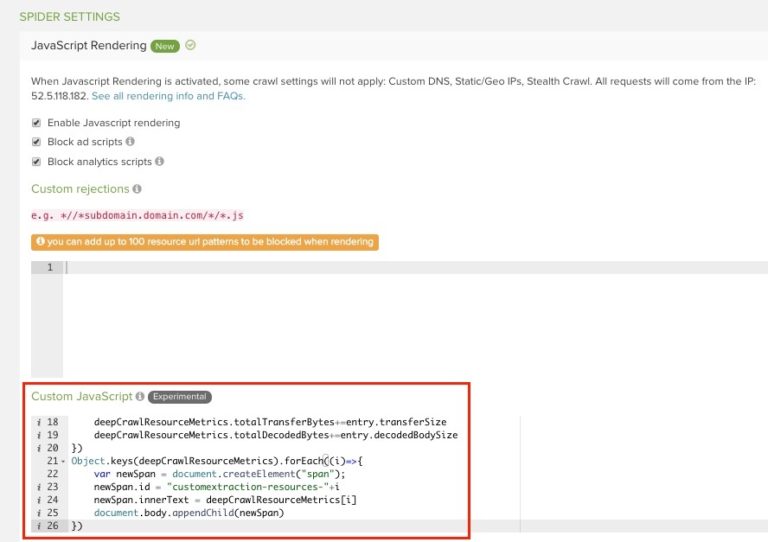
Highlight feature of DeepCrawl: Custom script injection.
DeepCrawl has a custom JavaScript feature which allows you to inject code into a website as it is being crawled. This method means that you can add, change or remove elements in the DOM (document object model) to test the impacts of rendering.
You can use a custom script injection to collect speed metrics from Chrome, check which frameworks, iframes and scripts are being used and where, locate external files, and more.
Conclusion
Whether you’re new to JavaScript testing or have been battling JavaScript issues for years, hopefully, you’ve learned something new that you can try out and add to your auditing process going forwards.
It’s challenging to cover all of the different ways you can use these tools for testing and debugging JavaScript. Most of the fun comes from trying them out yourself and discovering what lies within each new tab and report.
The key to ensuring that your website continues to perform in search, is to keep crawling, monitoring, and testing for JavaScript errors and bottlenecks. This is the best way to stay ahead of the curve, or at least keep up!
More Resources:
- Understanding JavaScript Fundamentals: Your Cheat Sheet
- SEO & JavaScript: 6 Things You Need to Know
- A Complete Guide to SEO: What You Need to Know in 2019
Image Credits
All screenshots taken by author, March 2019
