

It seems that everyone and everything has gone social these days, even Google analytics. In a recent announcement Google let us analytic enthusiasts know that we will soon be able to share and collaborate on Google Analytics dashboards!
For those of us who own our own websites or manage our clients’ internet marketing, we know how valuable this can be. Dashboards give me a quick overview of how my sites are performing. Dependent on the site or the client, I may have different goals and so I may have different set up.
With the new dashboard sharing feature I will be able to share my dashboards with anyone that is a user on the account, and my team members will be able to monitor the key metrics, as needed. And as the saying goes more heads are better than one.
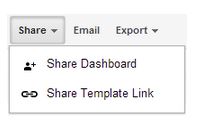
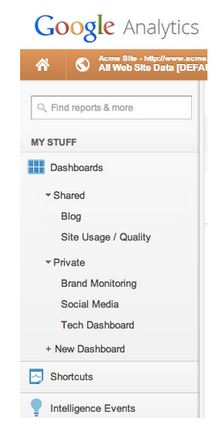
Soon users of analytics will see a new “Share Dashboard” option added to the Share dropdown and you will be able to see a list of shared and private dashboards in the left-hand sidebar as shown below.
Google Analytics team member Matt Matyas tells us that, “this marks another enhancement in Google Analytics asset sharing, complementing the sharing capabilities of assets like annotations, advanced segments and custom reports.”
Additional sharing features, he says, are on the roadmap. I can’t wait to see what’s coming next!
But Wait, There Is More.
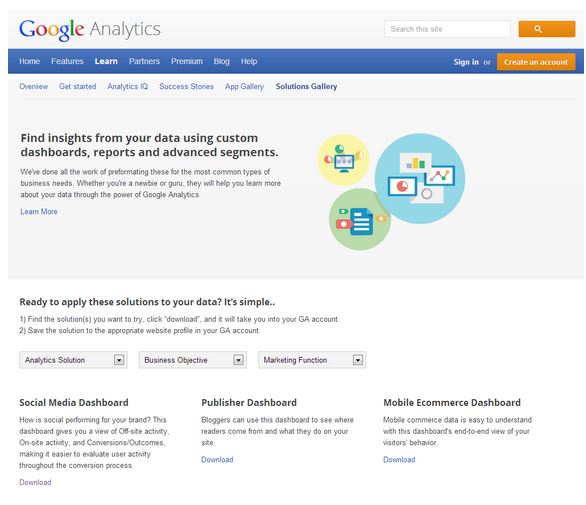
Earlier this year, Google made Analytics easier for people like me to use with their Solution Gallery. This allows us to use premade dashboards, segments & custom reports. These dashboards download easily and, once installed, lead you straight to your Google Analytics account.
Why is this important? Let’s face it, for many people Google Analytics can be challenging. The tool is very robust and offers us a variety of reports, filters, and customizations that can be overwhelming. For a new, less experienced user it may be hard to figure out where to look first for the data and insights that will help you to make better decisions for yourself or clients. Even for more advanced users it can be time consuming to build out different variations of reports and dashboards to track performance. But not anymore, thank you Google!
Custom Dashboards, reports and Advanced Segments
Google has done all the hard work for most all business needs. All you have to do is find the solutions you want with just a few clicks and click download and then save the solution to the website you want to track. It’s that simple!
The Shared Dashboards
As I said, there is a dashboard for just about everything you will need. For example, the publisher dashboard is designed for bloggers. With this dashboard I can keep track of unique visitors to our Advice Interactive Group blog, how long they remain on our site and other related data. So, if you’re a blogger you can use this blogger dashboard to keep tabs on where your readers come from and what they do on your site.
The site performance dashboard lets you keep track of speed metrics associated with your website, and tracks any problems that might be slowing things down. This dashboard contains various speed metrics to help identify issues with your pages or servers.
An advanced publisher dashboard is also available for a deep dive into how users engage with the content of your website or blog. This one is my favorite by Justin Cutroni, Analytics Advocate at Google. It’s a PR Dashboard that lays out everything I want to see in one quick glance. This dashboard is focused on the visitors, where they came from and what they do on my site. You can read more about this dashboard and download it here: PR Dashboard.
Efficient operations are especially important with mobile optimized websites. The mobile ecommerce dashboard allows you to keep track of how users engage with your website through their mobile devices.
The social media dashboard allows you to monitor activity both offsite and onsite for your enterprise, making it easier to track how people engage with your product or service. This Social Media Dashboard from Dashboard Junkie is my favorite for this type of reporting.
Advanced Segments
Much of the power of Google Analytics is drawn from its ability to segment visitors to your site. Google Analytics makes it easier to keep track of the characteristics of visitors to your website with advanced segments. In the solutions gallery, advanced segments for long-tail keyword searches are available for three keywords, four keywords, five keywords or six or more keywords. You can also segment non-branded keyword traffic to obtain an in depth view of your SEO efforts. Engaged traffic segments show statistics from visors that view three or more pages from your website and linger for more than three minutes. You can find all of these Advanced Segments here on this page.
Don’t Forget To Share
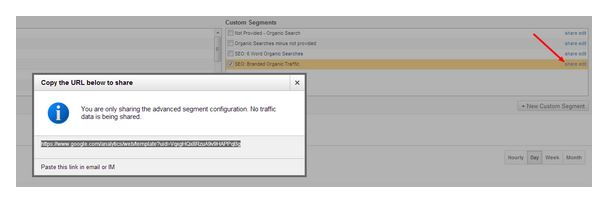
Remember, if you create an advanced segment that you think others would like to use, it is easily shared. All you need to do is go to the segment you are planning to share and click “Share”. Just copy the url and share away!
Here are 11 valuable Advanced Segments by Graham Charlton at econsultancy.com I think you will find many of them useful for just about any business.
Custom Reports
Custom reports also represent a powerful tool in Google Analytics. With custom reports you can create, save, and edit to get a specific view of your data. You can choose the information you want to see, organized in the way you want to see it, by using a drag and drop. You can also create tabs if you want to see related data.
The social sharing report is an important tool for social media marketers. The report shows what content users are sharing from your website and how it is being shared. The daily ecommerce report allows you to view every aspect of your ecommerce activities in a single table. You can keep track of your pay-per-click activity with PPC keyword/matched query report, which shows which queries have been matched with ads on your site. The PPC performance report provides insight into revenue per click and other aspects of PPC campaigns. The paid versus organic search report illustrates site use differences between visitors who used paid keywords to land on your site and those who landed on your site through organic, or free, search terms.
Conclusion
With the addition of these easy-to-use, versatile tools, there is really no excuse to put off using Google Analytics for analyzing data associated with your website any longer. If you’re unfamiliar with Google Analytics, begin with basics like pre-made dashboards that are especially user friendly. As you become more comfortable using Google Analytics, you can branch out into the more advanced tools, including creating your own dashboards and don’t forget to share them with me.
image credit: Shutterstock
