
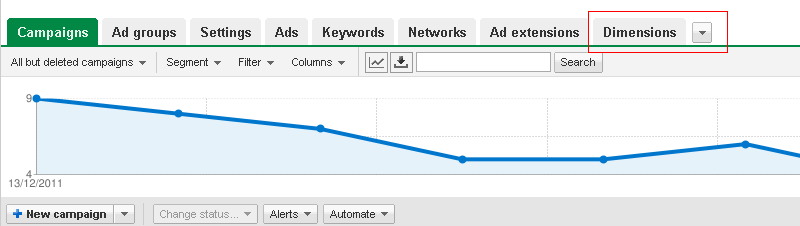
Since the launch of Google’s PPC (‘Pay-Per-Click’) advertising network, ‘AdWords’, countless reporting features have been added to the platform to give advertisers as much insight as possible into exactly what kind of traffic they’re getting. One of the more recent features to be added to the platform is the “Dimensions” tab.

Above – Where to find the dimensions tab within your account.
In a nutshell, the ‘Dimensions’ tab allows users to break down their traffic data in various ways such as the time of day their ad clicks occurred, which search queries triggered their ads to show, the geographical location of their visitors and much more. This sort of transparency is what separates AdWords from most other marketing channels, and the information provided can be used to make intelligent changes to your campaign which results in significant increases in conversion rates.
This article will run through some of the dimensions reports that give the most value to AdWords advertisers, and how they can be used to improve your campaigns performance.
1) Search Queries. This is easily the most useful report within AdWords. Within the standard ‘Keyword’ tab of AdWords, you’re able to see individual performance for each of your selected keywords, however this isn’t the full story. Any of your broad, broad modified or phrase matched keywords can trigger your ads to show for searches that might be almost completely irrelevant to the product or service you’re trying to promote. For example, if you have the broad matched keyword “digital cameras” within your campaign with the intention to sell digital cameras, your advert might be appearing for Google users who are searching for “blogs on how to use digital cameras”. The ‘Search Query’ report within the dimensions tab allows you to see exactly what people are typing into Google to see your ads, rather than just the keywords triggering their search. This information is vital in improving the quality of your traffic.
So how can I use this report to improve my campaign performance?
Using the earlier example, given that users searching for “blogs on how to use digital cameras” probably won’t convert into a sale for you, you don’t want these people seeing your ads. After viewing the search query report, you could simply go to your “Keywords” tab and add “blogs” as a negative keyword, preventing any future Google users who mention the term “blogs” in the searches from seeing your ads. This is the sort of AdWords maintenance that should be performed on a regular basis, and will almost always result in conversion rate improvements.

Above – A search query that most advertisers probably aren’t interested in appearing for!
2) Geographic. The geographic report is pretty self-explanatory – this report allows you to break your traffic/conversion data down by geographic location, right down to the city your audience is located in.
So how can I use this report to improve my campaign performance?
When used correctly with Adwords’ geo-targeting feature, this report can be extremely effective in increasing conversion rates for your campaign. For example you might run this report for a particular month and notice that one city is generating no conversions, while other cities are converting quite well. After noticing this, you might want to edit your geo-targeting settings to exclude the non-converting city, preventing your ads from being shown to users who are located there.
You could also use this feature to find high converting cities, and put a focus on these areas by creating specific campaigns for each high converting city, with a high daily budget cap and high keyword bids to ensure you’re getting maximum exposure within these areas.

Above -the geographic report in action.
3) Destination URL. This report allows you to see individual performance of each of the destination URLs within your campaign. For example you might have half of your keywords sending people straight to your home page, and the other half sending people to a specific product page within your site. This report makes it possible to see exactly what kind of performance each page is generating.
So how can I use this report to improve my campaign performance?
Having a good AdWords campaign is all well and good, but if your landing page isn’t performing, then neither will your marketing campaigns – it’s as simple as that. We recommend performing regular landing page testing, and the ‘destination URL’ report gives you the data you need to be able to make sensible decisions about where on your site you should be landing people for each keyword. For example you could create an AdWords experiment which tests several landing pages against each other. After a month or so, you’ll simply be able to dive into your destination URL report and look at the conversion rates of each landing page. After that, you can remove the poor converting landing pages from your account and send people only to your high converting pages. This will usually have a strong impact on overall conversion rates.
With this information you should now be able to make some very positive improvements to your AdWords campaign using your historical data. Let me know how it goes!
