
Maybe you’re here because you’re a die-hard fan of performance metrics. Or maybe you don’t know what Lighthouse is and are too afraid to ask.
Either is an excellent option. Welcome!
Together, we hope to take your performance improvement efforts from “make all the numbers green” to some clear and meaningful action items.
Note: This article was updated for freshness in January 2022 to represent versions 8 and 9.
Technical SEO and Google Data Studio nerd Rachel Anderson joined me on this merry adventure into demystifying developer documentation.
We’re going to answer:
- What is Lighthouse?
- How is Lighthouse different from Core Web Vitals?
- Why doesn’t Lighthouse match Search Console/Crux reports?
- How is Performance Score calculated?
- Why is my score different each time I test?
- Lighthouse Performance metrics explained
- How to test performance using Lighthouse
What Is Google Lighthouse?
Performance is about measuring how quickly a browser can assemble a webpage.
Lighthouse uses a web browser called Chromium to build pages and runs tests on the pages as they’re built. The tool is open-source (meaning it is maintained by the community and free to use).
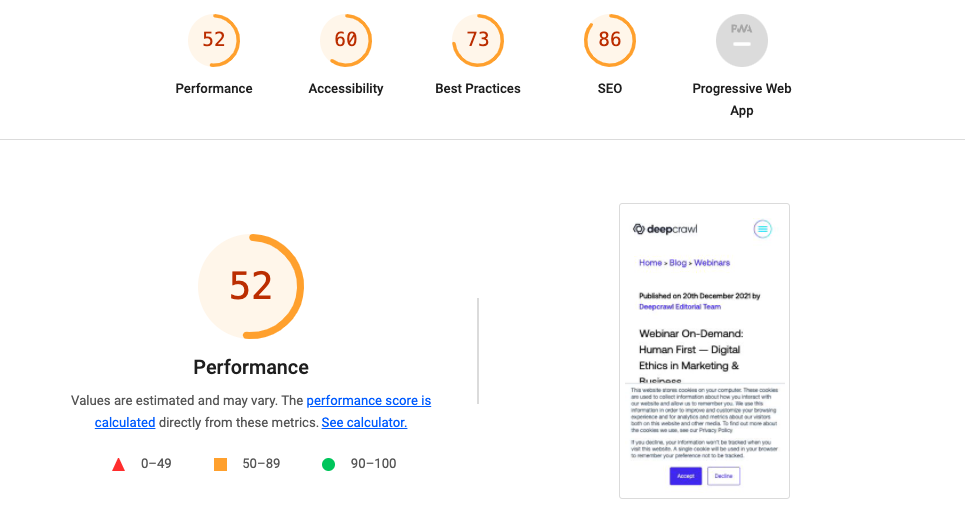
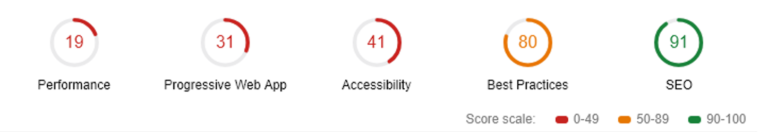
Each audit falls into one of five categories:
- Performance.
- Accessibility.
- Best Practices.
- SEO.
- Progressive Web App.
For the purposes of this article, we’re going to use the name Lighthouse to refer to the series of tests executed by the shared Github repo, regardless of the execution method.
Version 9 is currently out on Github and is slated for large-scale rollout with the stable Chrome 98 release in February 2022.
Google Lighthouse And Web Core Vitals
On May 5, 2020, the Chromium project announced a set of three metrics with which the Google-backed open-source browser would measure performance.
The metrics, known as Web Vitals, are part of a Google initiative designed to provide unified guidance for quality signals.
The goal of these metrics is to measure web performance in a user-centric manner.
Within two weeks, Lighthouse v6 rolled out with a modified version of Web Core Vitals at the heart of the update.
July 2020 saw Lighthouse v6’s unified metrics adopted across Google products with the release of Chrome 84.
Chrome DevTools Audits panel was renamed to Lighthouse. Pagespeed insights and Google Search Console also reference these unified metrics.
This change in focus sets new, more refined goals.
How Is Google Lighthouse Different Than Core Web Vitals?
The three metrics represented by Core Web Vital are part of Lighthouse performance scoring.
Largest Contentful Paint, Total Blocking Time, and Cumulative Layout Shift comprise 70% of Lighthouse’s weighted performance score.
The scores you’ll see for CWV in Lighthouse result from emulated tests.
It’s the same metric but measured off a single page load rather than calculated from page loads worldwide.
Why Doesn’t Lighthouse Match Search Console/Crux Reports?
For real users, how quickly a page assembles is based on factors like their network connection, the device’s network processing power, and even the user’s physical distance to the site’s servers.
Lighthouse performance data doesn’t account for all these factors.
Instead, the tool emulates a mid-range device and throttles CPU to simulate the average user.
Lab tests are collected within a controlled environment with a predefined device and network settings.
Lab data helps debug performance issues.
It does not mean that the experience on your local machine in a controlled environment represents the experiences of real humans in the wild.
The good news is you don’t have to choose between Lighthouse and Core Web Vitals. They’re designed to be part of the same workflow.
Always start with field data from the Chrome User Experience Report to identify issues impacting real uses.
Then leverage the expanded testing capabilities of Lighthouse to identify the code causing the issue.
If you’re working on a site pre-launch or QAing changes in a non-public environment, Lighthouse will be your new best #webperf friend.
How Are Google Lighthouse Performance Metrics Calculated?
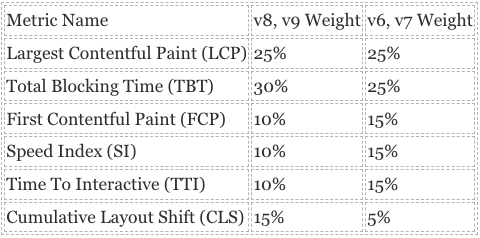
In versions 8 and 9, Lighthouse’s performance score is made of seven metrics, with each contributing a percentage of the total performance score.
Why Is My Score Different Each Time I Test?
Your score may change each time you test.
Browser extensions, internet connection, A/B tests, or even the ads displayed on that specific page load have an impact.
If you’re curious/furious to know more, check out the documentation on performance testing variability.
Google Lighthouse Performance Metrics Explained
Largest Contentful Paint (LCP)
- What it represents: A user’s perception of the loading experience.
- Lighthouse Performance score weighting: 25%
- What it measures: The point in the page load timeline when the page’s largest image or text block is visible within the viewport.
- How it’s measured: Lighthouse extracts LCP data from Chrome’s tracing tool.
- Is Largest Contentful Paint a Web Core Vital? Yes!
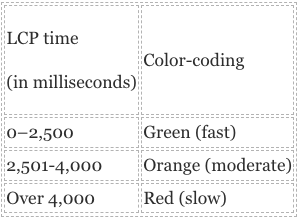
- LCP Scoring
- Goal: Achieve LCP in < 2.5 seconds.
What Elements Can Be Part Of LCP?
- Text.
- Images.
- Videos.
- Background images.
What Counts As LCP On Your Page?
It depends! LCP typically varies by page template.
This means that you can measure a handful of pages using the same template and define LCP.
Lighthouse will provide you with the exact HTML of the LCP element, but it can be useful to know the node as well when communicating with developers.
The node name will be consistent, while the exact on-page image or text may change depending on which content is rendered by the template.
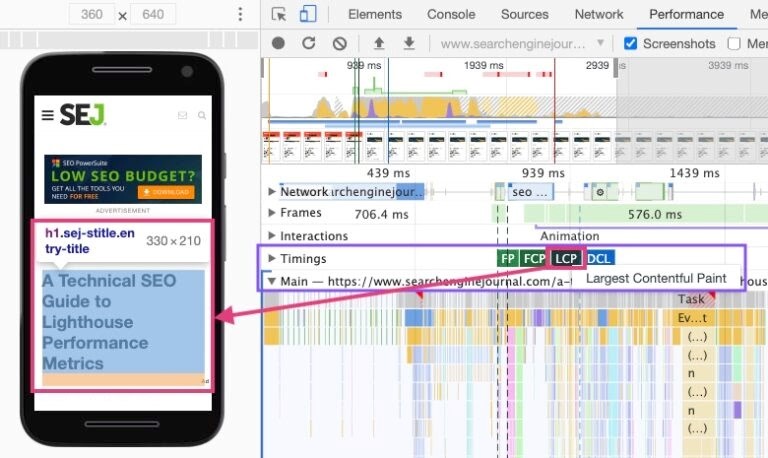
How To Define LCP Using Chrome Devtools
- Open the page in Chrome.
- Navigate to the Performance panel of Dev Tools (Command + Option + I on Mac or Control + Shift + I on Windows and Linux).
- Hover over the LCP marker in the Timings section.
- The element(s) that correspond to LCP is detailed in the Related Node field.
What Causes Poor LCP?
Poor LCP typically comes from four issues:
- Slow server response times.
- Render-blocking JavaScript and CSS.
- Resource load times.
- Client-side rendering.
How To Fix Poor LCP
If the cause is slow server response time:
- Optimize your server.
- Route users to a nearby CDN.
- Cache assets.
- Serve HTML pages cache-first.
- Establish third-party connections early.
If the cause is render-blocking JavaScript and CSS:
- Minify CSS.
- Defer non-critical CSS.
- Inline critical CSS.
- Minify and compress JavaScript files.
- Defer unused JavaScript.
- Minimize unused polyfills.
If the cause is resource load times:
- Optimize and compress images.
- Preload important resources.
- Compress text files.
- Deliver different assets based on the network connection (adaptive serving).
- Cache assets using a service worker.
If the cause is client-side rendering:
- Minimize critical JavaScript.
- Use another rendering strategy.
Resources For Improving LCP
- Largest Contentful Paint (LCP) web.dev.
- Optimize Largest Contentful Paint web.dev.
- Lighthouse Largest Contentful Paint web.dev.
Total Blocking Time (TBT)
- What it represents: Responsiveness to user input.
- Lighthouse Performance score weighting: 30%
- What it measures: TBT measures the time between First Contentful Paint and Time to Interactive. TBT is the lab equivalent of First Input Delay (FID) – the field data used in the Chrome User Experience Report and Google’s upcoming Page Experience ranking signal.
- How it’s measured: The total time in which the main thread is occupied by tasks taking more than 50ms to complete. If a task takes 80ms to run, 30ms of that time will be counted toward TBT. If a task takes 45ms to run, 0ms will be added to TBT.
- Is Total Blocking Time a Web Core Vital? Yes! It’s the lab data equivalent of First Input Delay (FID).
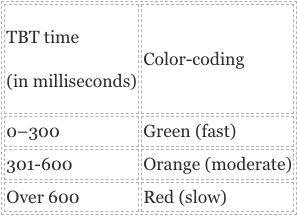
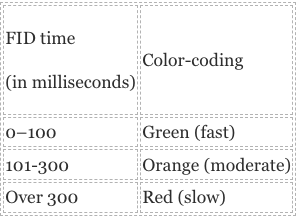
TBT Scoring
- Goal: Achieve TBT score of fewer than 300 milliseconds.
First Input Delay, the field data equivalent to TBT, has different thresholds.
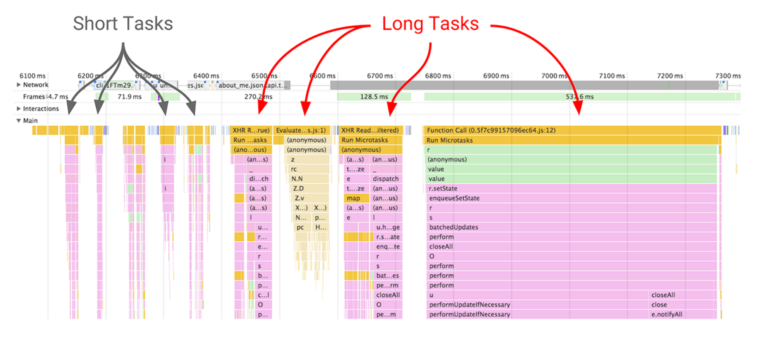
Long Tasks And Total Blocking Time
TBT measures long tasks – those taking longer than 50ms.
When a browser loads your site, there is essentially a single-line queue of scripts waiting to be executed.
Any input from the user has to go into that same queue.
When the browser can’t respond to user input because other tasks are executing, the user perceives this as lag.
Essentially, long tasks are like that person at your favorite coffee shop who takes far too long to order a drink.
Like someone ordering a 2% venti four-pump vanilla, five-pump mocha whole-fat froth, long tasks are a major source of bad experiences.
What Causes A High TBT On Your Page?
Heavy JavaScript.
That’s it.
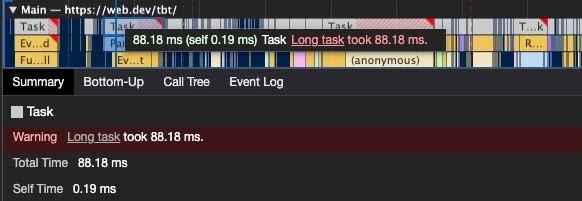
How To See TBT Using Chrome Devtools
How To Fix Poor TBT
- Break up Long Tasks.
- Optimize your page for interaction readiness.
- Use a web worker.
- Reduce JavaScript execution time.
Resources For Improving TBT
- First Input Delay (FID) web.dev.
- Total Blocking Time (TBT) web.dev.
- Optimize First Input Delay web.dev.
- Lighthouse: Total Blocking Time web.dev.
First Contentful Paint (FCP)
- What it represents: FCP marks the time at which the first text or image is painted (visible).
- Lighthouse Performance score weighting: 10%
- What it measures: The time when I can see the page I requested is responding. My thumb can stop hovering over the back button.
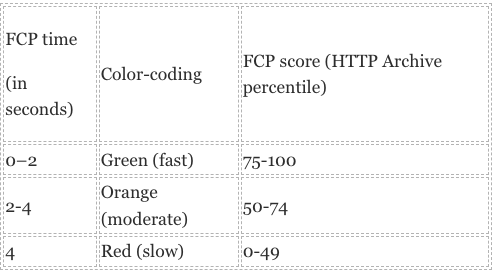
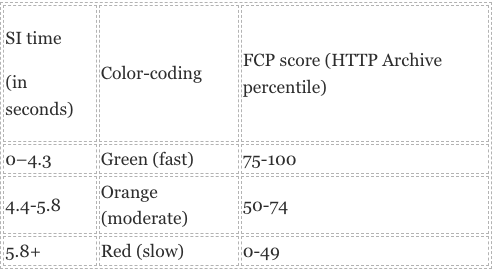
- How it’s measured: Your FCP score in Lighthouse is measured by comparing your page’s FCP to FCP times for real website data stored by the HTTP Archive.
- Your FCP increases if it is faster than other pages in the HTTP Archive.
- Is First Contentful Paint a Web Core Vital? No
FCP Scoring
- Goal: Achieve FCP in < 2 seconds.
What Elements Can Be Part Of FCP?
The time it takes to render the first visible element to the DOM is the FCP.
Anything that happens before an element that renders non-white content to the page (excluding iframes) is counted toward FCP.
Since iframes are not considered part of FCP, if they are the first content to render, FCP will continue counting until the first non-iframe content loads, but the iframe load time isn’t counted toward the FCP.
The documentation around FCP also calls out that it is often impacted by font load time, and there are tips for improving font loads.
FCP Using Chrome Devtools
- Open the page in Chrome.
- Navigate to the Performance panel of Dev Tools (Command + Option + I on Mac or Control + Shift + I on Windows and Linux).
- Click on the FCP marker in the Timings section.
- The summary tab has a timestamp with the FCP in ms.
How To Improve FCP
For content to be displayed to the user, the browser must first download, parse, and process all external stylesheets it encounters before it can display or render any content to a user’s screen.
The fastest way to bypass the delay of external resources is to use in-line styles for above-the-fold content.
To keep your site sustainably scalable, use an automated tool like penthouse and Apache’s mod_pagespeed.
These solutions will come with some restrictions to functionalities, require testing, and may not be for everyone.
Universally, we can all improve our site’s time to First Contentful Paint by reducing the scope and complexity of style calculations.
If a style isn’t being used, remove it.
You can identify unused CSS with Chrome Dev Tool’s built-in Code Coverage functionality.
Use better data to make better decisions.
Like TTI, you can capture real user metrics for FCP using Google Analytics to correlate improvements with KPIs.
Resources For Improving FCP
Speed Index
- What it represents: How much is visible at a time during load.
- Lighthouse Performance score weighting: 10%
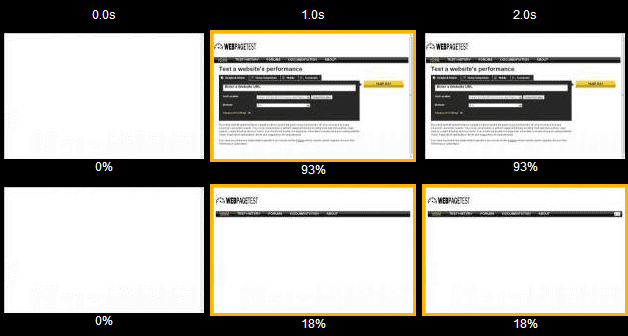
- What it measures: The Speed Index is the average time at which visible parts of the page are displayed.
- How it’s measured: Lighthouse’s Speed Index measurement comes from a node module called Speedline.
You’ll have to ask the kindly wizards at webpagetest.org for the specifics, but roughly, Speedline scores vary by the size of the viewport (read as device screen) and have an algorithm for calculating the completeness of each frame.
- Is Speed Index a Web Core Vital? No.
SI Scoring
- Goal: achieve SI in < 4.3 seconds.
How To Improve SI
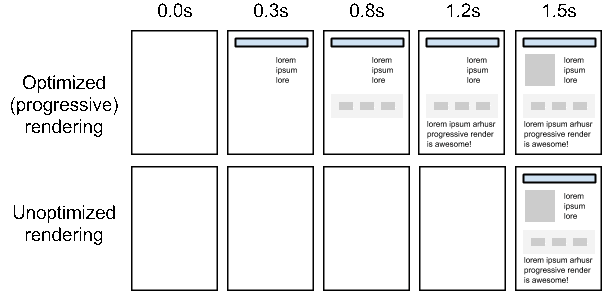
Speed score reflects your site’s Critical Rendering Path.
A “critical” resource means that the resource is required for the first paint or is crucial to the page’s core functionality.
The longer and denser the path, the slower your site will be to provide a visual page.
If your path is optimized, you’ll give users content faster and score higher on Speed Index.
How The Critical Path Affects Rendering
Lighthouse recommendations commonly associated with a slow Critical Rendering Path include:
- Minimize main-thread work.
- Reduce JavaScript execution time.
- Minimize Critical Requests Depth.
- Eliminate Render-Blocking Resources.
- Defer offscreen images.
Resources For Improving SI
Time To Interactive
- What it represents: Load responsiveness; identifying where a page looks responsive but isn’t yet.
- Lighthouse Performance score weighting: 10%
- What it measures: The time from when the page begins loading to when its main resources have loaded and are able to respond to user input.
- How it’s measured: TTI measures how long a page takes to become fully interactive. A page is considered fully interactive when:
1. The page displays useful content, which is measured by the First Contentful Paint.
2. Event handlers are registered for the most visible page elements.
3. The page responds to user interactions within 50 milliseconds.
- Is Time to Interactive a Web Core Vital? No
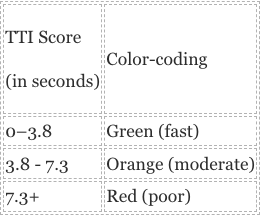
TTI Scoring
Goal: achieve TTI score of fewer than 3.8 seconds.
Resources For Improving TTI
Cumulative Layout Shift (CLS)
- What it represents: A user’s perception of a page’s visual stability.
- Lighthouse Performance score weighting: 15%
- What it measures: It quantifies shifting page elements through the end of page load.
- How it’s measured: Unlike other metrics, CLS isn’t measured in time. Instead, it’s a calculated metric based on the number of frames in which elements move and the total distance in pixels the elements moved.
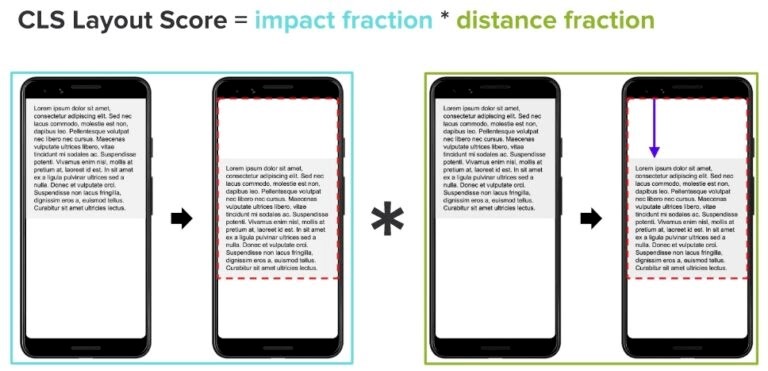
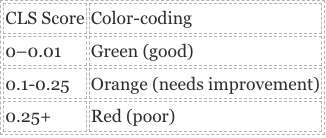
CLS Scoring
- Goal: achieve CLS score of less than 0.1.
What Elements Can Be Part Of CLS?
Any visual element that appears above the fold at some point in the load.
That’s right – if you’re loading your footer first and then the hero content of the page, your CLS is going to hurt.
Causes Of Poor CLS
- Images without dimensions.
- Ads, embeds, and iframes without dimensions.
- Dynamically injected content.
- Web Fonts causing FOIT/FOUT.
- Actions waiting for a network response before updating DOM.
How To Define CLS Using Chrome Devtools
- Open the page in Chrome.
- Navigate to the Performance panel of Dev Tools (Command + Option + I on Mac or Control + Shift + I on Windows and Linux).
- Hover and move from left to right over the load screenshots (ensure the screenshots checkbox is checked).
- Watch for elements bouncing around after the first paint to identify elements causing CLS.
How To Improve CLS
Once you identify the element(s) at fault, you’ll need to update them to be stable during the page load.
For example, if slow-loading ads are causing a high CLS score, you may want to use placeholder images of the same size to fill that space as the ad loads to prevent the page shifting.
Some common ways to improve CLS include:
- Always include width and height size attributes on images and video elements.
- Reserve space for ad slots (and don’t collapse it).
- Avoid inserting new content above existing content.
- Take care when placing non-sticky ads near the top of the viewport.
- Preload fonts.
CLS Resources
- Optimize Cumulative Layout Shift web.dev.
- Cumulative Layout Shift (CLS) web.dev.
- Cumulative Layout Shift (CLS) in AMP – The AMP Blog.
- Cumulative Layout Shift (CLS) Calculator.
How To Test Performance Using Google Lighthouse
Methodology Matters
Out of the box, Lighthouse audits a single page at a time.
A single page score doesn’t represent your site, and a fast homepage doesn’t mean a fast site.
Test multiple page types within your site.
Identify your major page types, templates, and goal conversion points (signup, subscribe, and checkout pages).
If 40% of your site is blog posts, make 40% of your testing URLs blog pages!
Example Page Testing Inventory
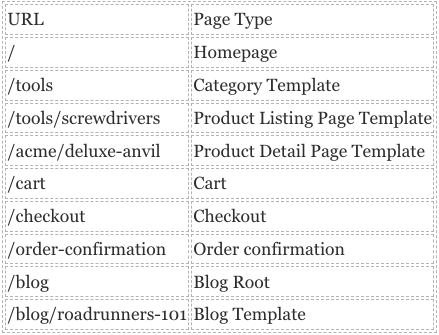
Before you begin optimizing, run Lighthouse on each sample page and save the report data.
Record your scores and the to-do list of improvements.
Prevent data loss by saving the JSON results and utilizing Lighthouse Viewer when detailed result information is needed.
Get Your Backlog to Bite Back Using ROI
Getting development resources to action SEO recommendations is hard.
An in-house SEO professional could destroy their pancreas by having a birthday cake for every backlogged ticket’s birthday. Or at least learn to hate cake.
In my experience as an in-house enterprise SEO pro, the trick to getting performance initiatives prioritized is having the numbers to back the investment.
This starting data will become dollar signs that serve to justify and reward development efforts.
With Lighthouse testing, you can recommend specific and direct changes (Think preload this font file) and associate the change to a specific metric.
Chances are you will have more than one area flagged during tests. That’s okay!
If you’re wondering which changes will have the most bang for the buck, check out the Lighthouse Scoring Calculator.
How To Use Google Lighthouse To Run Tests
This is a case of many roads leading to Oz.
Sure, some scarecrow might be particularly loud about a certain brick shade, but it’s about your goals.
Looking to test an entire staging site? Time to learn some NPM.
Have less than five minutes to prep for a prospective client meeting? A couple of one-off reports should do the trick.
Whichever way you execute, default to mobile unless you have a special use case for desktop.
What Is the Difference Between Google Lighthouse And PageSpeed Insights?
PageSpeed Insights allows you to test one page at a time. Simply enter the URL.
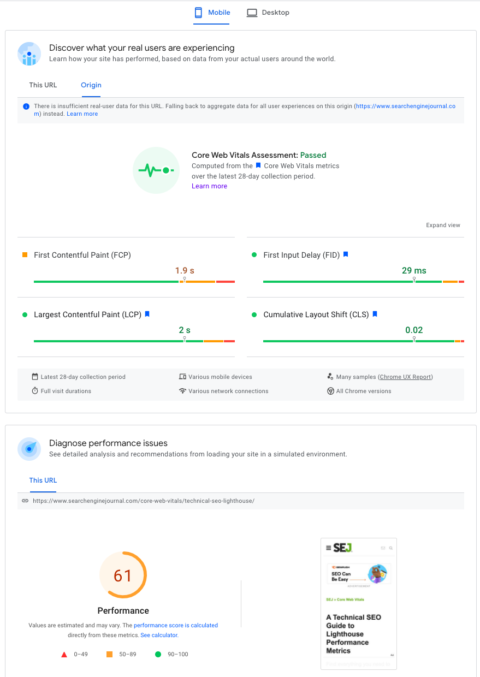
Pros Of Running Google Lighthouse From PageSpeed Insights
- The detailed Lighthouse report is combined with URL-specific data from the Chrome User Experience Report.
- Opportunities and Diagnostics can be filtered to specific metrics. This is exceptionally useful when creating tickets for your engineers and tracking the resulting impact of the changes.
- PageSpeed Insights is already running version 9.
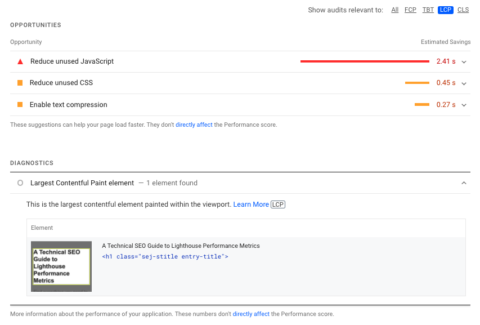
Screenshot from PageSpeed Insights, January 2022
Cons Of Running Google Lighthouse From PageSpeed Insights
- One report at a time.
- Only Performance tests are run (if you need SEO, Accessibility, or Best Practices, you’ll need to run those separately)
- You can’t test local builds or authenticated pages.
- Reports can’t be saved in JSON, HTML, or Gist format. (Save as PDF via browser functionality is an option.
- Requires you to manually save results.
For Comparing Test Results: Chrome DevTools Or Web.dev
Because the report will emulate a user’s experience using your browser, use an incognito instance with all extensions and the browser’s cache disabled.
Pro-tip: Create a Chrome profile for testing. Keep it local (no sync enabled, password saving, or association to an existing Google account), and don’t install extensions for the user.
How To Run A Test Lighthouse Using Chrome DevTools
- Open an incognito instance of Chrome.
- Navigate to the Network panel of Chrome Dev Tools (Command + Option + I on Mac or Control + Shift + I on Windows and Linux).
- Tick the box to disable cache.
- Navigate to the Lighthouse panel.
- Click Generate Report.
- Click the dots to the right of the URL in the report
- Save in your preferred format (JSON, HTML, or Gist)
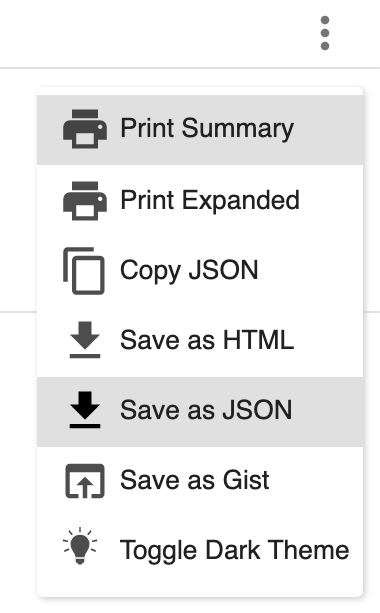
Screenshot from Lighthouse Reports, January 2022
Note that your version of Lighthouse may change depending on what version of Chrome you’re using. v8.5 is used on Chrome 97.
Lighthouse v9 will ship with DevTools in Chrome 98.
How To Run A Test Lighthouse Using Web.Dev
It’s just like DevTools, but you don’t have to remember to disable all those pesky extensions!
- Go to web.dev/measure.
- Enter your URL.
- Click Run Audit.
- Click View Report.
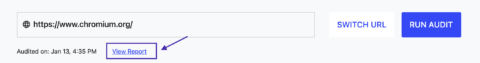
Screenshot by author, January 2022
Pros Of Running Lighthouse From DevTools/web.dev
- You can test local builds or authenticated pages.
- Saved reports can be compared using the Lighthouse CI Diff tool.

Screenshot from Lighthouse CI Diff, January 2022
Cons Of Running Lighthouse From DevTools/web.dev
- One report at a time.
- Requires you to manually save results.
For Testing At Scale (and Sanity): Node Command Line
1. Install npm.
(Mac Pro-tip: Use homebrew to avoid obnoxious dependency issues.)
2. Install the Lighthouse node module with npm
install -g lighthouse
3. Run a single text with
lighthouse <url>
4. Run tests on lists of usings by running tests programmatically.
Pros Of Running Lighthouse From Node
- Many reports can be run at once.
- It can be set to run automatically to track change over time.
Cons Of Running Lighthouse From Node
- Requires some coding knowledge.
- More time-intensive setup.
Conclusion
The complexity of performance metrics reflects the challenges facing all sites.
We use performance metrics as a proxy for user experience – that means factoring in some unicorns.
Tools like Google’s Test My Site and What Does My Site Cost? can help you make conversion and customer-focused arguments for why performance matters.
Hopefully, once your project has traction, these definitions will help you translate Lighthouse’s single performance metric into action tickets for a skilled and collaborative engineering team.
Track your data and shout it from the rooftops.
As much as Google struggles to quantify qualitative experiences, SEO professionals and devs must decode how to translate a concept into code.
Test, iterate, and share what you learn! I look forward to seeing what you’re capable of, you beautiful unicorn.
More resources:
- Do Google Lighthouse Scores Affect SEO?
- Core Web Vitals as a Google Ranking Factor: What You Need to Know
- Core Web Vitals: A Complete Guide
Featured Image: Paulo Bobita/Search Engine Journal
