

In October, Google announced the most significant change to Google Analytics ever: Google Analytics 4.
There is a lot to learn with large updates and it’s natural to wonder how this will affect your job or business.
While we’ve not heard any indication that traditional GA will be going anywhere anytime soon, new properties now default to GA4. This is a strong sign that learning Google Analytics 4 is worth prioritizing.
In this complete guide, you’ll learn everything you need to know to get started with Google Analytics 4:
- What’s Changed.
- Making the Switch to GA4.
- How GA4 Helps Reporting.
- Best Ways to Use GA4 Reports.
Google Analytics 4: What’s Changed?
In short… a lot.
GA4 uses a significantly different data structure and data collection logic.
Now, everything is built around users and events – not sessions, as we’ve been used to.
An events-based model processes each user interaction as a standalone event.
This change is significant because historically we relied on a session-based model which grouped user interactions within a given time frame.
Moving the focus from sessions to events provides major benefits to marketers such as cross-platform analysis and an enhanced capacity for pathing analysis.
By moving to an event-based model, GA4 is more flexible and better able to predict user behavior.
Should I Switch To Google Analytics 4?
This is the big question – do you need to switch to Google Analytics 4 right now?
Short answer: yes.
Set up a GA4 property to run in parallel with Universal Analytics.
Even if you don’t plan on using it right away, collecting data and strengthening your machine learning (ML) models will make future analysis more meaningful.
Better data collection = better-informed marketing strategies.
How To Set Up GA4
Configuring GA4 is as simple as a few clicks.
The analytics property you are familiar with will be left unchanged, continuing to collect data. Your UA view will continue to be accessible via the admin screen.
Here’s how to connect a new GA4 data stream to your current Universal Analytics. (If you are setting up a brand new property, refer to Google Tag Manager: A GA4 Beginner’s Guide.)
Steps For Configuring GA4
- Login to your Google Analytics Account.
- Click Admin. Gear icon, bottom left navigation.
- Confirm that your desired account is selected.
- Confirm the desired property is selected.
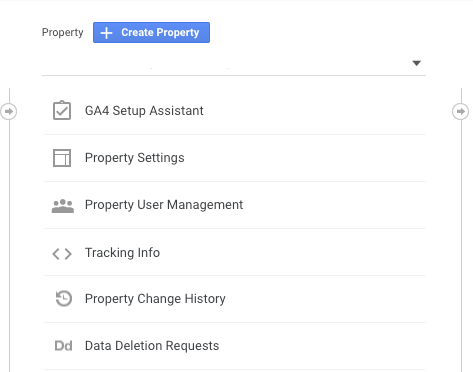
- Click GA4 Setup Assistant, the first option in the Property column.
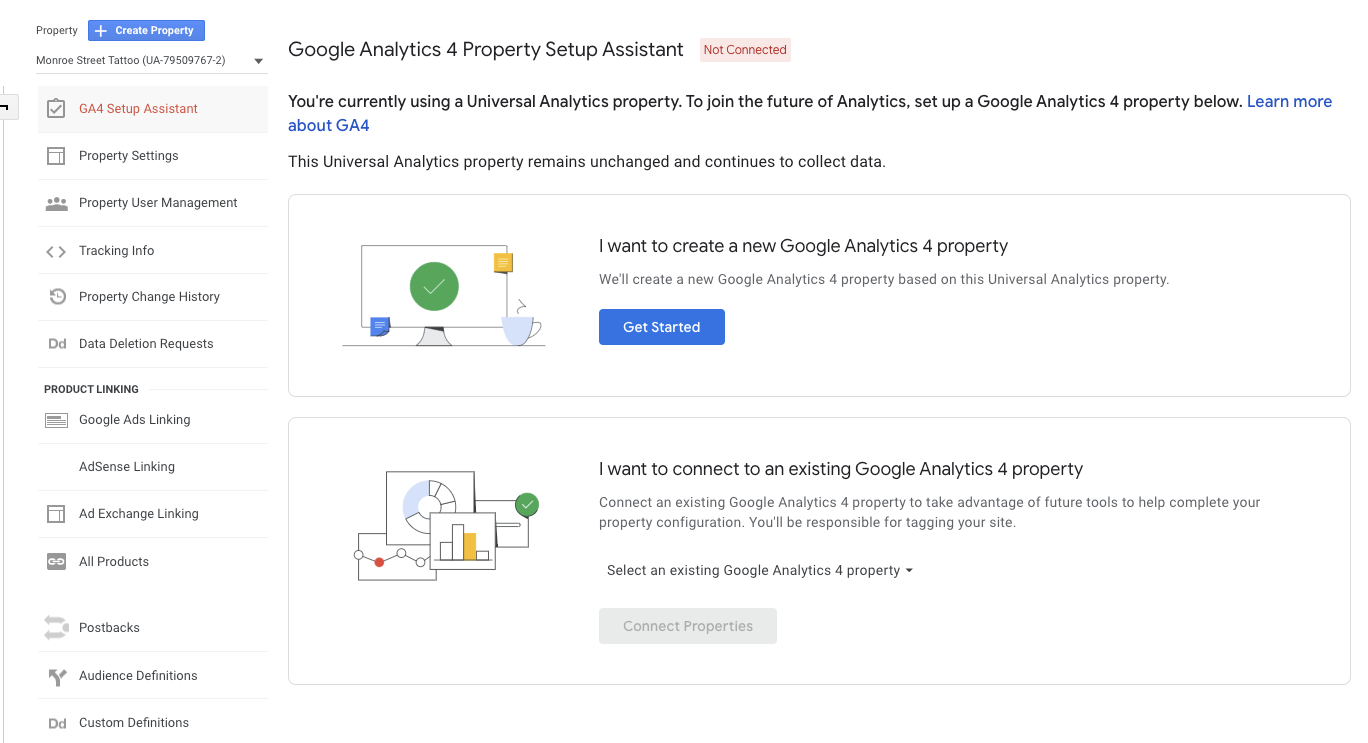
Once inside the Setup Wizard, click the large blue button, Get Started.
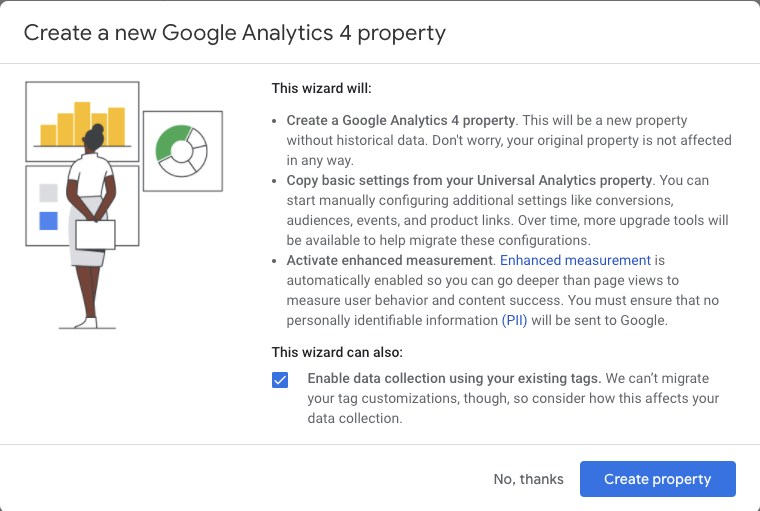
There is only one more step, click the blue button to Create property.
It truly is this easy!
Important Note: The GA4 setup assistant works automatically with gtag.js. If you use a website builder such as WordPress, Wix, etc., you will need to add the Analytics tag yourself.
Event Tracking
After creating your property, the setup assistant will automatically activate enhanced measurement in your Google Analytics 4 property.
Custom code is still needed to track third-party elements and form submissions but the most basic forms of event tracking are automatic and ready to go.
How Does GA4 Help With Reporting?
A data collection strategy is only as strong as the information you can extract from it.
So how will switching to GA4 help with reporting?
With the push for user privacy, it’s becoming increasingly difficult to track users as they travel across multiple platforms, using multiple devices.
GA4 is a forward-thinking solution using enhanced machine learning techniques to help fill in the missing data gap. Creating a single user journey for all data linked to the same identity.
Lastly, GA4 simplified the reporting interface making it really easy for marketers to spot key trends and irregularities in data.
Instead of a long list of predefined reports that try to cover every use case, GA4 uses overview reports in summary cards. If you want to dig in deeper, simply click on the scorecard.
Best Ways To Use Google Analytics 4 Reports
This final section of getting to know Google Analytics 4 will cover the best ways to use GA4 reports.
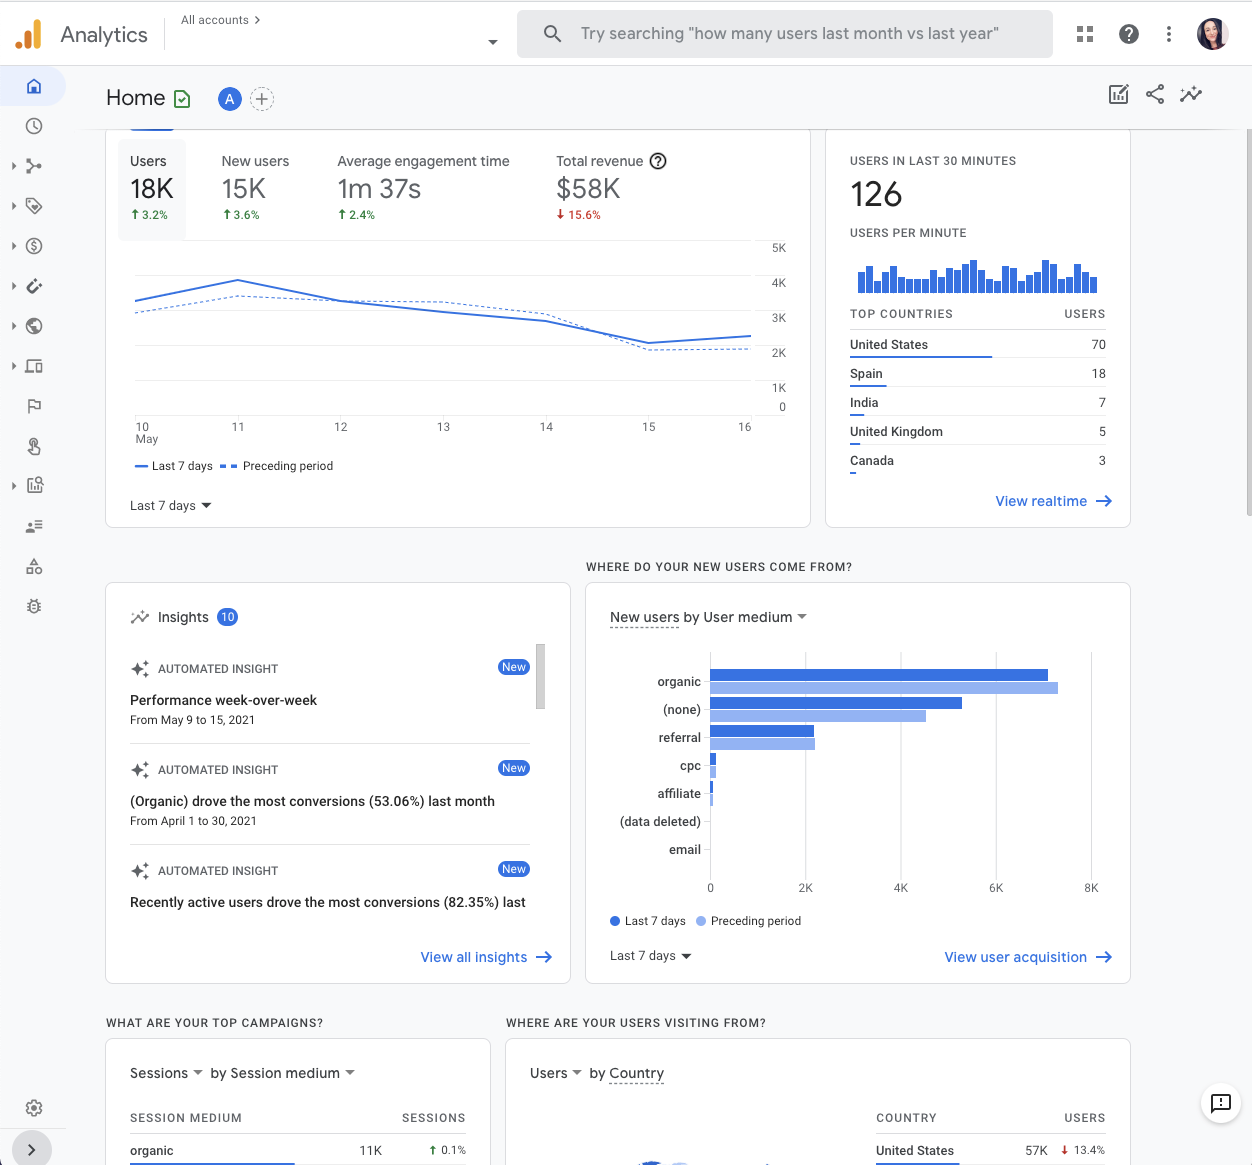
When you first log in, you’ll see that the home page summarizes overall traffic, conversions, and revenue for that property. This is best used as a quick check to make sure everything is behaving as expected.
Your home page report will quickly answer:
- Where do new users come from?
- What are your top-performing campaigns?
- Which pages and screens get the most views?
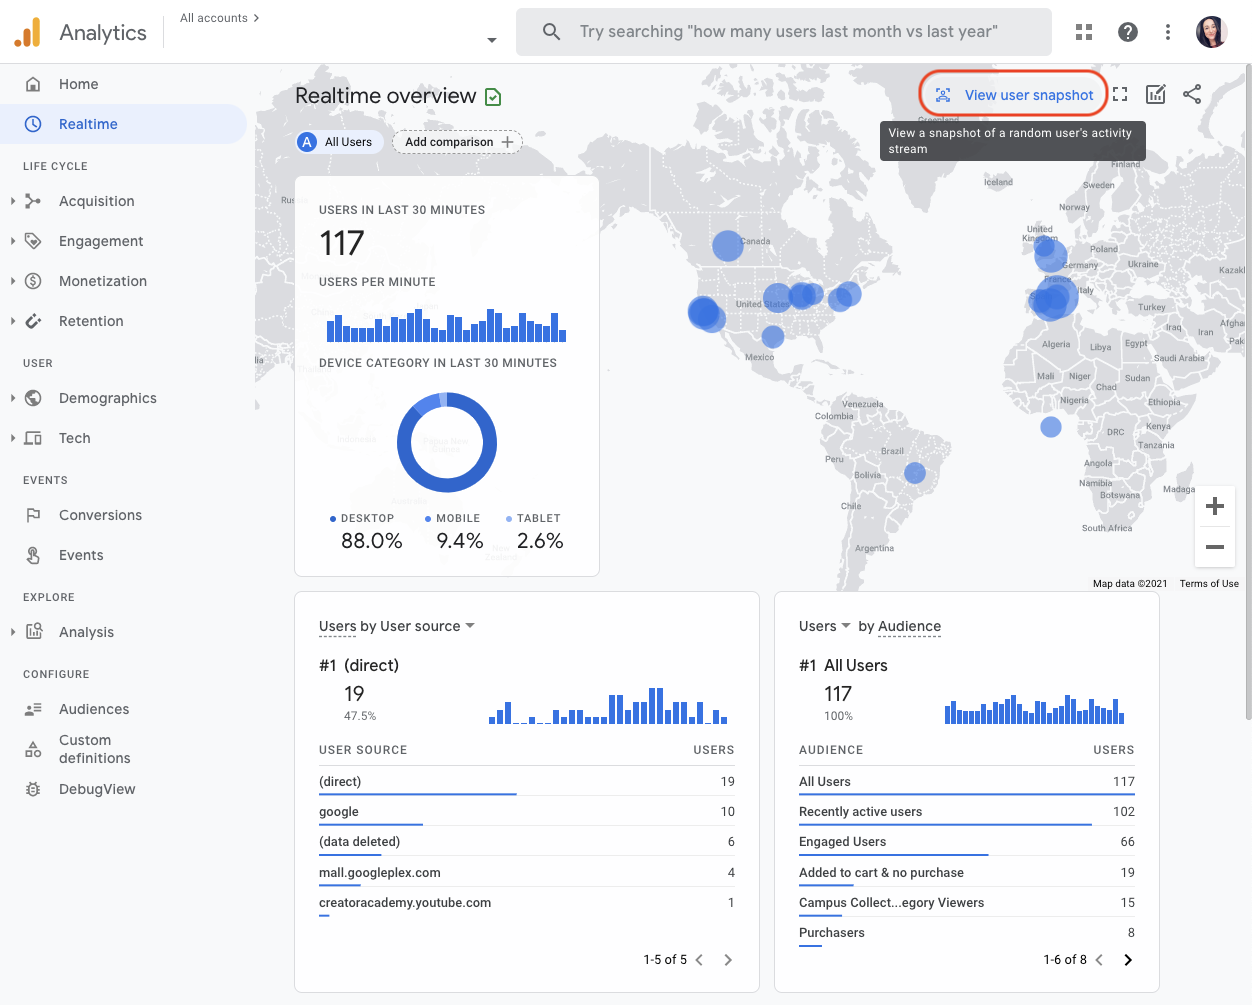
Realtime Report
Realtime report is the next default report in the left navigation, and it shows events that happened within the past 30 minutes.
Use the Realtime Report to quickly:
- Confirm tracking code is working.
- View Effects from a YouTube Video.
- View New Product Drop, as it happens in real time.
Cool Feature: “View User Snapshot”
Click View user snapshot in the top right corner of the Realtime report to see a literal snapshot for a single user.
This includes information about the user’s device, location, and real-time engagement with the site/app through events triggered.
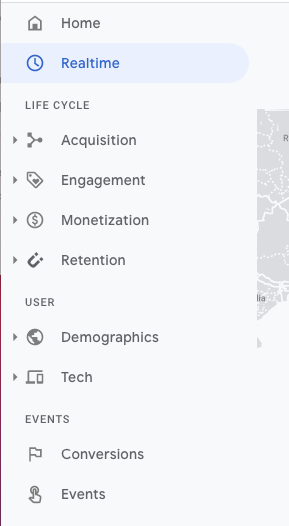
Life Cycle Reporting
Life Cycle reporting mirrors the funnel of acquiring, engaging, monetizing, and retaining users.
It’s ideal for analyzing how users enter the conversion funnel and how they behave once they’re in the funnel.
Life Cycle Reports will quickly answer:
- How do users enter the conversion funnel?
- How do users behave once they’re in the funnel?
GA4 also includes user reports on demographics and technology, as well as events and conversions.
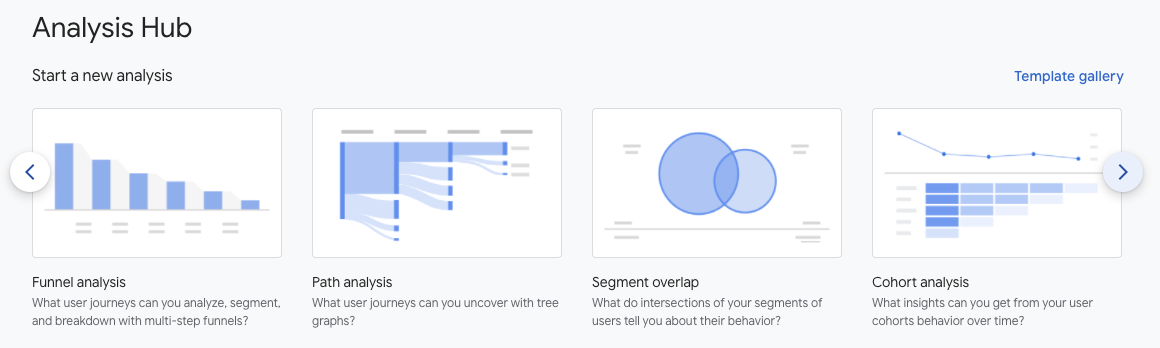
Explorer Reports: Analysis
This may be the most powerful change in GA4 (or at least what I think will be the most beneficial for marketers): the new Analysis Hub.
While default reports help you monitor key business metrics, the GA4 Analysis Hub gives you access to several advanced techniques and a template gallery that isn’t available anywhere else.
Creating A New Analysis
- Login to your Google Analytics Account.
- Click Analysis.
- Graph with magnifying glass icon, bottom left navigation under Explore.
- Select the technique you want to use to analyze your data.
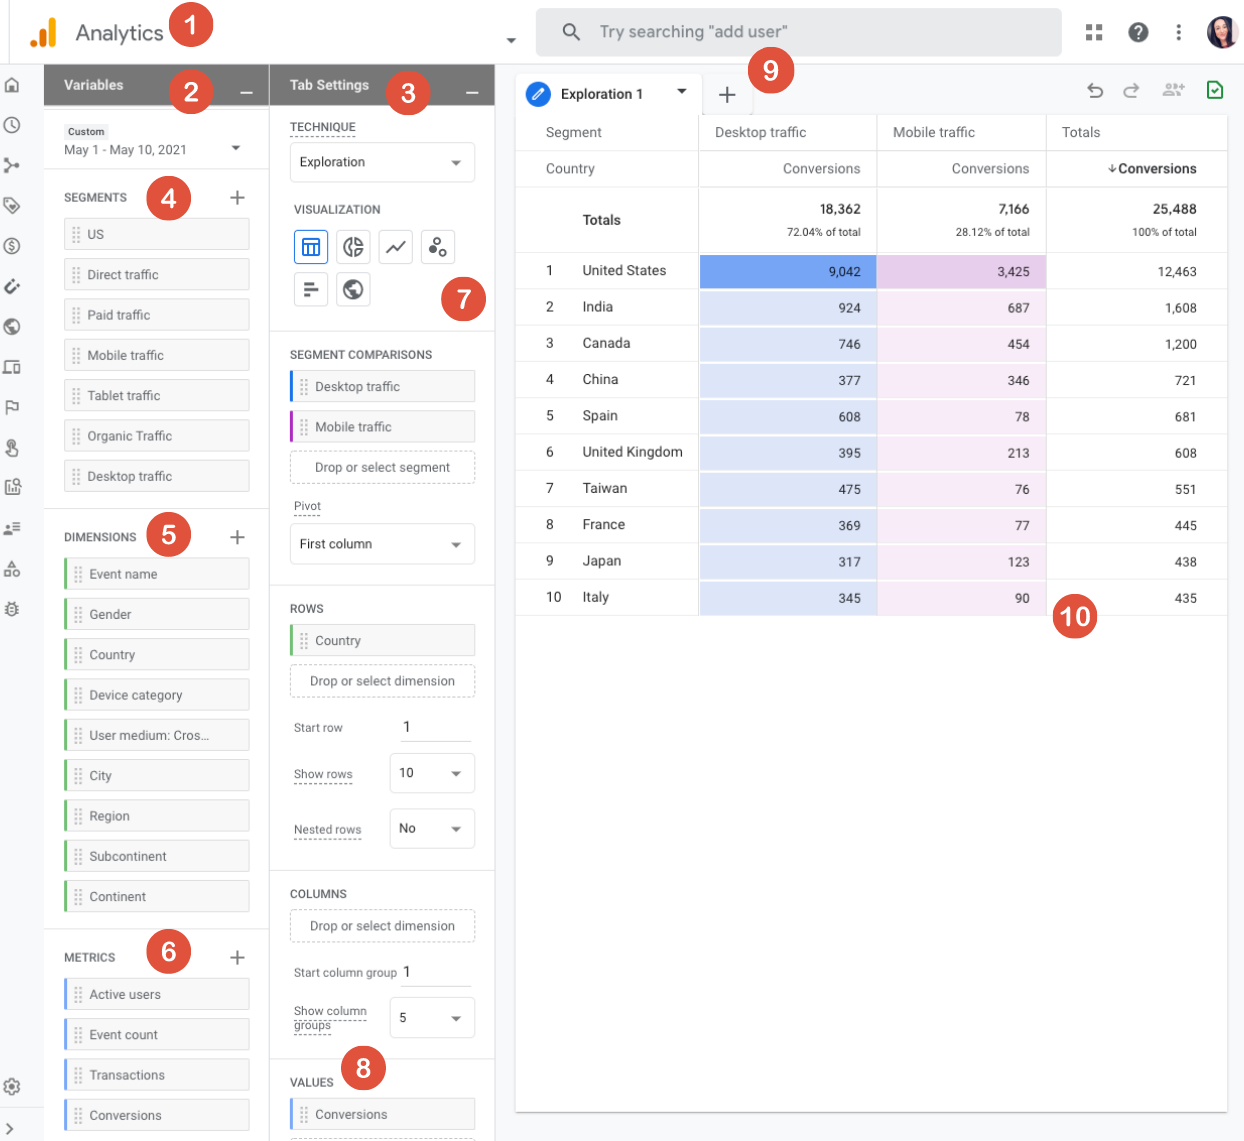
How To Read Analysis Hub Reports
- Return to the Analysis Hub.
- Variables Column: The variables column is where you will select the data you want to use in your analysis. Date range, segments, dimensions, metrics.
- Tab Settings Column: The tab settings column is where you will specify the analysis technique, add dimensions, metrics and apply segments.
- Segments: Segments are different groups of users. Drag and drop different groups of users to your report to compare and contrast how they are behaving. If you don’t see the segment you want to use, add your own by clicking on the plus icon.
- Dimensions: Dimensions are the things you want to analyze. For example, event count, active users, transactions, etc. Drag and drop dimensions as rows or columns in the Tab Settings area.
- Metrics: Metrics provide the numbers in your analysis. Add metrics to the Values area in Tab Settings.
- Visualization: Choose what the report will look like. Exploration options include table, pie chart, line graph, and more.
- Values: Drag the metrics that you want to display as columns in the report. Cell type can be displayed as a bar chart, plain text, or heat map.
- Tabs: Tabs display your visualizations. An analysis can contain up to 10 tabs. To add a new tab, click the plus icon.
- Display: Interact with the data by right-clicking a data point in the visualization.
Types Of Analysis
Exploration
GA4 Exploration provides more control over the data visualization than was previously available in Universal Analytics.
There are a ton of configuration options within exploration to help you uncover new insights and represent your data in a way that makes sense to your team or client.
One of my favorite features within exploration is anomaly detection because it automatically flags any data points that are outside of what the expected outcome was.
Funnel Analysis
How do website visitors become one-time shoppers and then how do one-time shoppers become repeat customers?
Find out in the GA4 funnel analysis report. Here, you can visualize the steps shoppers take to complete an event and see how well they are succeeding or failing at each step.
Path Analysis
If you liked the behavior flow reports in universal analytics, you will love the analysis hub pathing reports in GA4.
Path analysis visualizes the event stream in what is known as a “tree graph.” An event stream is the series of events users triggered along their path.
The path analysis technique helps marketers uncover looping behavior which may indicate users becoming stuck.
Segment Overlap
Segments can be used in both Universal Analytics and Google Analytics 4 properties.
In GA4, segments can be used as user events or sessions. Marketers can even build segments containing multiple conditions and arrange those into a “condition group.”
Think of a segment as a specific group of your site users. For example, a segment may be users from a specific city, those who visited a specific page, or users who took a specific action such as purchasing from a particular product category.
Cohort Analysis
A cohort is a group of users with a common characteristic, such as the same acquisition date, an event, or conversion.
For example, you can create a cohort report to see how long it takes people to convert in relation to a specific marketing tactic.
User Lifetime
The user lifetime report is extremely powerful for search marketers because it lets you create reports that visualize which source is driving users with the highest lifetime revenue — not just revenue for a selected month.
With GA4, you can uncover the marketing campaigns that are acquiring the most valuable users, with the highest purchase probability and lowest churn probability.
This is thanks to Google Analytics predictions models.
Conclusion
An analytics tool is one of your most powerful marketing weapons. It helps develop an understanding of website traffic and how users behave once on site.
Better analytics insights = better marketing decisions.
GA4 is the analytics upgrade we all needed. It provides marketers with more flexibility and a means to predict user behavior while upholding user privacy.
Once you get through the learning curve, you’ll find GA4’s flexibility and enhanced insights are more than worth it.
2021 SEJ Christmas Countdown:
- #12 – The New Google Business Profile: A Complete Guide For Local SEO
- #11 – How To Automate SEO Keyword Clustering By Search Intent With Python
- #10 – Get to Know Google Analytics 4: A Complete Guide
Featured image: Kapralcev/Shutterstock
All screenshots taken by author.
