


If you own a shopping website, yet aren’t able to accurately pin-point the performance of your search marketing campaigns, you are in luck. The 50+ billion-dollar-per-year company Google provides Google Analytics, a very robust platform designed to do just that. Google Analytics has some pretty amazing features which can easily keep track of your KPI’s such as Return on Ad Spend (ROAS/ROI) or Average Revenue per Transaction.
I regularly hear business owners say they have no idea what their ROI is for their search marketing campaign. You don’t have to be a marketing whiz to find this information. This post will teach you how to pull a very easy to digest report detailing whether or not your campaign is performing well with revenue and ROI reports.
You will need to configure conversion tracking, e-commerce revenue tracking, as well as linking Adwords with Google Analytics in order to make sense of this post. If you hired a professional online marketing company (who is hopefully managing your campaign), you should have this already in place.
I narrowed it down to three reports my clients seem to like the best, and I will show you how to generate these reports and then add them to your Google Analytics shortcuts (or dashboard) so they are easy to find in the future.
First, let’s go over how to create reports that are actionable and that provide meaningful data.
Creating Easy-to-Access KPI Reports
Key Performance Indicator or KPI reports are generally used to show the most important or meaningful data to a business owner or company executive. There are two great tools you can use to manage your KPI reports in Analytics, one is the dashboard and the second is using shortcuts.
The main purpose of using either is to save reports custom reports you’ve made after drilling down into subsets of data in Analytics. You can also combine reports using dashboards so you can see multiple reports in one window that, again, are all pre-configured so you won’t have to spend time putting those reports together in the future when you want to see recent data activity.
Creating Shortcuts on Google Analytics
Let’s go through an example of how to create a short cut, assuming you wanted to view how many conversions each landing page was generating from your PPC campaign broken down by landing page + keyword.
First, let’s drill down into a landing page report by going to your All Traffic report under “Acquisitions”. Then, click on the medium you want to view (i.e. Google organic, Google CPC, or Direct). For this example I used Google CPC.
Once you’re here you can change the primary dimension to landing page and add keyword as a secondary dimension to see only the landing pages used via a specific source/medium (in this case Google CPC), as well as the keywords that were used to find that landing page.
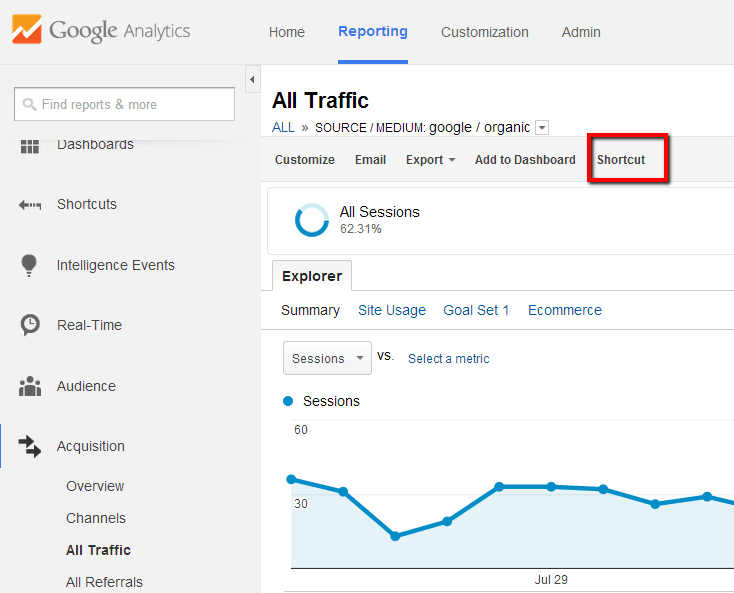
So, how do you add it as a shortcut?
Just click on “create shortcut” at the top of the page and there you have it! You can now access this same report at any time without having to drill down on things. You can even add filters before creating the shortcut and they will be applied to the shortcut report. Filters can be used to strip out internal traffic, traffic from a certain geographic region, or to exclude brand search terms.
Creating Dashboards on Google Analytics
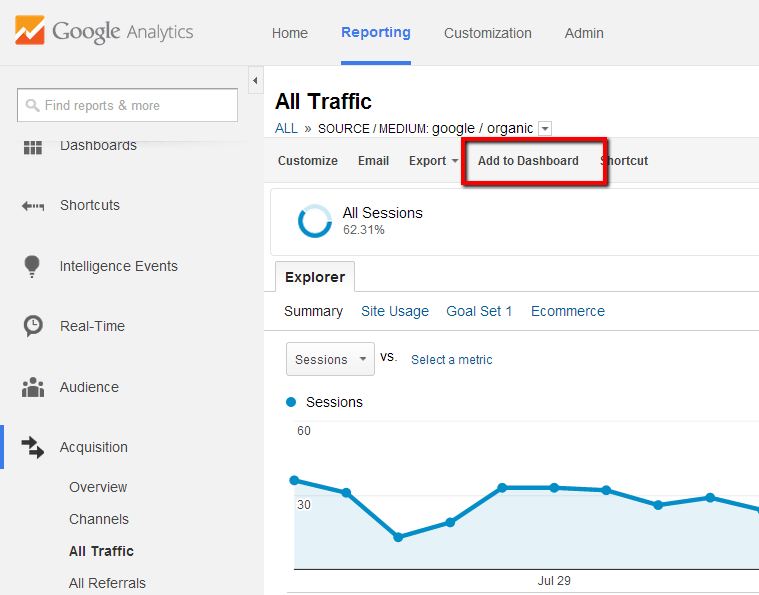
Creating Dashboards are done the same way as shortcuts. You just have to drill down to the report of your liking and then click the “Add to Dashboard” button at the top of most reports that you have available in Analytics.
You can have up to ten widgets (unique reporting windows) for each dashboard. You can also change the layout of your dashboard by using the different layouts available in the preset bank of templates. There are also some great user-created dashboards in the gallery section which you can check out too! One of my favorite is the Brand Omitted reporting dashboard.
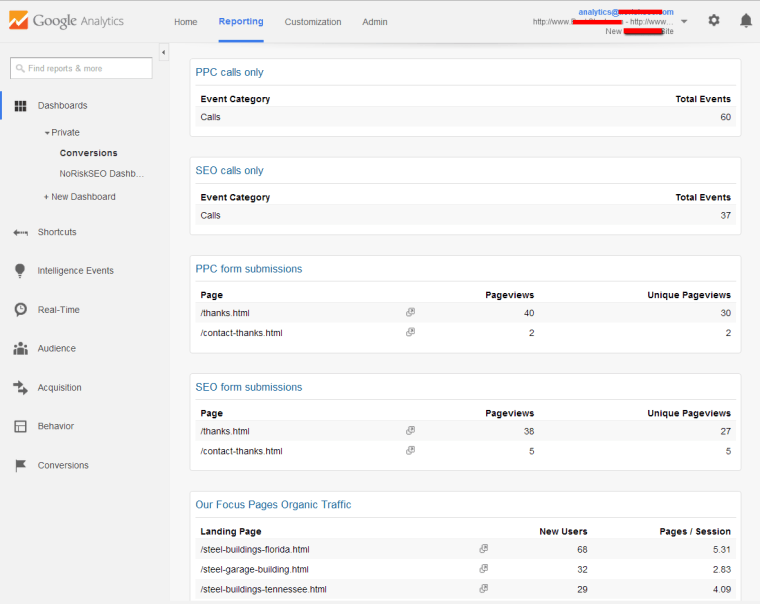
Below is an example of one of the dashboards I set up for a client who wants to be able to see how many phone calls and form submissions he is getting from both the PPC and SEO (organic) campaigns we are managing for him.
3 Awesome KPI Reports that are Easy to Digest
The following reports are what I use to showcase the performance of campaigns I manage for my clients. I thought I would share these reporting methods because a lot of the clients we have really like using them and they’ve become part of our standard reporting methods for clients with e-commerce websites and marketing campaigns.
ROI Reports
Believe it or not, tracking ROI with Google Analytics is not hard. If you’re spending money with Adwords or any other type of pay-per-click advertising method, you should know your ROI. Fortunately, Google analytics makes ROI tracking easy to set up if you have a modern content management system.
You can drill down into your Acquisitions menu then click on “Adwords”, then “Campaigns” where you will be able to toggle to the “Click” report. Your ROI will be displayed as a column afterwards. You can also apply your primary and secondary dimensions and combine it with your ROI.
In the screenshot provided, you can see how we drilled down into the report to show only Shopping campaigns broken down by product ID so that you can see the corresponding ROI for each campaign/product combination. This report has the ability to be added to a dashboard, automatic email alert, and shortcuts section of your account. 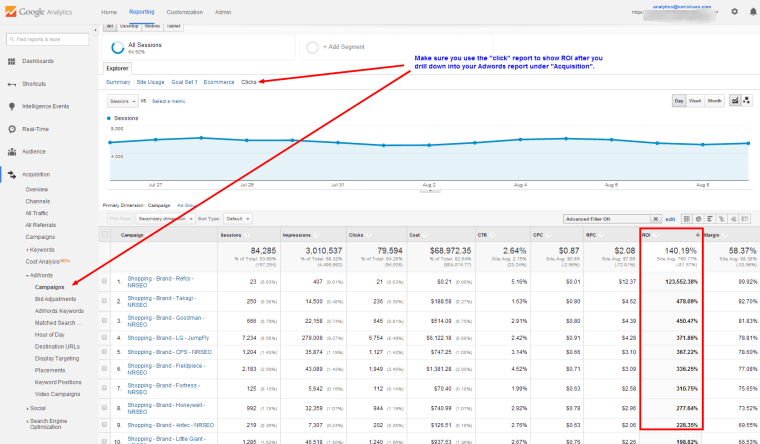
Conversion Reports
Knowing data points such as average revenue per conversion, average per-session value, and e-commerce conversion rate is a great way to tell how your campaign is performing. Having a Google Analytics dashboard available or an automatic email alert scheduled with this data can really help strengthen your confidence in your campaigns.
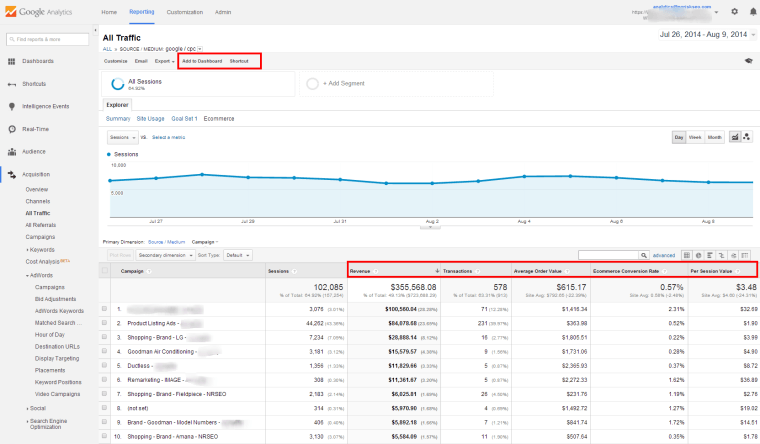
To create a conversion report, click on “Conversions” from the main navigation on the left, then click on “overview” from the “eCommerce” sub menu option. From there, you will want to click on Source/Medium to drill down into a report that shows you how each source/medium is performing according to conversions.
You can click on any source/medium combination from the table to drill down into that source/medium at a more granular level (and there you can optimize the use of primary and secondary dimensions). This report can also be added to dashboards, shortcuts, or automatic email alerts as shown at the top of the page in the screen shot below.
Top Conversion Paths
Knowing that all of your marketing channels are playing a role in the conversion process helps validate the efforts spent on marketing channels which are not as popular as search or social (i.e. email, directory ads, remarketing etc).
With the assisted conversion report, you can start to see how mediums like organic, social, or email marketing play a role in the conversion when shoppers are doing comparison shopping and using multiple mediums + sessions before making the purchase. This is similar to the multi-channel attribution report, as explained on Google’s support page.
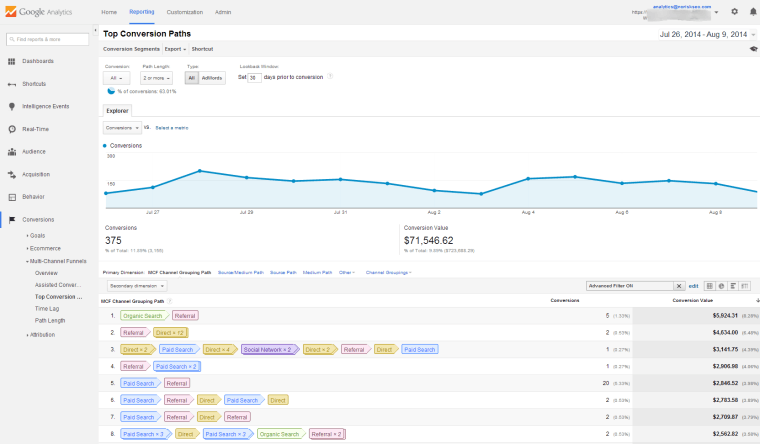
To access your top conversion paths report, click on “Conversions” from the main navigation on the left, then on “Top Conversion Paths” which is under “Multi-Channel Funnels”. Note that you can use the quick filter or advanced segments to drill down on paths that include certain medium interactions like “paid”.
Below is an example of how this report is presented. As you can see, it paints a very easy-to-digest picture of how your channels are assisting your overall conversions.
Monitor Your Newly Created Reports
As a managing member of an Internet marketing company, I’ve dealt with my fair share of business owners that contact us for eCommerce PPC management services or SEO help. In relation to this, I noticed there always seems to be a common denominator with their story. Business owners often do not spend enough time learning how to use tools like Google Analytics and Adwords, which is necessary to measure the success of their marketing efforts.
Hopefully, now you are able to use these reports so you can know whether or not your hard-earned marketing budget is being put to good use. The way I see it is if you spend time managing your company’s finances or profit margins then why wouldn’t you want to learn how to use the one tool that can tell you whether or not your most powerful form of marketing is performing?
While I realize many business owners are too busy to learn how to do SEO or to manage a PPC campaign, I still feel that if every business owner were to spend the time to learn from Google Analytics Training resources, they would probably save themselves a lot of money working with marketing companies that are inadequate or inept.
Knowledge is power!
Image Credits
Featured Image: Created by author for SEJ
All screenshots taken August 2014
