When a website redesign takes place, the first thing I’m always interested in is how that redesign translates into better marketing performance. If you’re an SEO or an online advertiser who owns his or her own business, you may feel that your website needs a “face-lift” from time to time to maintain that fresh look and feel.
Instead of just relying on the assumption that your website needs a re-design, why not find out a way that actually proves if your website truly needs one or not?
Today, I’d like to share how I go about measuring the impact of a website redesign using Google Analytics to see just how advantageous redesigning your website can be. After reading this post, you should be able to put together an easy-to-digest report that shows you how the quality of your traffic increased after redesigning your website.
Some website owners redesign their websites just to give it a better look and feel while others do it to improve marketing performance. Regardless of the reason, one thing is apparent: people like to redesign their websites to keep up with change.
As the years pass, you might have noticed a lot of popular websites undergo face-lifts every few years. Let’s take into consideration Search Engine Journal’s website, which is an industry leading news source for all things related to search marketing. Earlier this year, SEJ redesigned their website to a more modern and user-friendly interface and structure. Managing editor for SEJ Kelsey Jones wrote an announcement post, stating:
We are so excited to debut a sleeker design and a new logo which we feel is a better, updated look for SEJ.
The post Kelsey made goes further into the new features of the design that was debuted in April of 2014. With SEJ being an on online marketing focused company, they took a benchmark report of their traffic performance and compared the performance of their traffic after the redesign took place to see how the traffic performance increased. I was fortunate enough to receive a comparison report (which we can use an example) that showed the decrease in bounce rate and increased time on site after the redesign took place and the stats are outlined in the image below.

Report obtained by SEJ staff
We also compared how the traffic quality performed three months prior to the redesign (January to March of 2014) with an equal date range (three months after the redesign, from April to June 2014). As you can see the web site redesign resulted in a positive 2.98% drop in bounce rate, as well a 5.22% increase in average pages per session.
Bounce rate and average time on site are statistical data points known as ‘metrics’ that online marketers use to gauge the performance of their web traffic (which we will get into next). These types of comparison reports can show you through statistical data just how well your website traffic is performing every time you execute a redesign to keep up with the change in website technology and your competition.
Survival of the Fittest Website
 Via The Miami SEO Company
Long gone are the days where a site could keep the same look and feel for decades, in today’s modern age marketing world it’s not about if you’re going to re-design your website. It’s more about when you’re going to re-design your website.
In today’s competitive online world websites are in a way, prone to an online version of Darwin’s “survival of the fittest” theory. While the Darwinian theory applies to living creatures, similar principles apply to websites. Assuming you own a website and that you’re engaged in online marketing, you have competitors that want to do better than you.
Whether it means having better prices or having a better looking/performing website, competitors are always looking to get an edge over you. Like natural selection, as website technology evolves the website owners who adapt and evolve with technology will keep up with the competition will survive.
Not many avid online shoppers or users like dealing with sites that are outdated because they are accustomed to using websites like Amazon, which provide an amazing user experience. As technology evolves, not only do the websites change but so do the user’s behavior and expectations.
While the strongest animal survives from being able to feed itself and capturing prey, a website must capture visitors and convert them. One of the ways to do this is to improve the condition of your websites usability and visual appeal so that it can compete with the usability and visual appeal of the best competing websites in your industry. Makes sense right?
Understanding that your website presence is one of the most important parts of a sound marketing strategy is crucial. I find myself stressing the importance of having a modern and user-friendly websites to my clients, because it is often grossly misunderstood.
Redesigning your website from time to time to keep up with the changes in online technology is something most consider best practice.
Benchmarking Your Performance
Today, I’d like to shed some light on just how advantageous it can be to give your online asset a face-lift. We will be using a very simple yet effective report from Google Analytics to get the job done. Google Analytics is one of the most reliable and widely used online marketing tools to track the performance of your website traffic. It uses third party tracking cookies that allow you to visualize how your website traffic is performing through metrics like tbounce rate, pages per session, goal conversion rate, and more.
With three easy to interpret metrics from this report, we can benchmark the current performance of a website.
- Bounce rate: Bounce rate is derived from the rate at which visitors come and go without performing any actions on your website.
- Pages per session: The number of pages visitors navigate through during a single session.
- Goal conversion rate: The rate at which visitors are performing goals that you specify which in most cases are either phone calls, form submissions, transactions or other important tasks that you would consider important.
These are metrics which I consider to be important because they tell you if you’re getting the right kind of traffic to your website. Regardless of what industry you might be in, these metrics can tell you a lot about the quality of your traffic and I’d like to explain how with this post.
Generating a Benchmark Report With Google Analytics
If you don’t have Google Analytics installed there are tons of great videos, blog posts, and tutorial slide shows out there that will show you how to install Google Analytics tracking. Once it is set up, you can set up an easy to digest benchmark report that explains how the quality of your traffic is performing prior to executing your design changes.

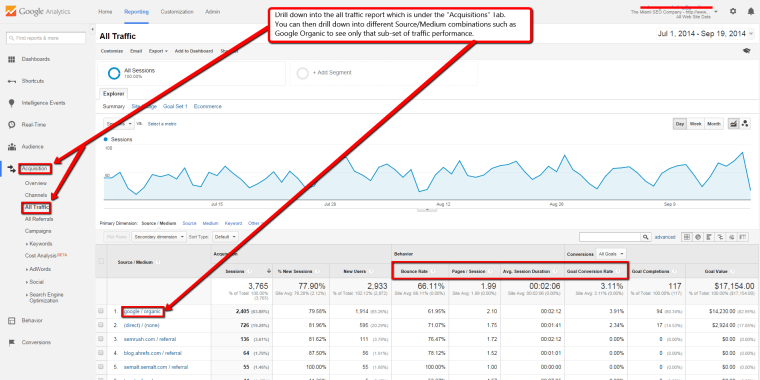
Screenshot taken from: analytics.google.com 9/19/2014
To pull a benchmark report (like the one shown above) which shows bounce rate, pages per session, and conversion rate averages we can rely on the “All Traffic Report” from Google Analytics to do the job. To pull this report, you can follow the following simple instructions:
- Sign into your Google Analytics account and drill down into the property you wish to work on.
- Click on the “Acquisitions” tab on the main navigation to the left of the screen.
- Click on the sub-menu button “All Traffic” that appears.
If you did this correctly you will have a report that looks just like the screen shot above. The report is really insightful and easy to digest if you are familiar with Analytics. For those who are not familiar with Google Analytics, the key data points to really analyze are the ones highlighted in red (which we described previously).
A poor bounce rate indicates that visitors are not engaged by your site’s content when then land on your site, this could be due to many reasons but the most common reasons are:
- Visitors not finding what they are looking for right away
- Visitors are getting confused when looking for what they want on your website
- Visitors are turned off by the look and feel of your website
- Visitors are having problems loading your site
Aside from the Bounce rate, the all traffic report also shows the average pages per session and the average session duration, which can tell you a lot about the quality of your traffic and the way visitors behave when entering your website. A low average visitor duration or pages per session is generally a sign that visitors are not engaged enough to want to explore your website and its many pages.
Most marketing professionals or website owners who are managing their own marketing efforts strive to improve these key metrics in hopes of converting visitors into paying customers at a higher rate. Optimizing your websites metrics to improve these types of metrics is referred to conversion rate optimization (aka C.R.O).
If you’ve pulled a report that shows your bounce rate is above 90%, then I would consider looking for a way to improve that number. If you’re getting a lot of traffic and your visitor duration and pages per visit average is low, then you may also want to consider redesigning your website. I usually try to keep my website’s bounce rate lower than 50%, but I am in an industry which may have a higher bounce rate threshold than others.
Comparing Your Traffic Quality After Your Redesign
First off it’s highly advised that you consult with a professional web design company or individual to ensure you properly redesign your website without harming the SEO presence you’ve worked so hard to build. I recently published a great SEO check list for redesigning your website on my own website that I encourage you to read if you’re considering redesigning your website on your own to ensure that you don’t harm your SEO presence.
After you redesign your website, you can compare the benchmark data points you took before executing the redesign (bounce rate, pages per session, and conversion rate) to see what kind of increase in performance you get with your new site.
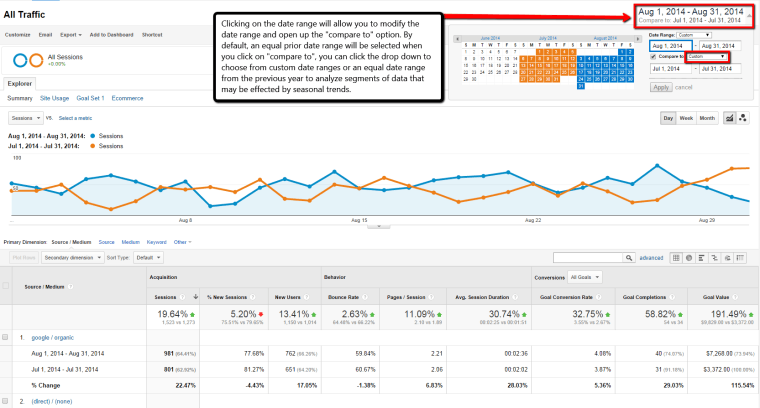
To pull a new report, you can follow the same steps from the section above that explains how to pull the benchmark report that we used as an example or we can use the comparison date range selection to have a comparison report like the one shown below.
 Example screenshot taken from: analytics.google.com 9/19/2014
When you use the comparison date range option in Google Analytics to make the comparison, you can very easily see how your website traffic is reacting to the change. When you perform a test, keep in mind that the bigger the data sample, the more reliable the data. In other words, comparing only one day worth of data after the redesign to one day prior to the redesign won’t tell you much, but if you compare a year worth of data your statistical points are going to be a lot more actionable and reliable.
Using Your Newly Acquired Knowledge
Regardless of your business type or size, optimizing your website to get better traffic is something all business owners should work on (especially if you’re involved with online advertising). Increasing the performance of a website that gets a large amount of traffic and transactions on a daily basis can translate into huge profits.
The same applies for websites that represent small businesses. Hopefully after reading this post, you can confidently execute a website redesign while tracking the impact it has on your traffic quality and marketing performance. If you’re thinking about redesigning your website, I encourage you to share your comparison reports to see how your websites traffic performance improves.
Image Credits
Featured Image: Seyyahil via Shutterstock
Image #1: Provided by Search Engine Journal Staff
Image #2: Created by author for Search Engine Journal


