


About 18% of online sales come from organic search. That’s $500 billion!
What’s more, there’s a universal understanding that having an SEO strategy is hugely beneficial. And yet, according to a survey by Moz, it’s rare for any company to invest more than $10,000 a month for SEO, including in-house SEO managers.
Why?
“It’s hard to attribute the growth and revenue generated from SEO.”
This has always been the biggest problem in SEO.
It causes headaches at the highest level when it comes to budgeting.
In most companies, most of the investment (and praise) goes to the people running paid channels. Paid search. Paid social. Affiliate marketing. Channels where the ROI is measurable.
SEO should be managed the same as paid search – allowing marketers to calculate ROI at the keyword level.
Good news – it can be done!
“Having this transparency is a game-changer that gives legitimacy to the industry and shifts the way businesses look at SEO.”
SEO stops being a problem of how little companies can get away with spending and becomes an opportunity where the investment gets a clear ROI. Life is made easier for digital teams, as SEO specialists automate the long-tail of SEO, delivering an uplift to the overall business.
In this article, you will learn some ways to measure the ROI for SEO. There’s a manual approach and a scalable approach. Either way, you can start getting clarity, and pave the way for unlocking budgets and revenues.
Method 1: Calculating the Value of Non-Brand Conversions
As Moz points out in their article the true measure of the value of SEO excludes traffic from “Brand keywords.” Brand keywords mean any search including your website or company brand.
For example, if you’re a fan of TOMS shoes, you would google “Toms shoes.” That’s a Brand search.
Normally, these make up most of any website’s SEO traffic. For example, check out the Top 15 keyword searches that bring traffic to toms.com:
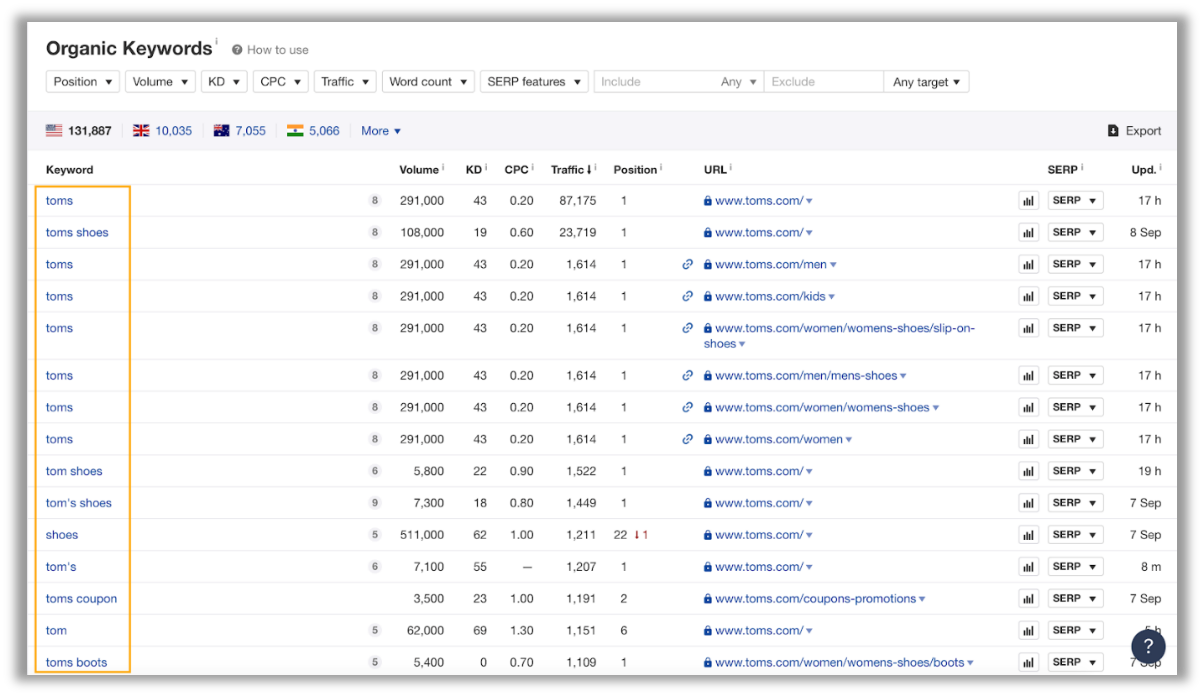
A prospect probably wouldn’t decide to buy shoes because they learned about TOMS for the first time from Googling “sustainable shoes.” They may have heard about the brand from any of these channels:
- Seeing a TOMS ad on Instagram, then Googled the brand name.
- Hearing about TOMS on a podcast, “How I Built This,” then Googled the brand name.
- Receiving a referral from a friend, then Googled the brand name.
- Googling an interest topic, “ethical shoe brands” and seeing TOMS name in a blog post, then Googled the brand name.
Unfortunately, we can’t include Brand searches in our ROI calculation because we automatically rank at the top of Google for our own brand name.
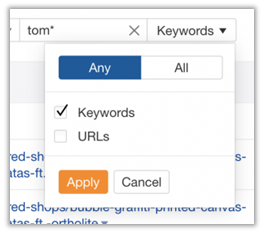
What we can include in the ROI calculation is purchases and leads from Non-Brand searches. That’s searches that don’t include the brand name, like “shoes”, “slip-on shoes”, and “vegan shoes”. Those are #1, #2, and #3 among the top 15 Non-Brand keywords that bring SEO traffic to toms.com:
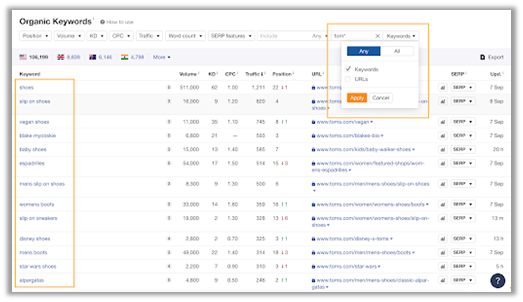
NB: The visual above shows how you can exclude Brand keywords in Ahrefs by using the brand and wildcards (tom*) in the Exclude Keywords filter above.
When visitors arrive at toms.com website because they Googled these Non-Branded terms, we can confidently say, this revenue can be attributed to SEO.
Here’s how to measure it.
How to Count Non-Brand SEO Conversion
1. Export 12 Months of Google Analytics Traffic Data From Organic Search
Acquisition > All Traffic > Channels > Organic
Make sure the Primary Dimension is set on Keywords. More than 97% of the keywords will be hidden under Google’s “(not provided)” and “(not set)” category.
But the remaining <3% will give you enough of a sample to report how many Non-Brand conversions the site gets from SEO.
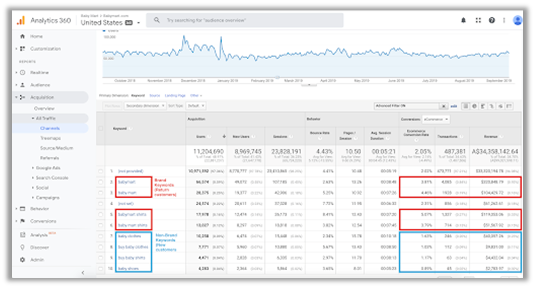
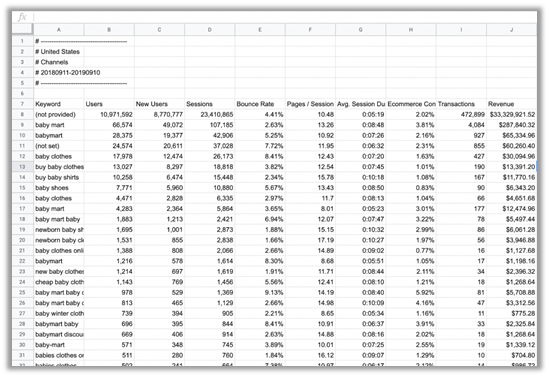
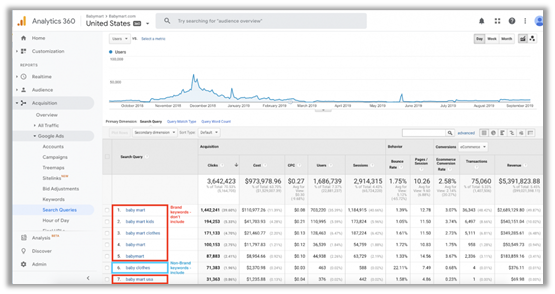
Note: The domain and brand here have been changed for privacy reasons.
The keywords in the red boxes are the Brand terms for this fictional brand, Babymart, and also includes combinations of Brand + intent keywords, like “babymart shirts.” Those are return visitors which we can’t attribute to SEO.
The keywords in the blue box – “baby clothes”, “buy baby clothes”, “buy baby shirt” are the Non-Brand keywords. We can attribute these to SEO.
The conversion rate for Brand keywords is much higher which is normal because visitors come to your website because they know your brand, and therefore are more likely to buy from you because they already trust you.
2. Export the Data to Google Sheets
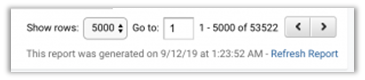
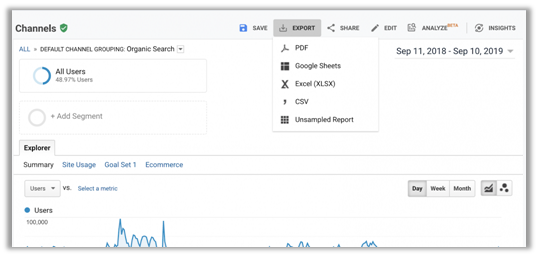
The maximum number of keywords we can export at a time is 5,000. For Babymart that means we need to manually export 11 pages of data to capture the maximum amount of data. At the bottom of the screen, change Show Rows to 5,000.
Then, choose Export > Google Sheets from the top of GA.
3. Compile All the Data Into One Worksheet
One by one, copy the 5,000 rows from each export into one sheet. In the end, you should have something that looks like this – 53k rows in the case of Babymart.
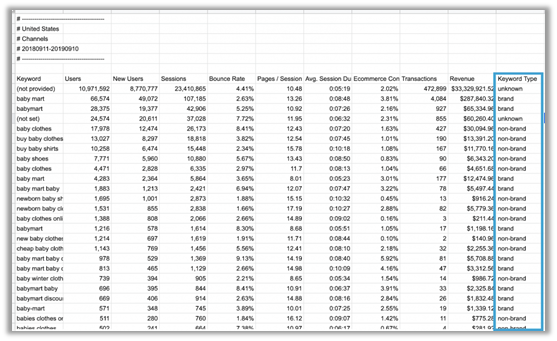
4. Classify Each Keyword as Either Brand or Non-Brand
In Column K, add a new field called Keyword Type. Here you can classify every keyword into either:
- Brand
- Non-Brand
- Unknown
The formula looks like this:
=if(REGEXMATCH(A8,(“(not provided)|(not set)”)),”unknown”,if(REGEXMATCH(A8,”(babymart|baby mart|baby-mart)”),”brand”,”non-brand”))
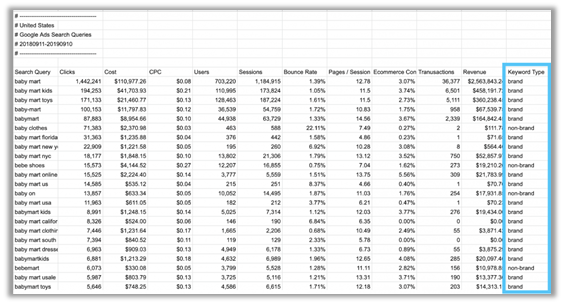
The new column is inside the blue rectangle below:
5. Run a Pivot Table to Aggregate Brand vs. Non-Brand vs. Unknown Conversions
In Google Sheets, run Data > Pivot Table and calculate by Rows. Add a Calculated Field dividing Transactions by Sessions and you’ll see that brand conversion rate is always higher.
Again, that’s because when someone searches for your Brand, they are much more likely to already know and trust you. That makes them more likely to convert.
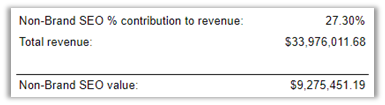
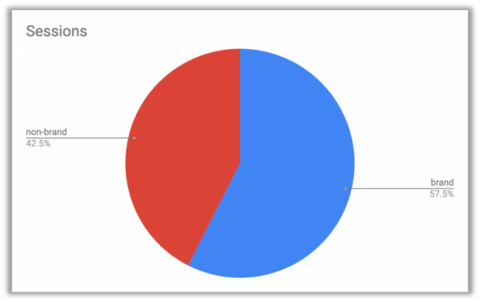
Now that we’ve split the revenue by Brand vs. Non-Brand, it’s easy to see how much real SEO value the site has. See the pie chart below which demonstrates this best:
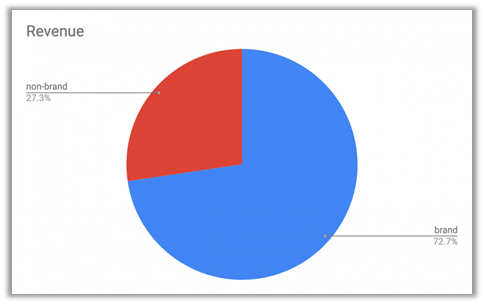
This sample size is large enough to extrapolate over the entire site. The true annual SEO value is $9.2 million.
Please note, this website is an outlier because it has more Non-Brand traffic than most of the sites we see. Typically, Non-Brand makes up 5-10% of revenue.
Method 2: Calculating the Amount Saved in Paid Clicks From SEO
Here is what we need to know:
- How much do we pay per click for Non-Brand SEM keywords?
- How many Non-Brand SEO clicks do we get per year?
Calculating Average Non-Brand SEM PPC
The reason we need to exclude Brand spend here is that we only want to calculate in Google Analytics: Acquisition > Google Ads > Search Queries.
To get the overall average CPC, divide Total ad spend / Total number of clicks.
Same as with Organic, we only want to use Non-Brand keywords. Those are the keywords we’re competing with other companies on, so they tend to be a higher CPC.
1. Use the Same Process From Organic Results to Export, Compile & Classify All the SEM Search Queries
The method is basically the same as the above. 5,000 keywords at a time, export them all to Google Sheets, and then classify them using that same formula as mentioned above.
For this website, it’s 400,000 keywords – that’s 80 pages (it IS worth it)! The blue rectangle below on the right has the formula that categorizes the keywords into Brand and Non-Brand.
2. Run a Pivot Table to Calculate the Average CPC for Non-Brand Keywords
In this case, and for most, Brand CPC is much less than Non-Brand. All due to competition.
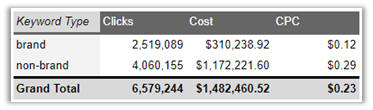
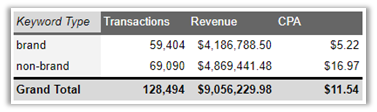
Another thing you can try is checking the Brand vs Non-Brand CPA. Normally CPA gets reported in a bundle – which includes the cost to acquire a buyer who has already purchased your brand. It’s better to separate the CPA from return buyers and new buyers.
Often, you’ll find the CPA is much higher for new customers. For Babymart the cost to acquire a new customer is 325% higher than for an existing one. Part of that is down to the lower CPC, the rest is due to brand loyalty.
3. Calculate the Amount of Non-Brand Traffic SEO Brings to the Site
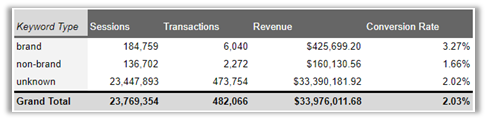
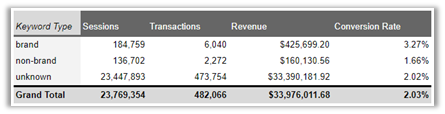
Earlier, we separated Brand vs Non-Brand revenue to the site using this table. Now we use the same table to work out how much Non-Brand traffic we bring to the site with SEO.
Hint: it’s 42.5% of 23.447 million, which is 9.9 million sessions.
4. Multiply Non-Brand Traffic x Non-Brand CPC
Last step, multiply 9.9 million sessions x $0.29 per click = $2.9 million.
This is just another way to measure the actual value of SEO. So far, we know it’s somewhere between $2.9 and $9.2 million annually.
There is a large margin of error, so we’ll go over the last method – the one we use. It requires building new pages at scale, which can mean a lot more work, but once that’s done this method calculates the value of SEO down to the penny.
Method 3: Counting Revenue from Landing Page Reports
This method uses landing page reports from Google Analytics. The key to this is to create landing pages that target a single Non-Brand keyword.
To track the pages we create more easily, we put them in one sub-folder (i.e., /buy or /products). The Traffic, Revenue, and Leads from any page with that URL path then gets attributed to SEO.
The argument makes sense, right?
- We built the page. No page, no conversion.
- The page ranks for keywords we never ranked for in the past.
- We know exactly how much investment went into writing the copy, creating the page, and building the backlinks.
As long as we track the cost of the production of the page, you can calculate the ROI of SEO from it, and be accurate in doing so. Here’s how to run a landing page report:
1. Make a Report for the Landing Pages Built by the SEO Team
In Google Analytics: Behaviour > Site Content > Landing Pages
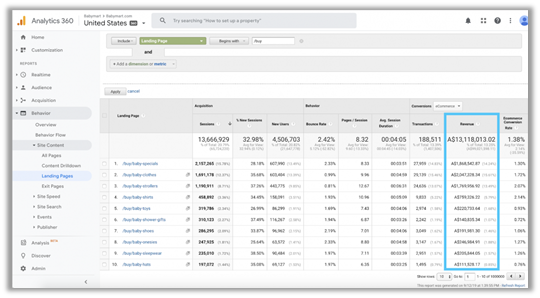
And that’s it. There are no other steps! This is literally the most accurate report you can create for SEO.
The first two methods tend to under-report the contribution of SEO to a website’s sales. By our other estimations, the revenue attributable to SEO is $2.9 million to $9.2 million. But it’s actually over $13 million, as you can see from the landing page report above.
How to Find Long-Tail Keywords to Target
If you’re looking to find what long-tail keywords to go for, the easiest way is to use Ahrefs. Run a site report on your website and look for keywords that have 3+ words and are a maximum of 500 to 1,000 searches per month. Here’s everything you need to set this up:
1. Position
From: 11. This means you’re currently ranking on Page 2 and below.

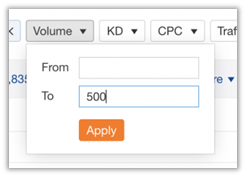
2. Volume
To: 500. This means the keywords listed will have a relatively low search volume, which makes them less competitive.
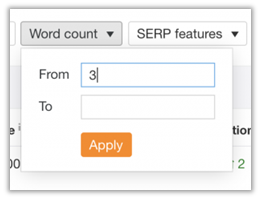
3. Word Count
From: 3. The minimum number of words should be three. The more words, the more specific the search intent.
4. Exclude
Keywords: your brand, like in the example, TOMS. Add all permutations of your brand, separated by commas.
If we were doing SEO for toms.com, the report would look like this:
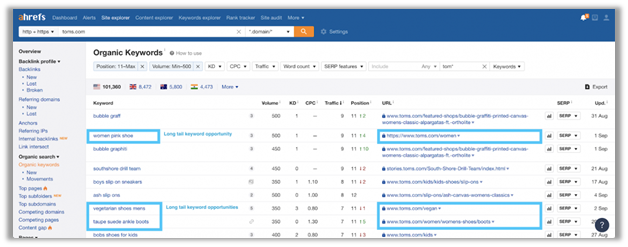
What you’re looking for here are Organic keywords that don’t exactly match the intent of the creation of the page. Some examples:
- The search ‘women pink shoe’ is being answered by https://www.toms.com/women, and ranks #12 on Google. We could build a new landing page at https://www.toms.com/women-pink-shoe link to it from /women, rank #1, and get more sales.
- The search “vegetarian shoes men” is being answered by https://www.toms.com/vegan and ranks #11 on Google. We could build a new landing page at https://www.toms.com/vegetarian-shoes-men link to it from /vegan, rank #1, and get more sales.
- The search ‘taupe suede ankle boots’ is being answered by https://www.toms.com/women/womens-shoes/boots and ranks #11 on Google. We could build a new landing page at https://www.toms.com/taupe-suede-ankle-boots link to it from /women/womens-shoes/boots, rank #1, and get more sales.
The methods we have taken you through are manual ways to measure and attribute ROI for SEO. They are all useful to a certain extent, and it’s definitely better than not having any data and insights whatsoever.
How to Scale SEO
Another industry-wide question that has been around for so long is, how can we scale SEO?
Historically, SEO lacks reliable automation tools for managing large-scale campaigns. Now, there is a solution.
Longtail UX has developed a patented AI-powered tech that can help you effortlessly create landing pages and perfectly match a buyer’s immediate need (their long-tail search query) to relevant products, in one click.
This gives users a positive experience, while giving you a predictable and measurable ROI. It’s disrupting the industry through a reimagination of platforming and the way things are done.
If you’d like to see how much revenue you could get from taking advantage of all the long-tail keywords for your website, try our complimentary scorecard here. It’s free and easy to do. Our team of experts will then provide you with key insights and your ROI opportunity.
For the latest insights, tips, and know-how, follow us at LinkedIn, Facebook, or Twitter.
Get your free scorecard assessment
to discover your SEO ROI opportunity
The opinions expressed in this article are the sponsor's own.