


Wish your website could rank higher on Google?
Is your website losing out on traffic because it takes too long to load?
Wondering how to speed up your site and show up at the top of SERPs, at the same time?
A fast website not only makes your users happier and more likely to convert, but can also help you rank better in Google.
In fact, Google recognizes website speed as a ranking factor, especially when it comes to how it factors into your website’s Core Web Vitals.
Does your site pass Google’s speed test? Check your site speed now →
Within Google’s Core Web Vitals, the speed of your website’s Largest Contentful Paint (LCP) is the most important site speed metric – it’s also the one most websites struggle with.
This article explains how to test your website speed and make your website load more quickly.
What Is The Largest Contentful Paint?
The Largest Contentful Paint (LCP) measures how quickly the main page content appears after opening a webpage.
The LCP milestone marks the time when a website visitor can see the main page content. The faster this happens, the happier your visitor (and Google) is.
Usually, the largest bit of content on a page is a text element or an image.
Below, you can see that this website’s LCP happens at 1.6 seconds after the webpage is opened.
-
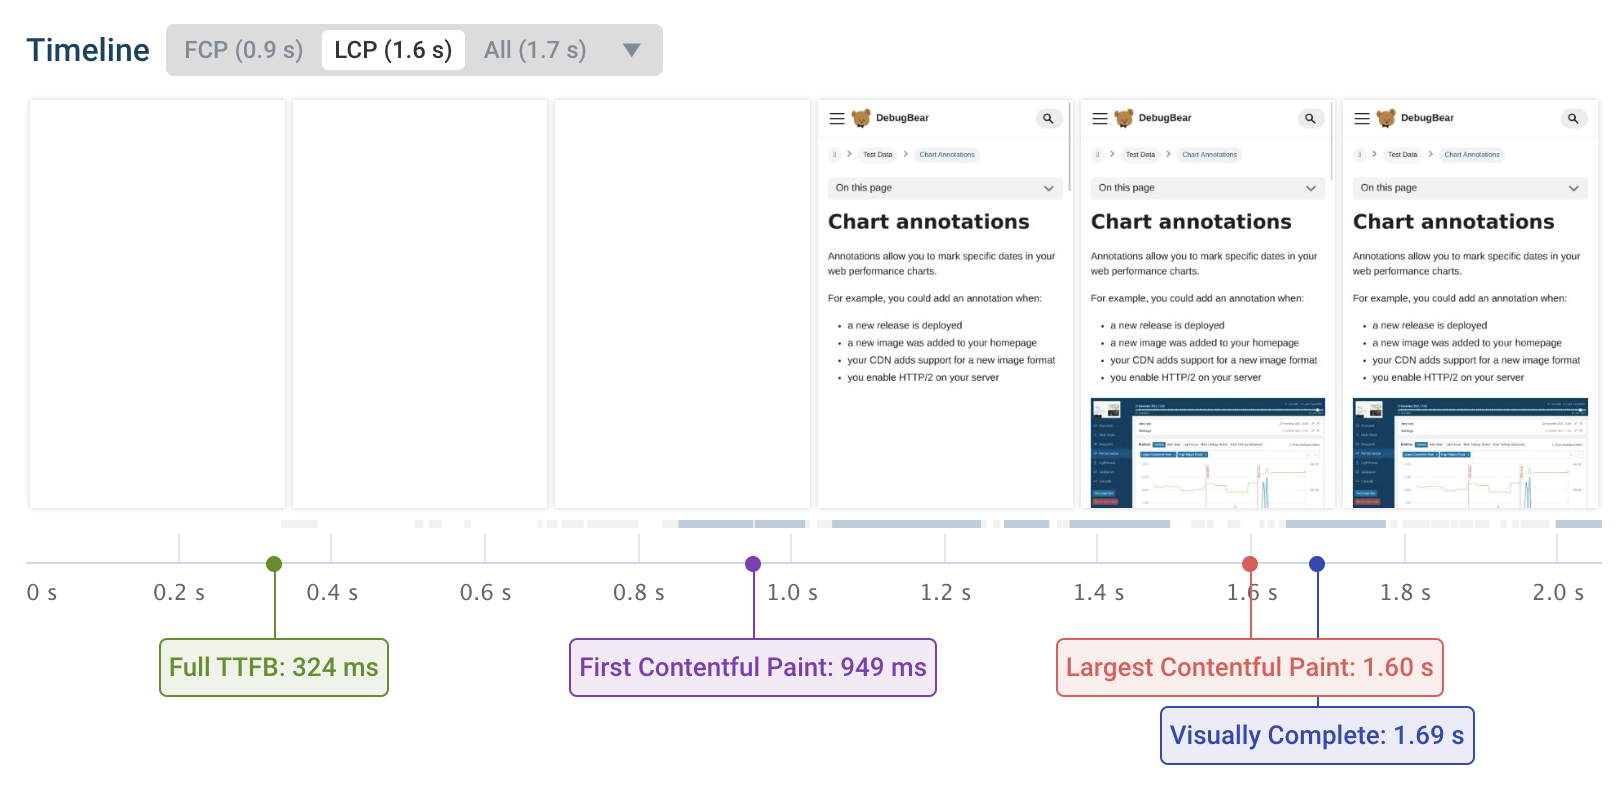
DebugBear Website Speed Test Rendering, November 2022
Immediately after the user navigates to the page, no content is visible.
After about one second, text and a small image start to appear as the First Contentful Paint occurs.
However, the large image on the page doesn’t render until 1.6 seconds after the start of the navigation. This rendering milestone is then recorded as the Largest Contentful Paint.
Why Does The Largest Contentful Paint Matter For SEO?
The Largest Contentful Paint is one of the three Core Web Vitals metrics that Google uses as a ranking factor.
If your website is slow to load that can cause it to rank lower in Google.
Google uses data from real Chrome users to decide whether your site meets the Core Web Vitals benchmarks. Some of this data is also published as part of the Chrome User Experience Report (CrUX).
Out of the three Core Web Vitals metrics, the LCP is the one that websites struggle with most. According to aggregate data, only 49.8% of mobile websites provide a good load time experience.
-
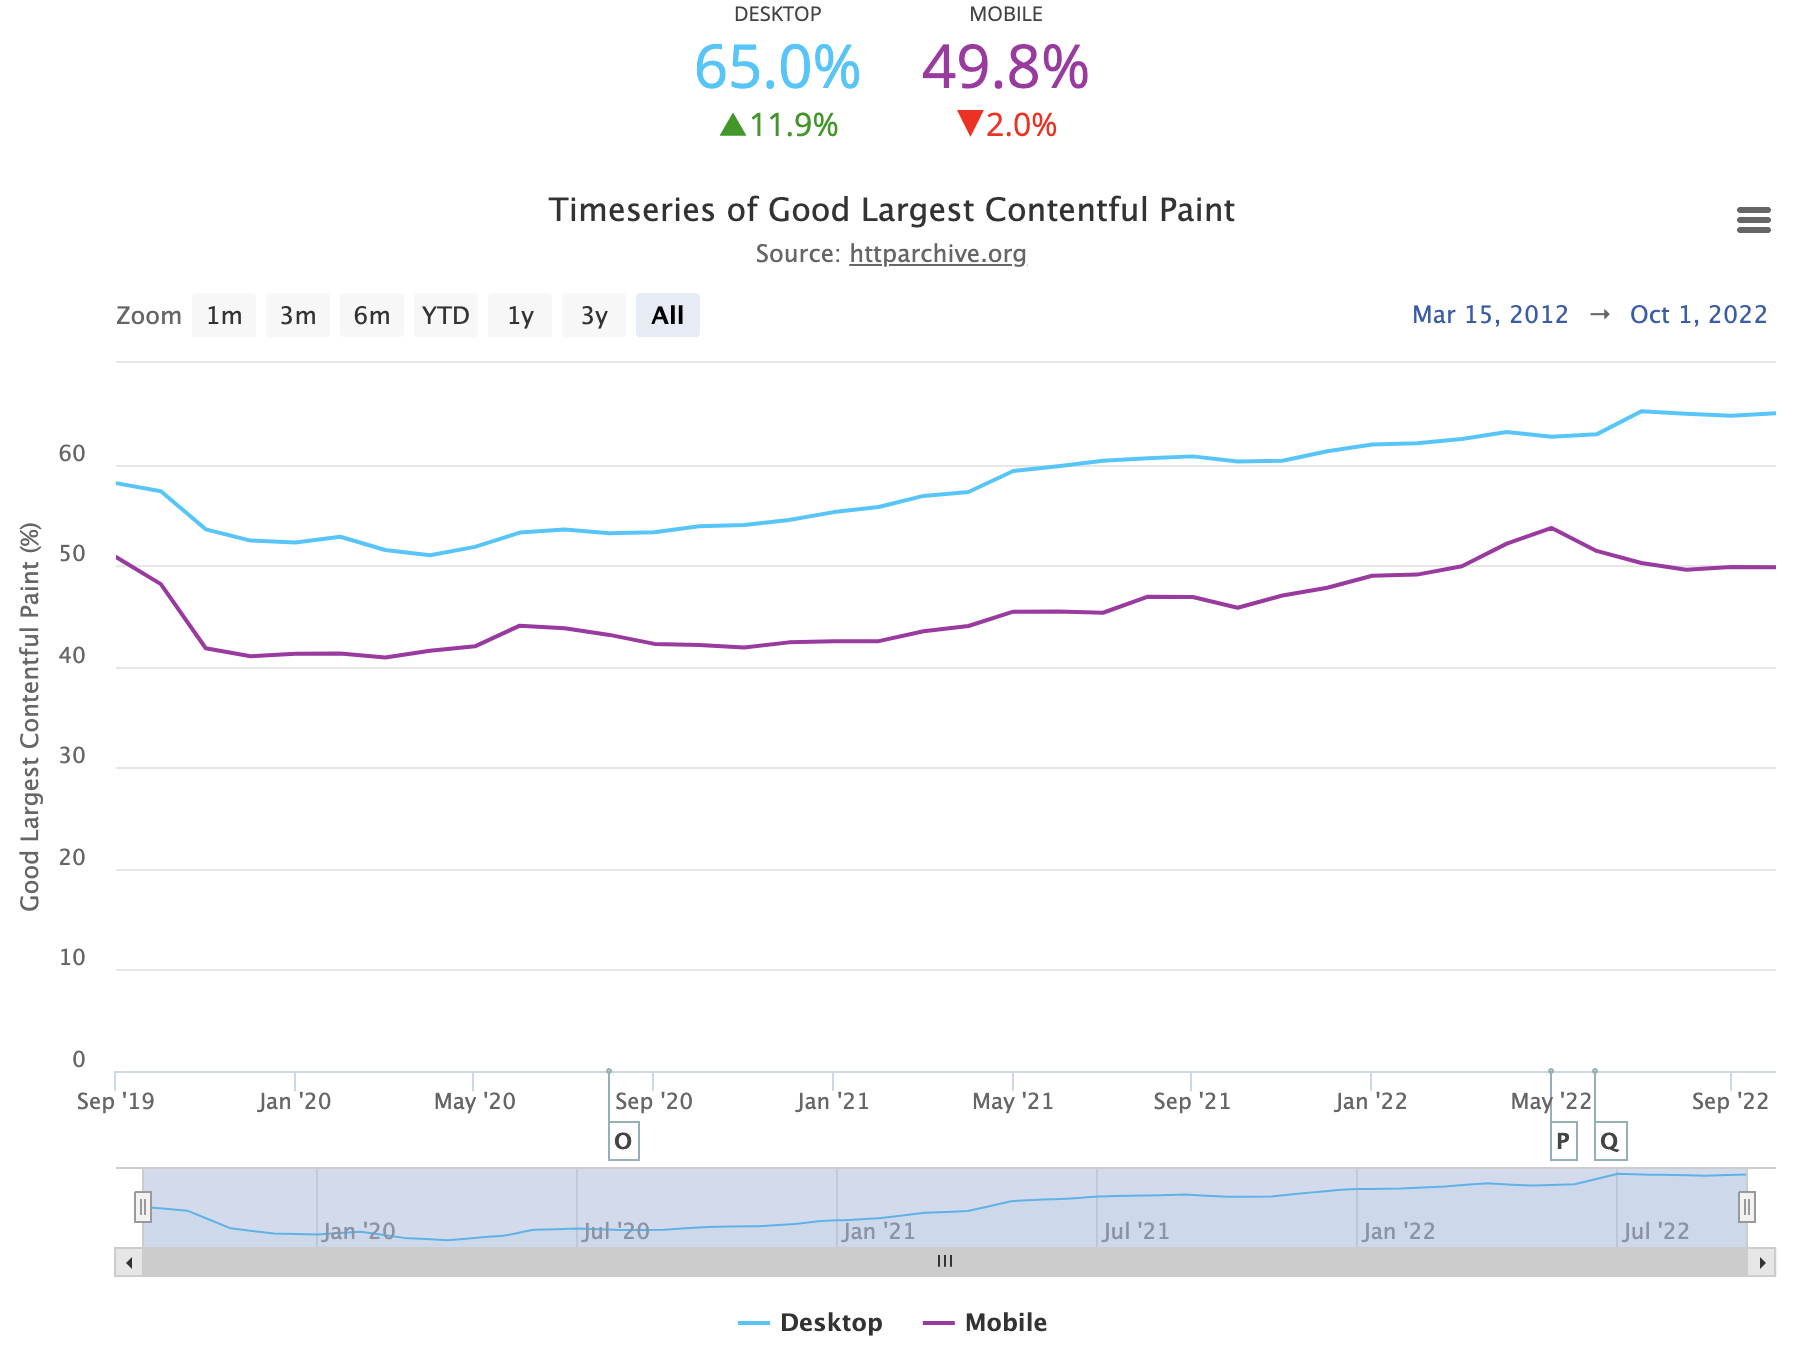
Screenshot from HTTPArchive.org, November 2022
What Is A Good Largest Contentful Paint Time?
A good Largest Contentful Paint time should be below 2.5 seconds. If a website meets this requirement it gets a “Good” rating.
If your LCP is over 4 seconds, this is rated as a “Bad” score, which has the largest negative impact on ratings.
Scores between 2.5 seconds and 4 seconds are rated as “Needs Improvement”.
Websites need to achieve a Largest Contenful Paint of 2.5 seconds or less to get a boost in Google rankings.
How To Measure The Largest Contentful Paint Of Your Website
Run a free website speed test to find out. Your LCP speed will be displayed immediately.
The results of your speed test will tell you if:
- The LCP threshold is met.
- You need to optimize any other Core Web Vital.
How Is The Largest Contentful Paint Calculated?
Google looks at the 75th percentile of experiences – that means 25% of real website visitors experience LCP load times of 3.09 seconds or higher, while for 75% of users the LCP is below 3.09 seconds.
In this example, the real-user LCP is shown as 3.09 seconds.
-
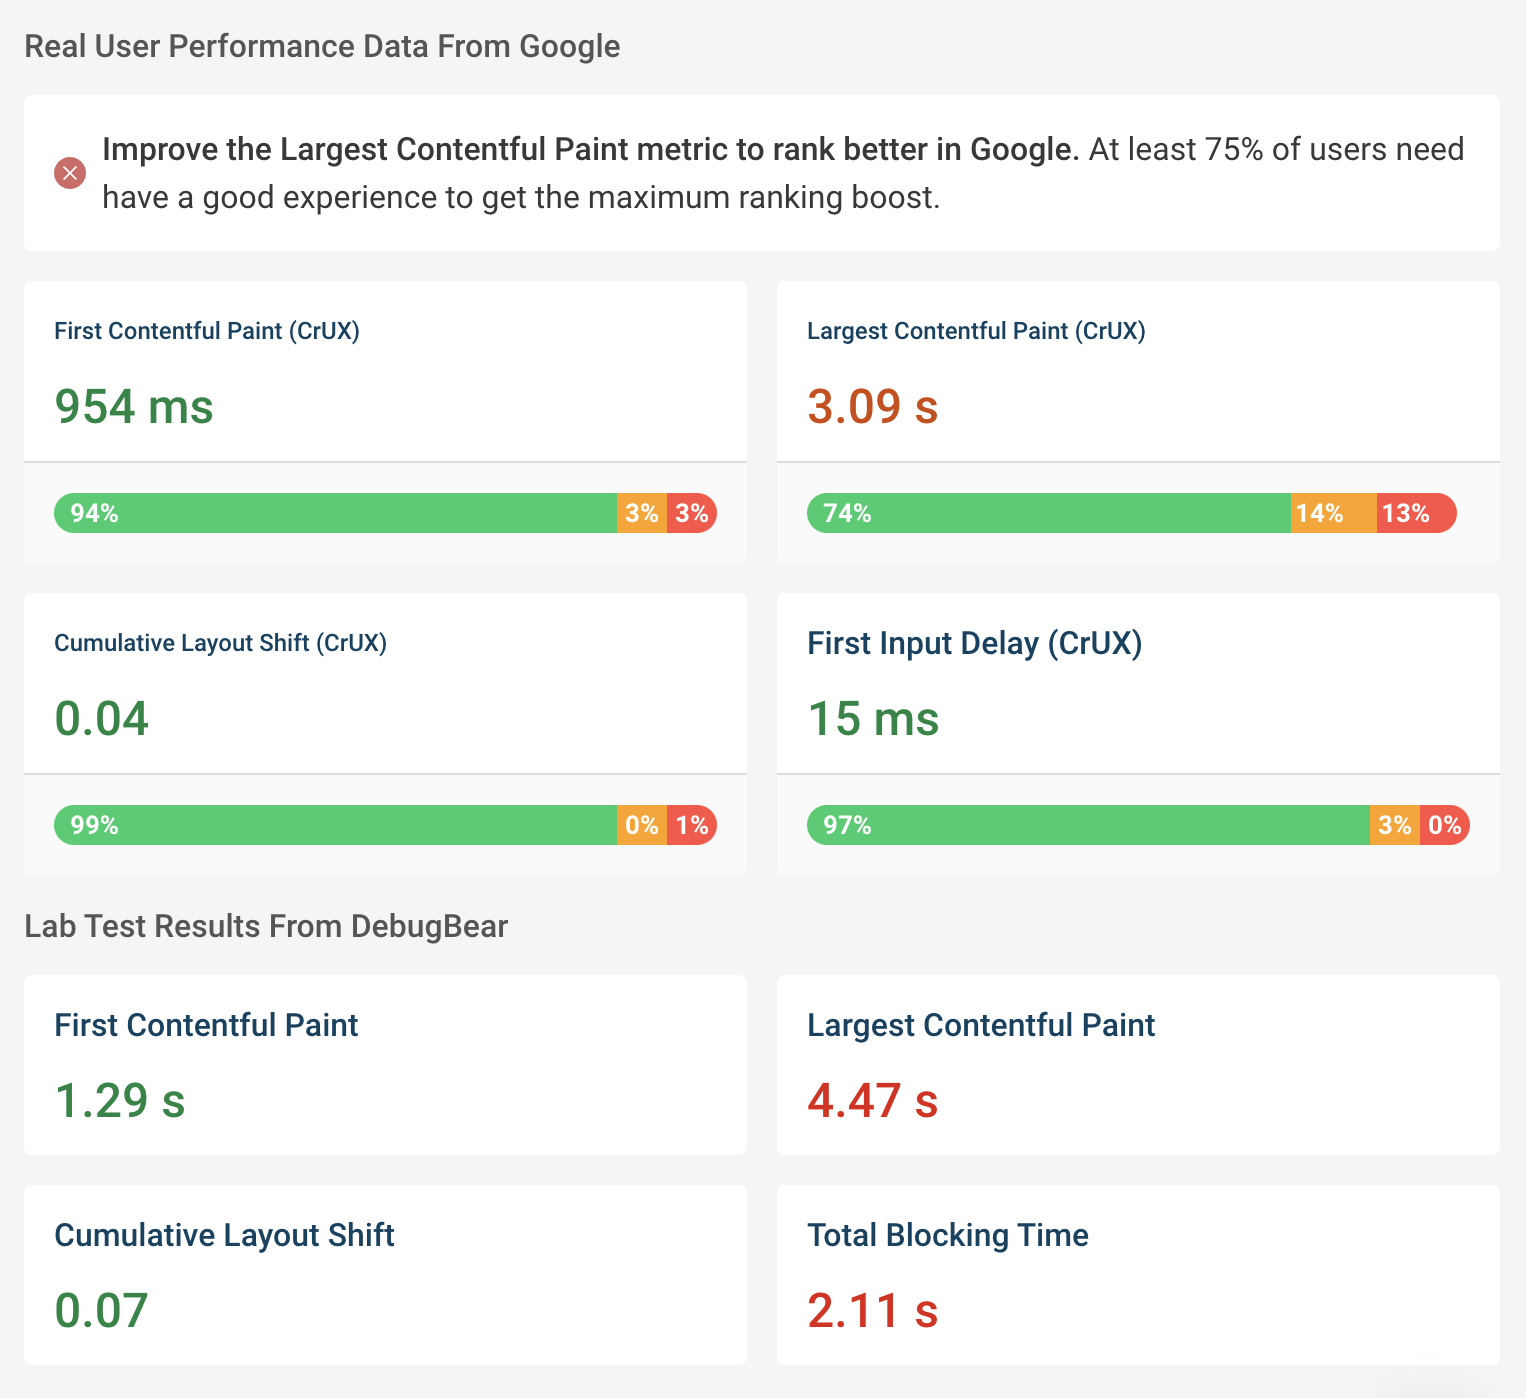
Screenshot of a Core Web Vitals data of DebugBear.com, November 2022
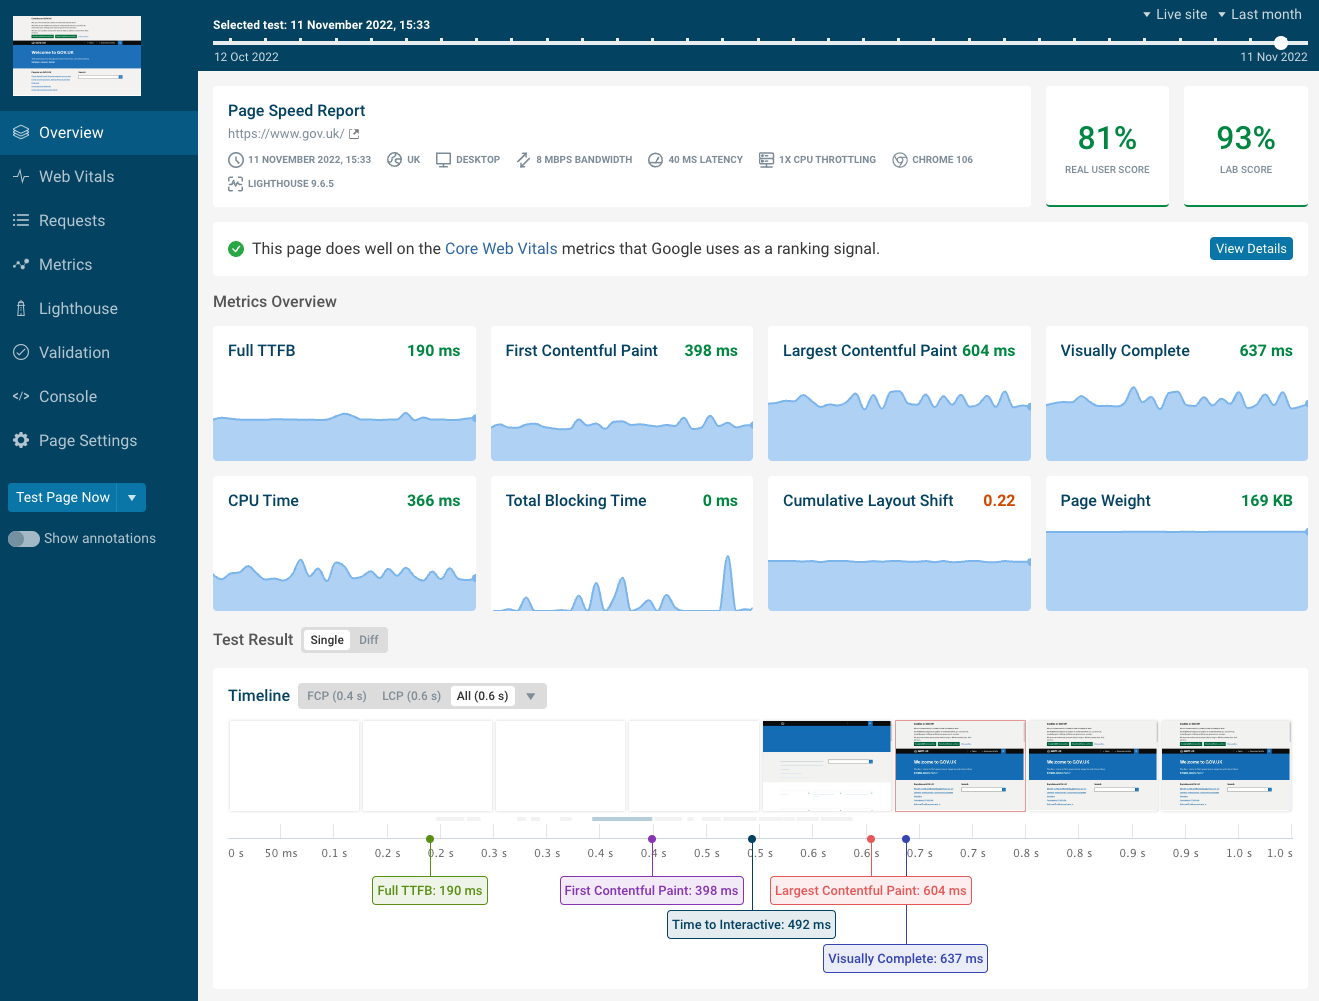
What Are The Lab Test Results On My Core Web Vitals Data?
With this specific web speed test, you’ll also see lab metrics that were collected in a controlled test environment. While these metrics don’t directly impact Google rankings, there are two advantages of this data:
- The metrics update as soon as you improve your website, while Google’s real-time data will take 28 days to fully update.
- You get detailed reports in addition to the metrics, which can help you optimize your website.
Additionally, PageSpeed Insights also provides lab data, but keep in mind that the data it reports can sometimes be misleading due to the simulated throttling it uses to emulate a slower network connection.
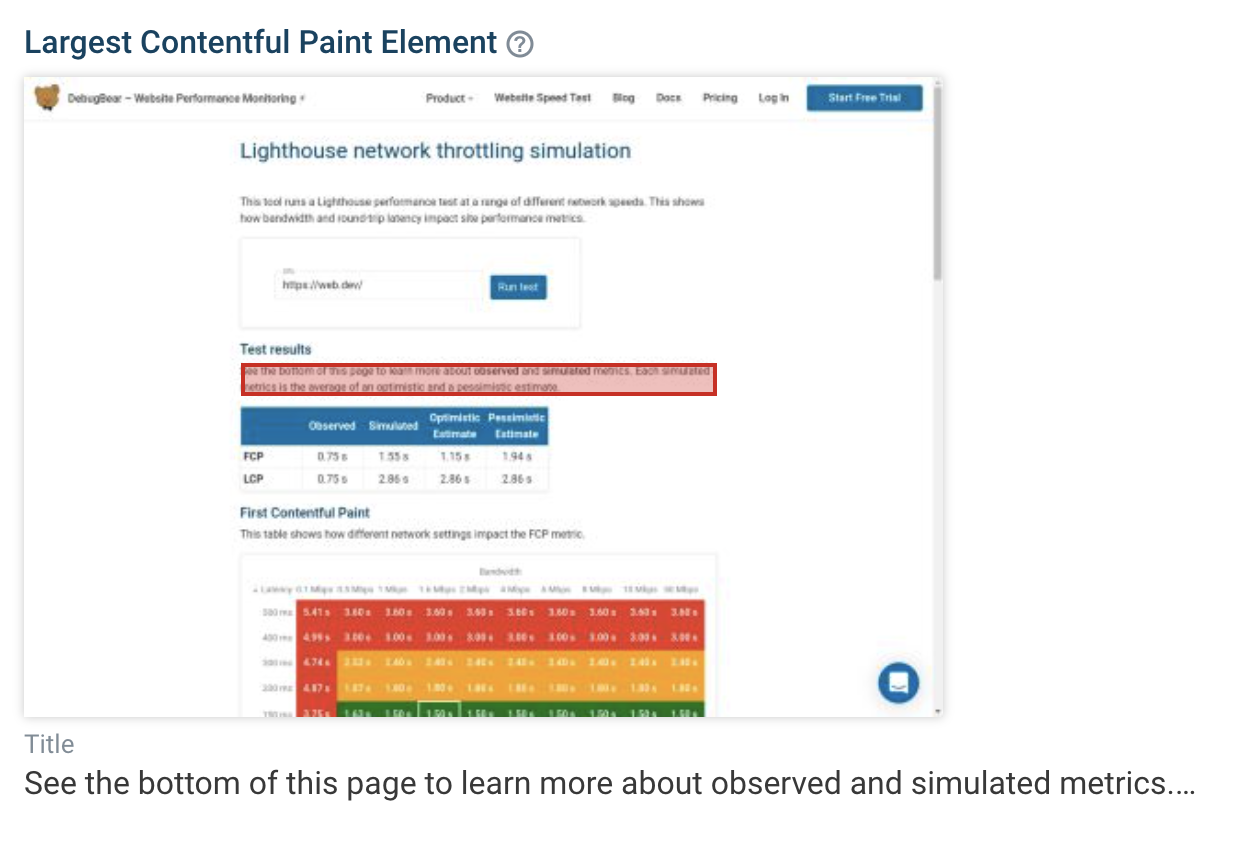
How Do You Find Your Largest Contentful Paint Element?
When you run a page speed test with DebugBear, the LCP element is highlighted in the test result.
Sometimes, the LCP element may be a large image, and other times, it could be a large portion of text.
Regardless of whether your LCP element is an image or a piece of text, the LCP content won’t appear until your page starts rendering.
For example, on the page below, a background image is responsible for the largest paint.
-
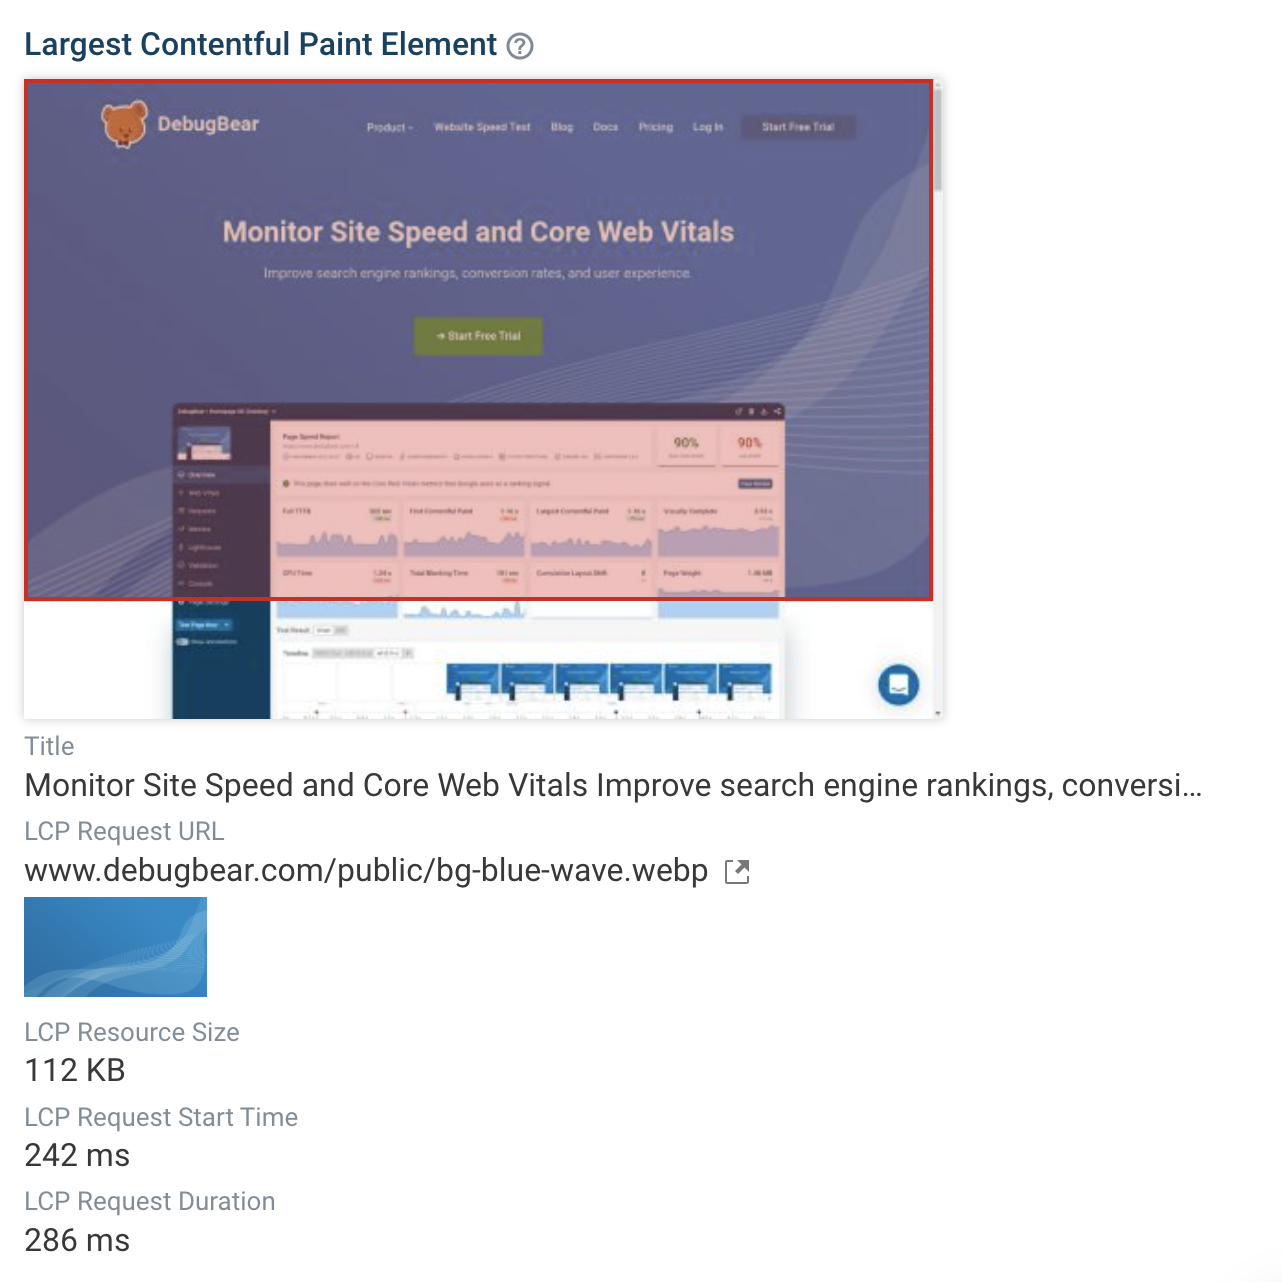
Screenshot of DebugBear.com, November 2022
In contrast, this page’s LCP is a paragraph of text.
-
Screenshot of DebugBear.com, November 2022
To improve the Largest Contentful Paint (LCP) of your website you need to ensure that the HTML element responsible for the LCP appears quickly.
How To Improve The Largest Contentful Paint
To improve the LCP you need to:
- Find out what resources are necessary to make the LCP element appear.
- See how you can load those resources faster (or not at all).
For example, if the LCP element is a photo, you could reduce the file size of the image.
After running a DebugBear speed test, you can click on each performance metric to view more information on how it could be optimized.
-
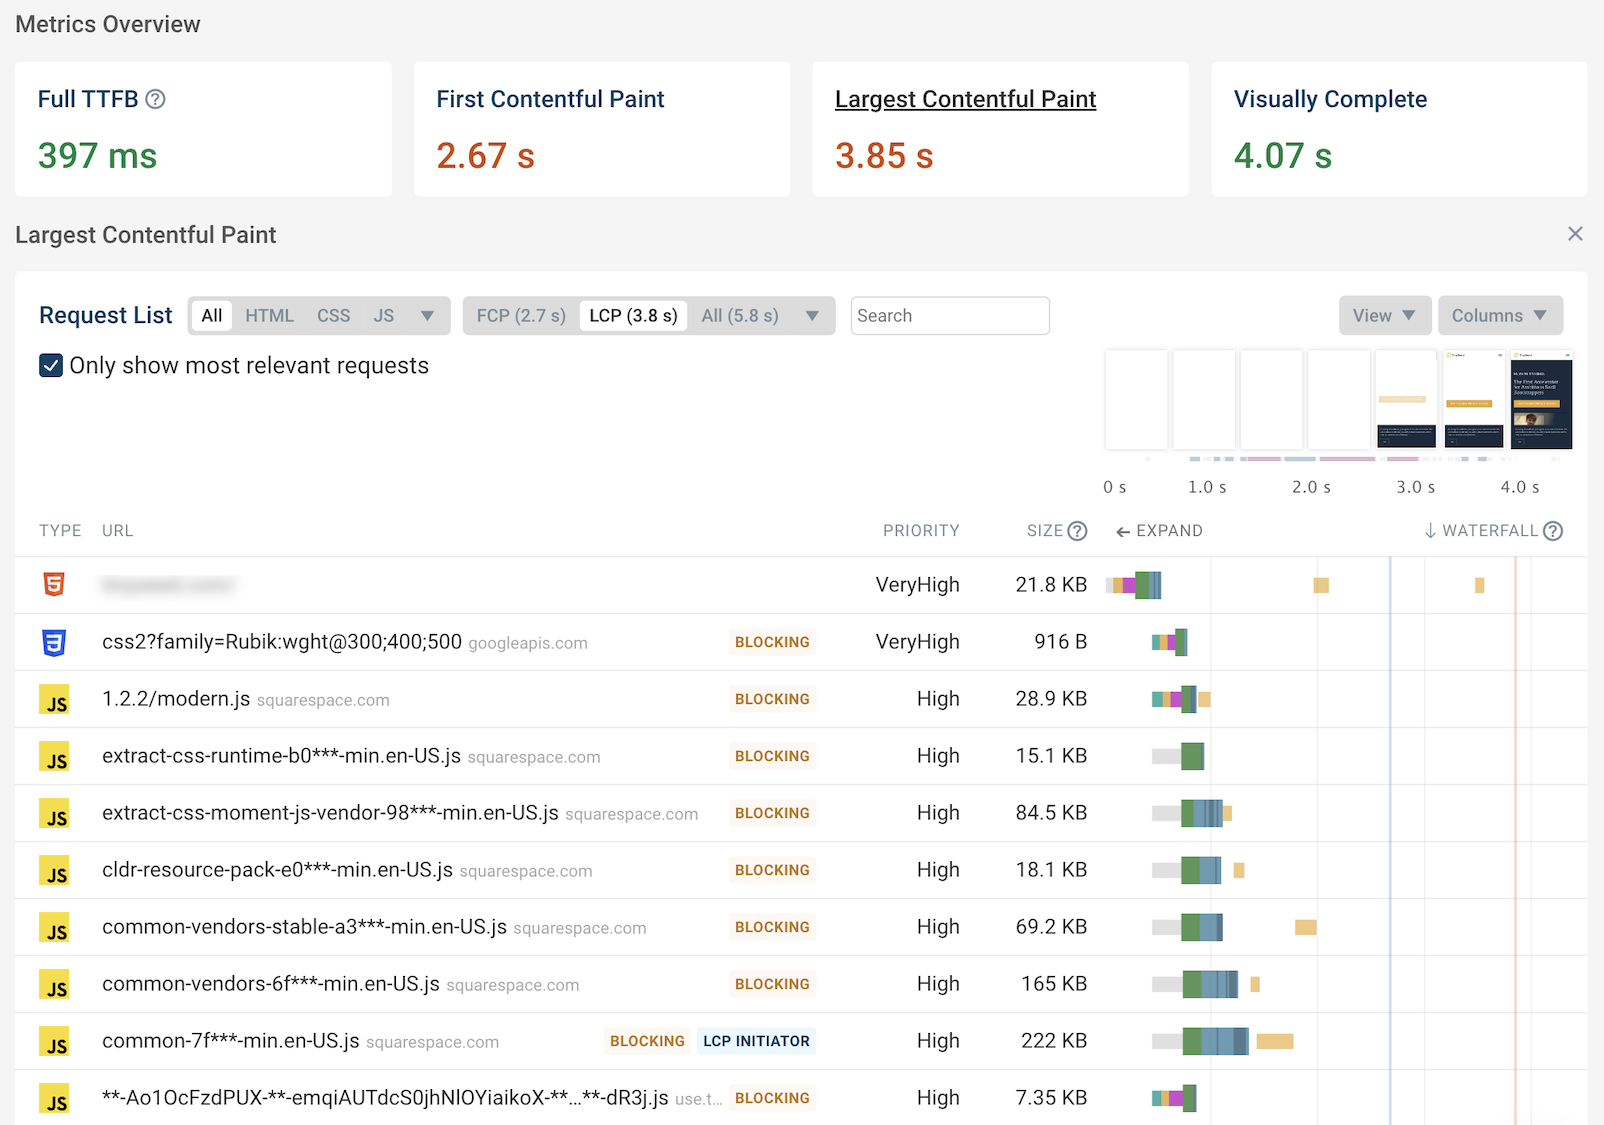
Screenshot of a detailed Largest Contentful Paint analysis in DebugBear.com, November 2022
Common resources that affect the LCP are:
- Render-blocking resources.
- Images that are not optimized.
- Outdated image formats.
- Fonts that are not optimized.
How To Reduce Render-Blocking Resources
Render-blocking resources are files that need to be downloaded before the browser can start drawing page content on the screen. CSS stylesheets are typically render-blocking, as are many script tags.
To reduce the performance impact of render-blocking resources you can:
- Identify what resources are render-blocking.
- Review if the resource is necessary.
- Review if the resource needs to block rendering.
- See if the resource can be loaded more quickly up, for example using compression.
The Easy Way: In the DebugBear request waterfall, requests for render-blocking resources are marked with a “Blocking” tag.
-
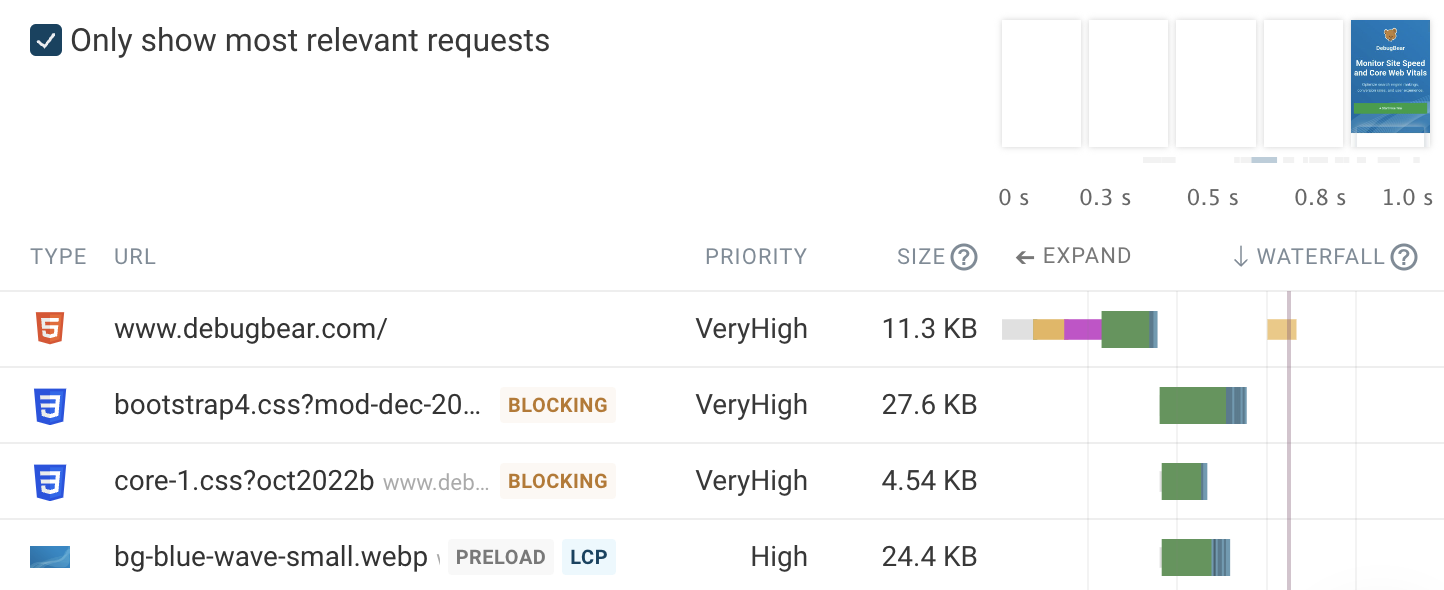
Screenshot of DebugBear.com, November 2022
How To Prioritize & Speed Up LCP Image Requests
For this section, we’re going to leverage the new “fetchpriority” attribute on images to help your visitor’s browsers quickly identify what image should load first.
Use this attribute on your LCP element.
Why?
When just looking at the HTML, browsers often can’t immediately tell what images are important. One image might end up being a large background image, while another one might be a small part of the website footer.
Accordingly, all images are initially considered low priority, until the page has been rendered and the browser knows where the image appears.
However, that can mean that the browser only starts downloading the LCP image fairly late.
The new Priority Hints web standard allows website owners to provide more information to help browsers prioritize images and other resources.
In the example below, we can see that the browser spends a lot of time waiting, as indicated by the gray bar.
-
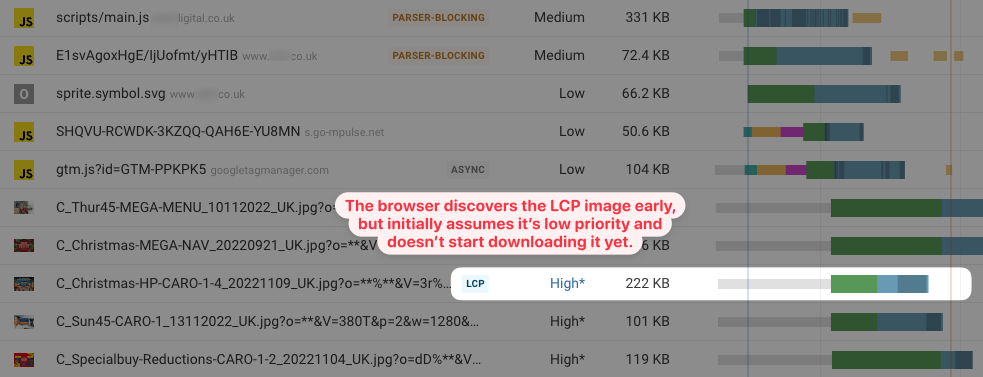
Screenshot of a low-priority LCP image on DebugBear.com, November 2022
We would choose this LCP image to add the “fetchpriority” attribute to.
How To Add The “FetchPriority” Attribute To Images
Simply adding the fetchpriority=”high” attribute to an HTML img tag will the browser will prioritize downloading that image as quickly as possible.
<img src="photo.jpg" fetchpriority="high" />
How To Use Modern Image Formats & Size Images Appropriately
High-resolution images can often have a large file size, which means they take a long time to download.
In the speed test result below you can see that by looking at the dark blue shaded areas. Each line indicates a chunk of the image arriving in the browser.
-
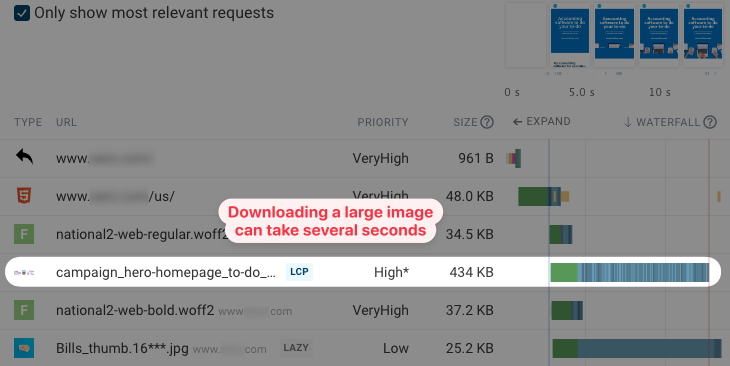
Screenshot of a large LCP image on DebugBear.com, November 2022
There are two approaches to reducing image sizes:
- Ensure the image resolution is as low as possible. Consider serving images at different resolutions depending on the size of the user’s device.
- Use a modern image format like WebP, which can store images of the same quality at a lower file size.
How To Optimize Font Loading Times
If the LCP element is an HTML heading or paragraph, then it’s important to load the font for this chunk of text quickly.
One way to achieve this would be to use preload tags that can tell the browser to load the fonts early.
The font-display: swap CSS rule can also ensure sped-up rendering, as the browser will immediately render the text with a default font before switching to the web font later on.
-
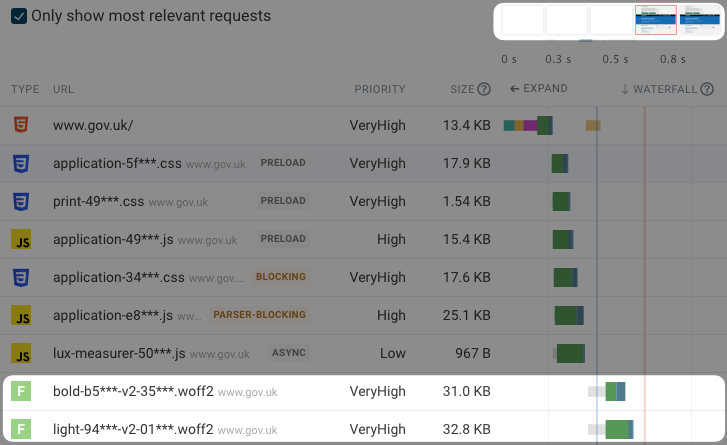
Screenshot of web fonts delaying the LCP on DebugBear.com, November 2022
Monitor Your Website To Keep The LCP Fast
Continuously monitoring your website not only lets you verify that your LCP optimizations are working, but also makes sure you get alerted if your LCP gets worse.
DebugBear can monitor the Core Web Vitals and other site speed metrics over time. In addition to running in-depth lab-based tests, the product also keeps track of the real-user metrics from Google.
Try DebugBear with a free 14-day trial.
-
Screenshot of site speed monitoring data on DebugBear.com, November 2022
The opinions expressed in this article are the sponsor's own.