


Are you ready for Google’s upcoming Page Experience algorithm update?
We’ve already seen multiple announcements and support articles from Google about the update.
So what should you do?
First, make sure you know what the three Core Web Vitals are and why they’re important.
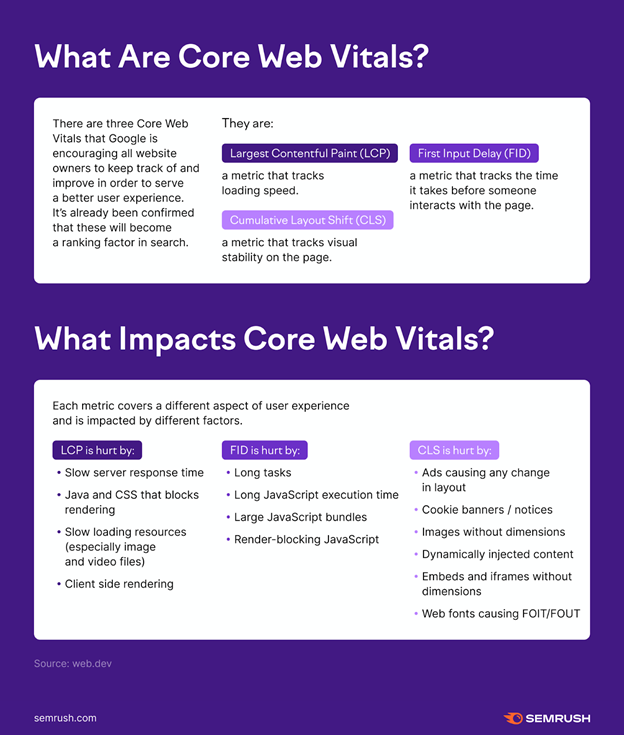
Google sums it up like this:
- LCP – loading
- FID – interactivity
- CLS – visual stability
You’ll need to figure out how to serve a better page experience (especially on mobile!) by speeding up load times and limiting anything that destabilizes the visual experience.
Pop-up ads, cookie banners, or dynamic elements may seem super functional to us marketers at first, but Google’s made it clear that if certain elements sacrifice your site’s usability – it could lead to a drop in rankings.
When asked about the importance of these metrics, Marie Haynes, owner of Marie Haynes Consulting, put it simply:
“It’s not often Google tells us when something is a ranking factor. We don’t know how big of a factor CWV’s will be, but fixing these issues will likely have other benefits as well. A website that is better for searchers to use is good for many reasons.”
Once you are clear on the basics of Core Web Vitals, the next steps are to:
- Measure Core Web Vitals of your important pages.
- Interpret those metrics – understand what’s happening and what’s a priority.
- Communicate what actions need to be taken from a development standpoint.
Measuring Core Web Vitals
Measuring the vitals themselves can be easy.
Online tools like PageSpeed Insights, Lighthouse, and Semrush can do a quick check for you.
To measure your homepage’s Core Web Vitals on Semrush, just set up a Site Audit and check the Core Web Vitals thematic report.
This tool will automatically check core web vitals for 10 of your site’s pages during each crawl. Semrush will pick the 10 pages closest to the start of its crawl path, which generally begins at the homepage and follows hyperlinks.
However, this can be controlled by uploading a file with URLs listed in the Site Audit setup step. In your file, we will check Core Web Vitals for the first 10 rows.
In a few weeks, there will be the ability to specifically choose those 10 URLs in each crawl.
This addition to the Site Audit tool makes it easy to bake-in a core web vital analysis into any website project or campaign you’re working on.
Interpreting Your Vitals
Now that you know if your page is either good, poor, or in need of improvement, how do you move forward?
Ultimately you’ll need to make some adjustments on the development side of your site.
But first, it will help you to be able to dive in yourself and understand exactly what item is hurting your page experience.
Keep in mind that Google has specific thresholds for what it considers good or poor for each vital. These can be your targets when assessing the development change.
If you’ve done enough on the development side to go from the “needs improvement” or “poor” value to a “good” value then you know you’re on the right track.
While these three metrics are all pretty related in terms of user experience (having poor loading and layout shift can lead to a worse first input delay), there are different factors that can impact each one.
However, showing this list of factors to your dev team might not be clear enough instruction to communicate the level of priority you want to communicate.
If you can do a little bit of a deep dive on your own, your development team will appreciate it and likely be much quicker to jump in and make a fix exactly where it’s needed.
Let’s look at how you can use Lighthouse to find the exact issues you may be dealing with.
Looking at Core Web Vitals in Lighthouse
To open Lighthouse, right-click anywhere on the webpage and select Inspect.
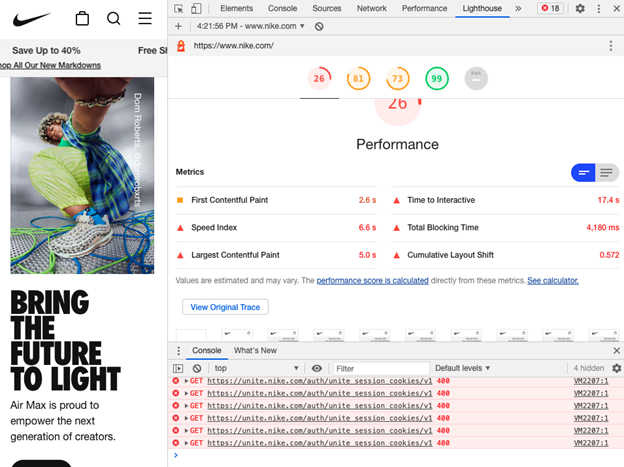
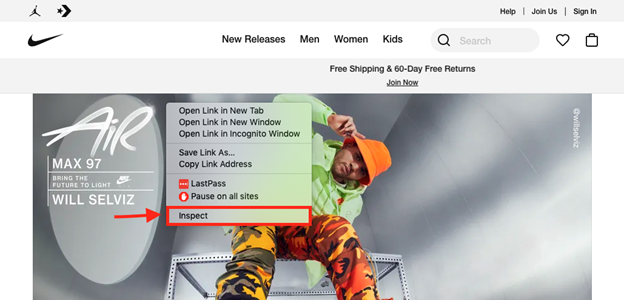 Nike.com
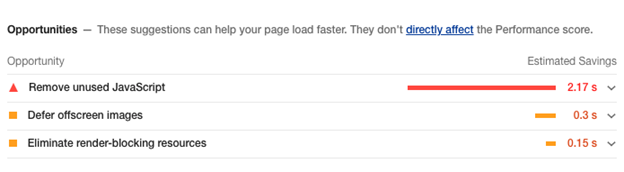
Go to the Lighthouse report and look for the Opportunities it lists. These tell you where you could optimize the speed of the page via development.
Inspecting LCP
Scroll down to find where it says View Original Trace. This will take you to the timeline, where you can find when the Core Web Vitals were logged.
In the screenshot below, you can see FP (first paint), FCP (first contentful paint), and LCP listed in the timings.
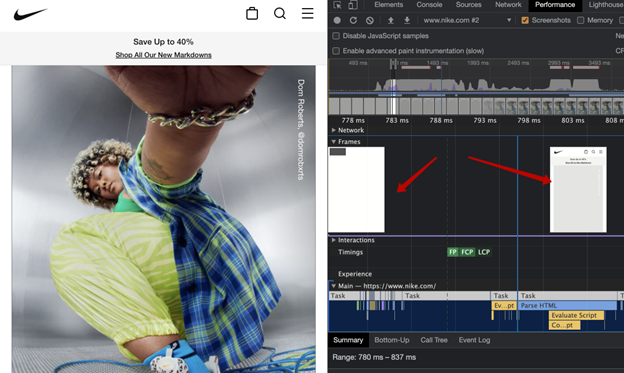
Once in the timeline, you can zoom in to see the screenshot. This helps you understand what element Lighthouse marks as the largest.
In this case, it’s a placeholder for a big image. This placeholder is good practice for optimizing LCP.
Below is one more example of looking into LCP. Notice the gap of how long it took for this image to load – resulting in a poor LCP metric.
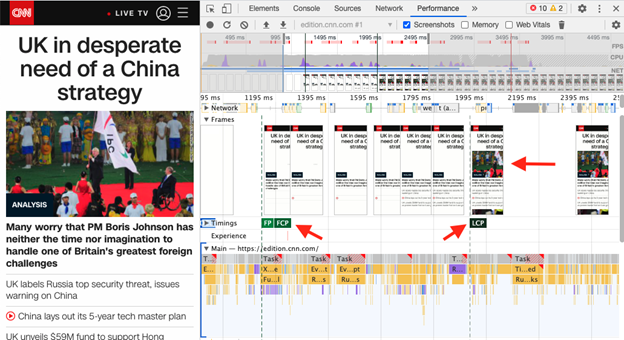 Edition.cnn.com
Again, Lighthouse will show its recommended opportunities and diagnostics about website performance so you can find ways to improve the LCP
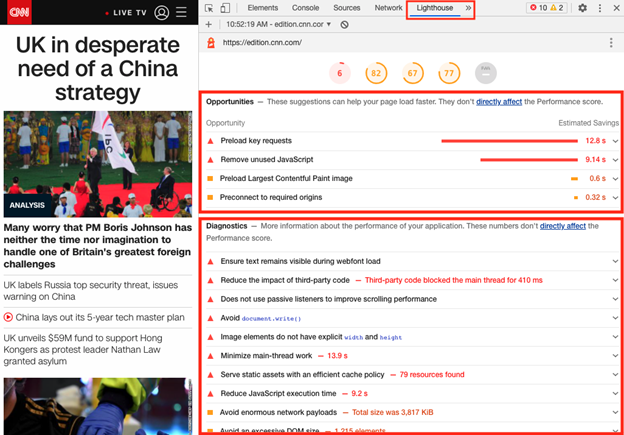
This is a good place to save a screenshot for your developer and share the recommendations.
Performance Insights from Semrush
Another place to get ideas is from Semrush.
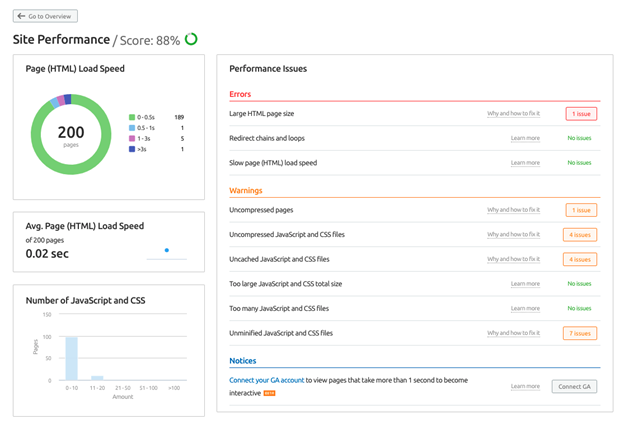
From the Site Audit tool, the Site Performance report will offer insight on fixing any speed-related issues that were seen in the crawl.
For each issue, you can see exactly where it occurred and receive ideas on how you can improve your LCP metrics.
Here you’ll see a report on any issues involving JavaScript, slow page load speeds, and HTML that could be optimized.
If you aren’t as tech-savvy as your dev team, it could be difficult to decide what to fix first.
A good way to go is to collect as much specific info as you can and give it to your developers so they can offer a solution from their point of view.
Inspecting FID/TBT
Next, it’s time to look into first input delay – how long it takes before a user interacts with the page.
According to Google’s web.dev article, “Long first input delays typically occur between First Contentful Paint (FCP) and Time to Interactive (TTI).”
In order to measure this via simulation, tools like Semrush and Lighthouse use Total Blocking Time (TBT), a metric recommended by Google as a substitution to FID.
TBT measures the total amount of time between First Contentful Paint (FCP) and Time to Interactive (TTI) and correlates with FID, capturing issues that affect interactivity and can be obtained in laboratory conditions.
To inspect, we can look at an example of a slow-loading image using the Performance tab in the Dev console. You can click View Original Trace in the Lighthouse report.
Then, switch on the Web Vitals setting to see when Long Tasks take more than 50ms.
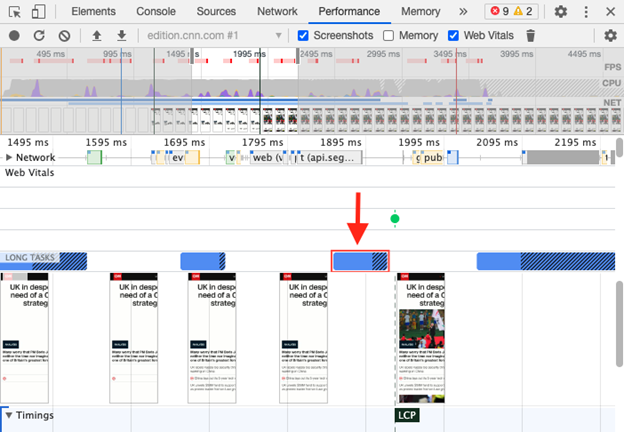
These are the instances where FID could be worked on.
Some of Lighthouse’s recommendations that could help with FID include:
- Avoid long tasks.
- Minimize main thread work.
- Keep request counts low and transfer sizes small.
It could help to see what JavaScript scripts may have caused long tasks for your page.
Inspecting CLS
Cumulative Layout Shift is the metric that basically tells you how much the page jumps and shifts around as the result of issues with images, fonts, and dynamic items such as pop-ups.
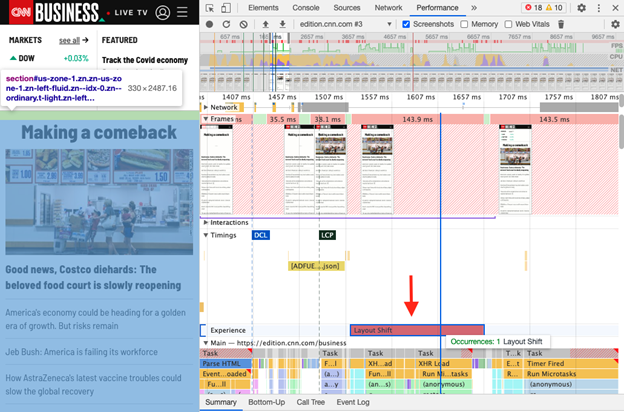
To find out what part of a page made shifts:
- Go to the Performance tab (click on click View Original Trace in Lighthouse report).
- See the Experience track to find when happened shifts.
- Zoom in and look for Layout shifts to see what part of the page made these shifts during loading.
Some recommendations in Lighthouse that can help deal with layout shifts are to:
- Fix images without dimensions.
- Avoid non-composited animations.
- Ensure text remains visible during webfont load.
Conclusion
While no one can know just how much of an impact Core Web Vitals will have on Google rankings, it’s always better to be prepared and aware of where your webpages can be made faster and provide a better experience.
That’s why we recommend using both Semrush’s Site Audit and Lighthouse to get all of the information you need to provide your dev team with clear instructions to improve these vitals.
Don’t forget that Google itself did emphasize how “great, relevant content” should still be your main priority – with page experience as an added factor in addition to that initial goal.
The fastest way to check
your Core Web Vitals
The opinions expressed in this article are the sponsor's own.