


The work of a search engine optimization (SEO) consultant revolves around one central theme:
Data.
Especially keyword data.
We collect it from a variety of third- and second-party sources, perhaps even via self-made tracking tools, to then start crunching the numbers and eventually delivering valuable insights to our bosses, clients, or prospects.
However, only running a few tools and employing some analytical magic is not going to cut it.
We also need to be thoughtful about how we interpret data from keyword tools and deal with any inaccuracies or inconsistencies.
Just like any software program, each keyword tool has a characteristic mechanism in place for collecting, aggregating, and manipulating data.
Similarly, tools’ workings affect how they handle queries and present the output keyword research data.
An essential part of a marketer’s job function is to validate whether the data values stored for these keywords are represented in a consistent and unambiguous form.
Meaning, is the keyword data I am working with accurate?
The simple answer:
No.
Comparing data values of different tool providers for a set of keywords already proves to contain large inconsistencies – not only in data values but also in if and how your output data is presented.
This study, by my company, OAK, attempts to find clarity by exploring data accuracy and reliability with respect to second- and third-party keyword tool data.
Specifically, this study examines the following topics:
- Data collection: How do keyword tools collect their data?
- Data handling: How do keyword tools manipulate data?
- Data validation: Validating keyword data values.
- Role as an SEO Consultant.
The primary purpose of this study is to grow awareness about the complexity surrounding keyword data values and tool providers’ data collecting and processing mechanisms.
Google Search Console
Let us begin at the beginning: Google Search Console.
It is a second-party tool from Google that collects behavioral data for a single domain or entity and, after manipulation, injects the data into the front-end interface.
The mere fact that Google collects and processes the data might you wonder: how close to reality are the data values of the projected data?
This question poses an immediate challenge: Search Console data is not 100% validatable.
Luckily, Google is, to a point, transparent and provides various explanations for why your data values do not reflect reality or add up as you could expect.
A few of them are:
- To protect the privacy of the user. The click is sometimes not credited to the search term. Search Console, however, does register the click, causing discrepancies between the table and diagram data.
- The same can apply to branded queries.
- Clicks could come from bots.
- In some cases, selecting certain filter combinations can also lead to differences between the diagram and table data.
Unfortunately, only the G-giant has access to the exact data values, which means verifying the accuracy of Search Console data is a troublesome process.
The reliability of keyword data increases, however, with third-party tools.
These are tools like SEMrush, Ahrefs, Keywordtool.io, Searchvolume.io, and many others.
To find answers, this study explores the mechanics of these keyword tools apply.
Unfortunately, the companies running these tools disclose little to no information about how they collect, aggregate, or manipulate their data.
It seems fair.
A chef doesn’t just give away her or his world-famous recipe. Hence we attempt to generate insights with the help of the following approaches:
- Using and comparing the tools.
- Inquiring at the customer service departments.
- Reading the FAQ sections and utility pages.
1. Data Collection: How Do Keyword Tools Collect Their Data?
In general, there are five kinds of resources through which keyword tools accumulate their data:
Google Ads API / Keyword Planner
Keyword data is gathered directly from Google’s keyword database through the Google Ads API.
As is the case with Search Console, Google Ads first manipulates the data before injecting it into the database.
Clickstream Data by Aggregators & Data Brokers
Clickstream is nothing more than data derived from consumers’ online surfing behavior.
Aggregators gather this data in a variety of ways.
Large, until recently active aggregators, were, for example, Jumpshot or Hitwise.
Wherefrom do they get their data?
- Browser extensions and plugins
- A homemade plugin or extension of the aggregator itself.
- They pay external third party browser plugins to share consumer data
- They pay internet service providers for access to the data in an “anonymized” data feed.
The aggregators then sell the data to keyword tools such as Ahrefs, SEMrush, and Moz, among others.
Browser Extension & Plugins
Keyword tools can also directly acquire consumer data from external third party browser plugins.
Numerous browser extensions have been developed to help marketers.
Despite the nifty functionalities, these plugins and browser tools often pursue shady practices.
Providing consent before using an extension is common, but we usually have limited knowledge about the practices to which we give consent.
By consenting, you can permit these tools to:
- Collect your online surfing behavior.
- Retrieve client data from Google Analytics, Search Console, or other tracking software.
And most worrisome:
- Share the data with third parties such as aggregators or keyword tools.
These browser extensions might have access to any potentially sensitive data and are ordinarily not compliant with your customer or business’s GDPR.
Exercising care when working with extensions is necessary to guarantee data security.
Some keyword tools have also developed their own browser plugin or extension.
Moz, for instance, introduced MozBar, an all-in-one extension with all kinds of useful features.
Browser plugins developed by the established keyword tools presumably wouldn’t pursue any malicious practices, but they can collect online behavior and use it to attune their data values.
External Tools
Keyword tools additionally retrieve data via APIs from external parties that collect online surfing behavior data, such as GrepWords in the past.
Keywordtool.io, for instance, obtains data from Keyword Planner but also other third sources. They disclose some advice, albeit rather general:
“Keyword Tool provides an external API that gives you the keyword suggestions that you would never be able to find in Google Ads. Keyword Tool uses autocomplete data while Google Ads hides valuable keywords that could be found using autocomplete.”
Own Tools
Some keyword tools instead have their own programs or software set up to accumulate keyword data.
These five methods of collecting and examples only unveil the tip of the iceberg.
There exists a vast web of companies and tools within this world of collecting, exchanging and selling keyword data.
At least a bit better understanding of the picture will undoubtedly help us to realize that keyword data displayed on our SEO tools, Google Sheets and dashboards are barely more than a product of an ambiguous construct.
To Sum Up
Keyword tools collect data from five different types of sources.
It’s common to use multiple data sources from different data source types.
2. Data Handling: How Do Keyword Tools Manipulate Data?
The next step in adopting a more critical stance toward keyword data is by learning how tools aggregate and manipulate the data they’ve obtained.
It is close to impossible to find out just how exactly tools run this procedure.
The practice of getting this proprietary information is equal to attempting to discover Coca Cola’s recipe – futile.
Instead, let us settle with the notion that aggregation in itself may further taint the accuracy and reliability of data.
One could argue the reverse that aggregating data can automatically flatten out any extreme data values.
After all, merging these data sources into a single coherent aggregated type will yield a better approximation of the average metric values.
Even though it’s a legitimate stance, keyword tools nevertheless gather data from resources that in itself may be incalculable, biased, and incorrect in their measuring mechanics.
Regardless, keyword tools do more than mixing different data sources into a single set of data.
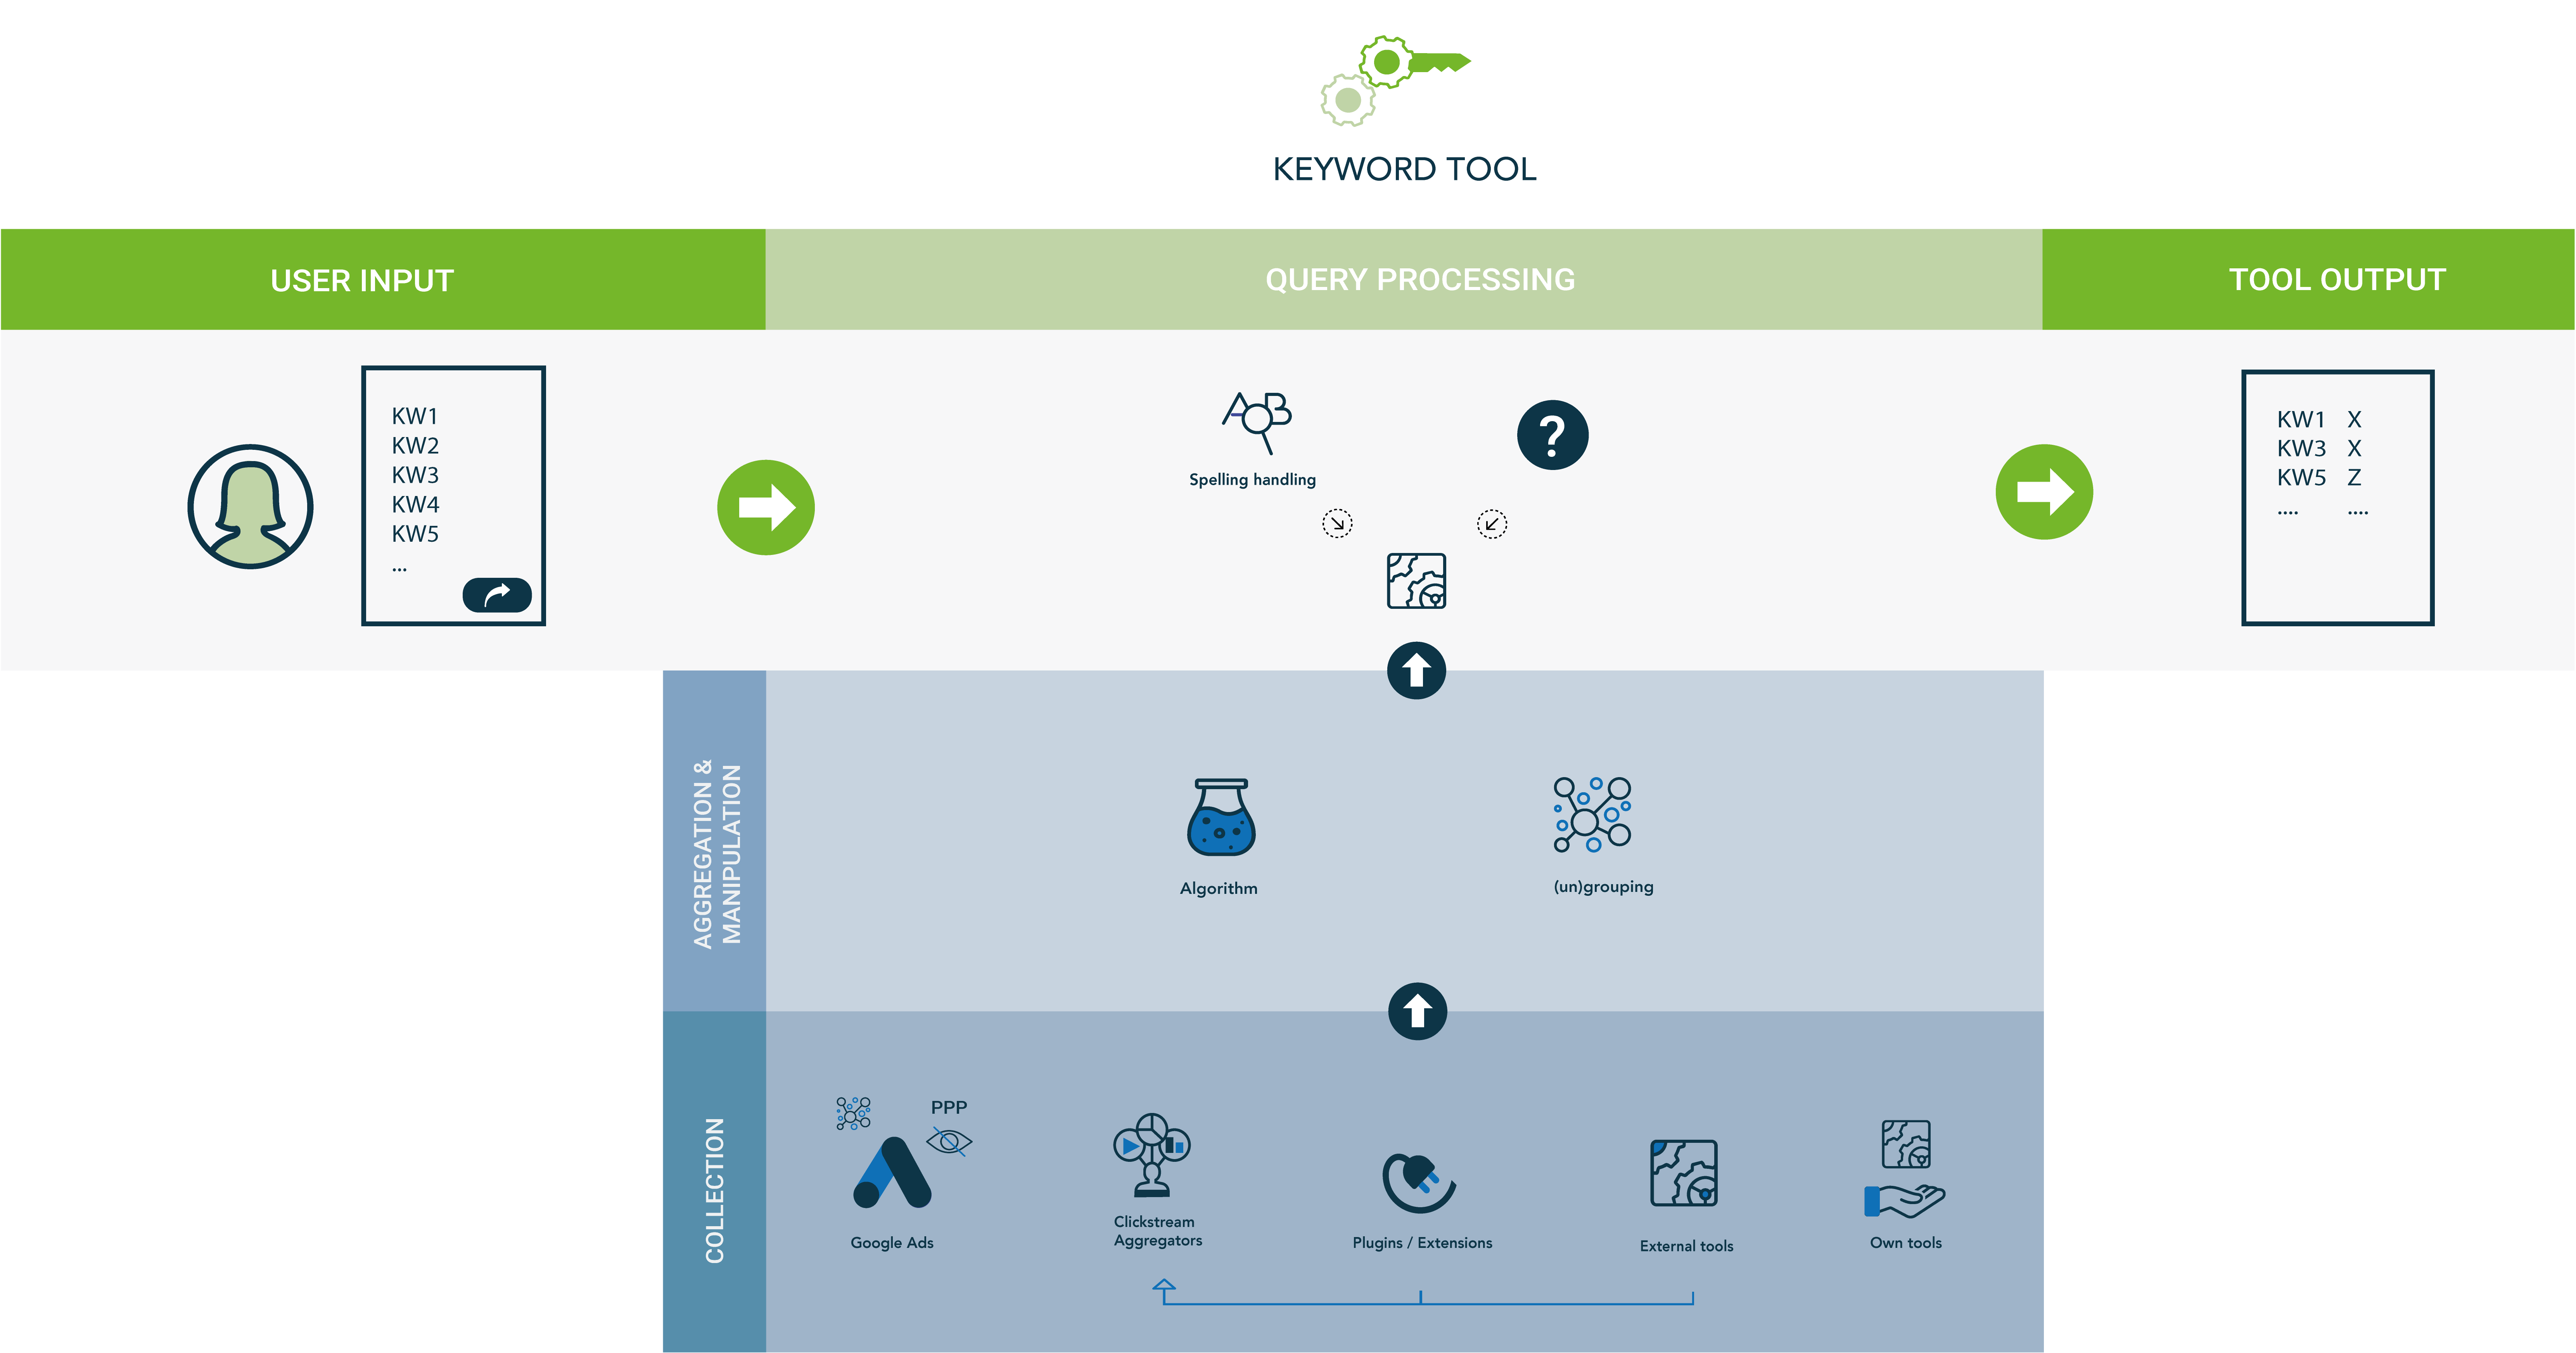 Schematic representation of keyword tools’ workings in collecting, manipulating and querying data.
Running the Data Through an Algorithm
Some tools have developed an algorithm that functions as a filter for their collected data.
For instance, SEMrush explains:
“To ensure the highest level of accuracy, SEMrush uses its Neural Network – a combined algorithm that references various sources of data and recognizes patterns in the same way the human brain understands patterns. The data sources in our network include clickstream data in addition to our own database of backlinks and organic search engine positions. “
It seems a logical explanation that SEMrush uses its algorithm to validate the obtained external data and attune the aggregated metric values where needed.
(un)Grouping
Keyword tools can group keyword data, which proceeds in two different ways:
- They group metric values of search term variations into one.
- They group variations of search terms into one.
This grouping mechanism relies on four linguistic determinants:
- Plural vs. singular nouns in the keyword.
- Combinations of articles and prepositions.
- Usage of regular, comparative, and superlative adjectives.
- Placement of adjectives or interrogative pronouns.
Volume Grouping
Let’s begin with an example.
We have two different search terms, “door handles” and “door handle.”
Some tools, whether keyword tools, aggregators, or other data collecting tools, merge the individual volume values into one aggregate total, and display this total for both keywords.
For example, keywordtool.io groups the keyword, whereas searchvolume.io does not.
That is what it looks like for the U.S.:

Two things stand out immediately:
- Keywordtool.io attributes the same volume value to both keywords (plural and singular), whereas searchvolume.io does not.
- Volume values of Searchvolume.io are significantly lower compared to that of keywordtool.io.
Let’s also take a look at Ahrefs.
Ahrefs collects its data from Keyword Planner, among other sources.
According to the customer service department, Ahrefs ungroups the keywords that Keyword Planner groups together.
The following table is similar to the previous one, but this time we have included data from Ahrefs and pulled the same query for another country.
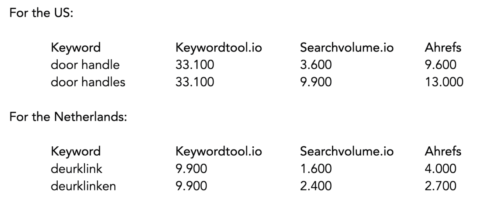
Two things stand out:
- Ahrefs data values reveal different volume values compared to both keywordtool.io and searchvolume.io.
- For the Netherlands, Ahrefs does assign a higher value to the singular form “door handle” compared to the plural type “door handles.” It’s diametrically opposed to Searchvolume.io’s values.
- However, for the U.S., Searchvolume.io and Ahrefs exhibit the same equilateral distribution.
Query attempts with other keyword sets give us similar results. In some cases, tool X presents the largest values, in other cases, tool Y or Z.
One thing is sure: data values are scattered, questioning the reliability of data values.
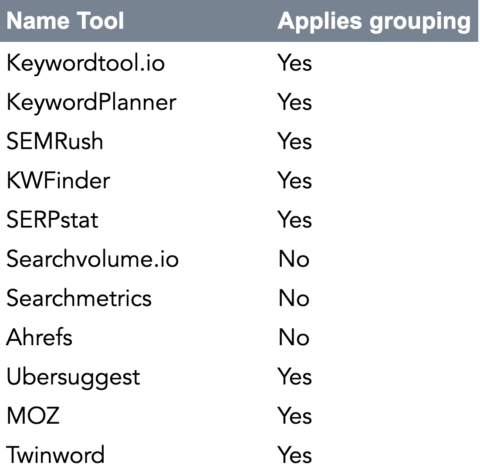
The next table lists a set of popular keyword tools and whether or not they group keyword volumes:
Keyword Grouping
Besides volume clustering, the grouping effect also applies to search terms.
The first linguistic determinant in keyword grouping is singular vs. plural usage of nouns.
Singular vs. Plural
Keyword tools can group nouns into either the singular or plural form.
However, this doesn’t necessarily mean the other version, whether singular or plural, doesn’t exist in the tool’s database.
Tools choose which form to display in the output.
We’ll illustrate with Keyword Planner.
Let’s suppose we want to retrieve the U.S. search volume of the next four keywords.

Next, we choose the tab Historical Metrics showing the following data table:
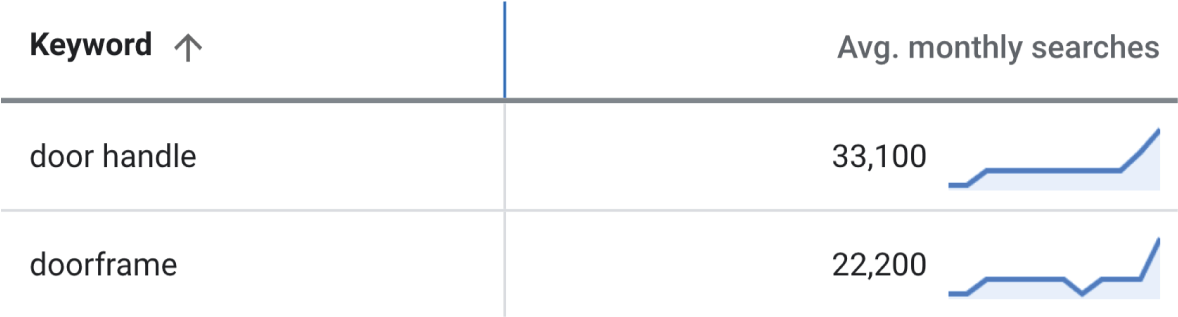
Two things that stand out immediately:
- Keyword Planner returns only data for two out of four keywords.
- Keyword Planner returns only the singular form of the nouns.
When repeating this query for other countries, we can’t observe any logical pattern between the query and the presented data.
For example, for the Netherlands, Keyword Planner serves the following table:

For those with limited comprehension of Dutch language:
- “Deurklinken” (i.e., “door handles”) is plural.
- “Deurpost” (i.e., “doorframe”) is singular.
Keyword Planner thus groups based on volumes as well as keywords.
Looking at both the U.S. and the Netherlands, we can infer that Keyword Planner’s database does contain the data values for both the singular and plural form.
To be sure, let’s rerun the query.
Only this time for just the U.S. and with the plural forms of the nouns:
- “door handles”
- “doorframes”
The results:

While Keyword Planner omits either the plural or singular noun in the export, its database does include data on all four keywords.
Also, the keyword volume values reflect the aggregated volumes for both the plural and singular form.
Likewise, there seems no clear ground on which Keyword Planner decides which form to display other than an arbitrary one.
One can further explore this topic by, for instance, comparing multiple countries, industries, volume ranges, and languages.
More in-depth exploration, however, is beyond the scope of this study.
The fact still is, it causes a great deal of confusion.
Combinations of Articles & Prepositions
Tools group keywords in instances where search terms comprise articles and / or prepositions.
To illustrate, we provide an example of Keywordtool.io.
We compiled a list of eight keywords to extract from Keywordtool.io’s database:
- “legislation in the united states”
- “legislation in united states”
- “legislation the united states”
- “legislation united states”
- “legislation in the us”
- “legislation in us”
- “legislation the us”
- “legislation us”
For the conspicuous reader, the list is as follows:
- We used two ways to write down the United States: “United States” or “US”.
- We created four combinations of the article “the” and the preposition “in”.
- “In the”
- “The”
- “In”
- – (So neither “the” nor “in”)
Querying the data from Keywordtool.io’s database gives us the following data:
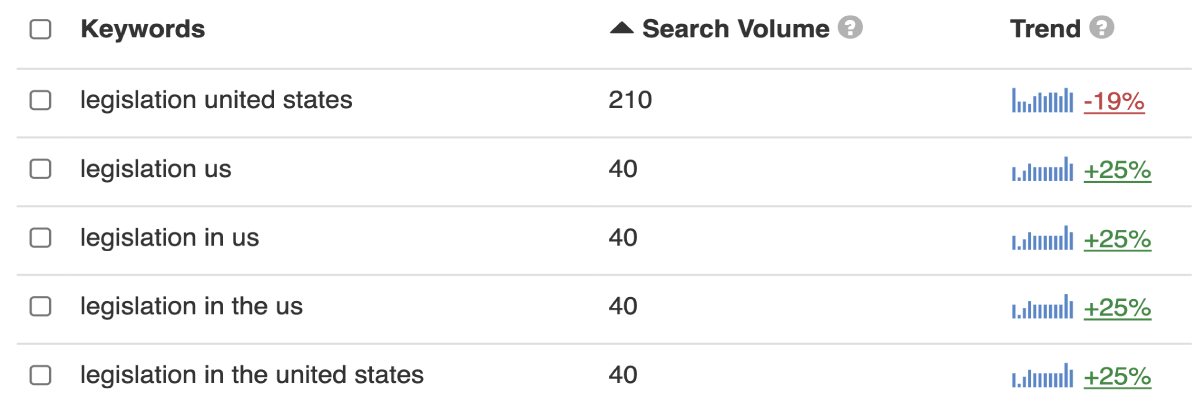
Several things stand out:
- The query prompts results for only five out of the 10 keywords. There seems to be no obvious factor that decisively affects this particular output. The excluded keywords:
- “legislation in united states”
- “legislation the united states”
- “legislation the us”
- Keywords with both the written form “United States” and the abbreviation “US” are presented, but, clearly not for the same variation of articles and prepositions:
- Listed: “legislation in us”
- Not listed: “legislation in united states”
- The combination without both the article and preposition is given for both the “US” and the “United States” variant. Still, both display other volume values:
- “legislation united states” — 210
- “legislation us” — 40
- Grouping of volumes occurs “cross-keyword”. Both variants of “US” and “United States” as well as preposition and article variants exhibit the same metric values. It means keywordtool.io groups the volume values of the following keywords:
- “legislation in us”
- “legislation us”
- “legislation in the united states”
- “legislation in the us”
Pertinent questions that come to mind:
- Why is it that the combination “legislation united states” eludes clustering?
- To what extent do articles and prepositions play a part in keyword grouping?
- How come the particular four ungrouped keywords show clustered volume values?
- Is there any precise, explicit mechanism in place that regulates the presentation of queried data?
These are legitimate questions to which we, unfortunately, do not have a grounded answer.
Keywordtool.io uses the Google Ads API to retrieve keyword data.
Can we then also expect the same to happen with Keyword Planner?
We tested it by running the same query for Keyword Planner:
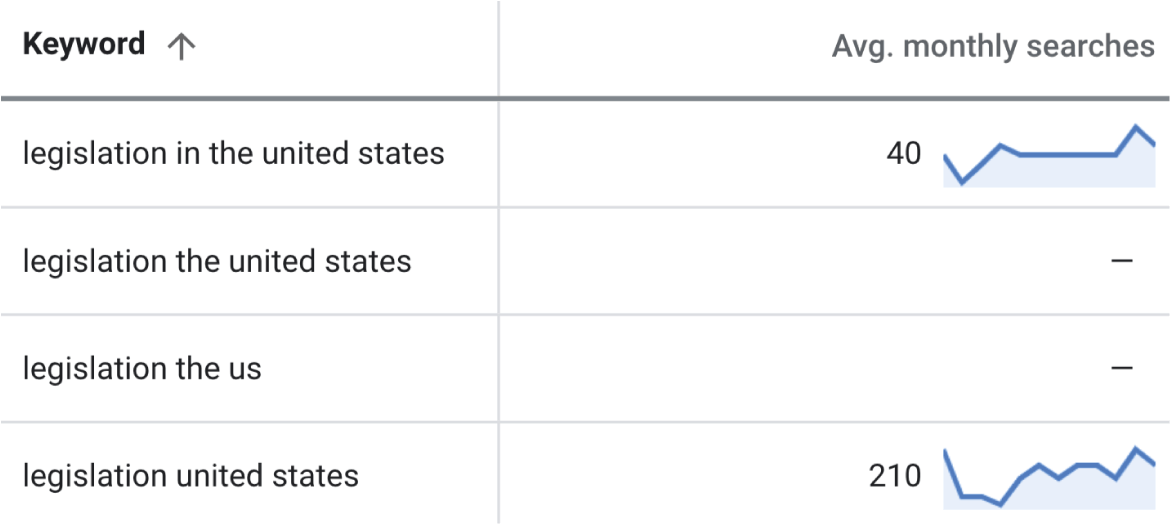
It produces quite a different scenario.
Besides the previous observations, we can also observe that Keyword Planner only lists four out of the eight keywords.
Also, values are given only for two out of the four keywords.
Usage of Regular, Comparative & Superlative Adjectives
Adjectives or interrogative pronouns and comparative and superlative adjectives do play a part in tools’ grouping mechanisms.
At first, it might not seem such a big deal. For instance, if we search for “clean hotels London” or “cleanest hotels London”, the intent and the corresponding SERP results are both pretty similar.
In other cases, however, visitors’ needs and intentions do profoundly differ. Let’s consider the next three keywords:
- “low blood pressure” – I have low blood pressure and would like to have information on blood pressure levels that are considered low, and perhaps what to do about it.
- “lower blood pressure” – I have high blood pressure and I would like to have information on how I can lower my blood pressure levels.
- “lowest blood pressure” – I probably feel quite bad, and I would like to know what blood pressure levels one can have without it being life-threatening.
Looking at the example, we can see differences in:
- Audience.
- Audience’s health conditions.
- Informational needs.
This example highlights the obvious fact that we shouldn’t address these differences with the same content, or cluster these three keywords into one topic bucket.
What happens if we pull data from keyword tools for these particular search terms?
Inserting them into Keywordtool.io prompts the following results for the UK:
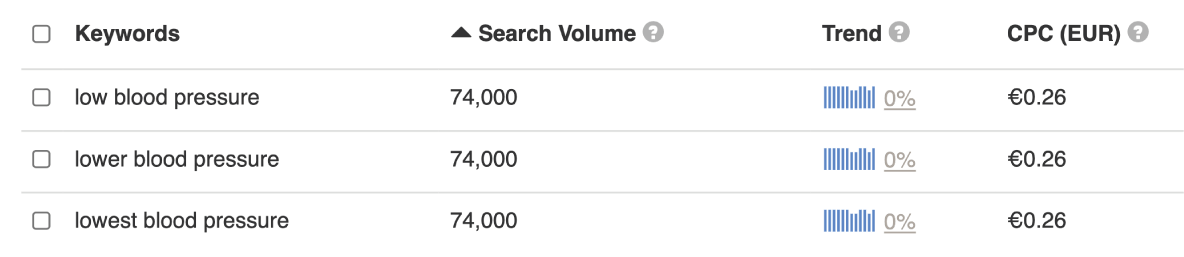
It’s pretty clear: all metrics presented share the same value.
Before drawing any conclusions, let us first cover the final determinant.
Placement of Adjectives or Interrogative Pronouns
The variable placement of adjectives or interrogative pronouns constitutes the last linguistic determinant in the grouping mechanism.
It doesn’t happen too often, but sometimes we place adjectives or interrogative pronouns at the middle or end of a phrase instead of the beginning.
For instance, one can search for:
- “electric scooter fast” or “fast electric scooter”
- “how fast electric scooter” or “electric scooter how fast”
Either case carries the same need for information.
It becomes rather interesting when we add comparative or superlative adjectives to these examples and create new combinations such as “electric scooter faster”.
The point is, differences in interrogative pronouns or comparative and superlative adjectives can exhibit divergences in users’ intent and needs, and the type of audience users belong to, as the next table illustrates:
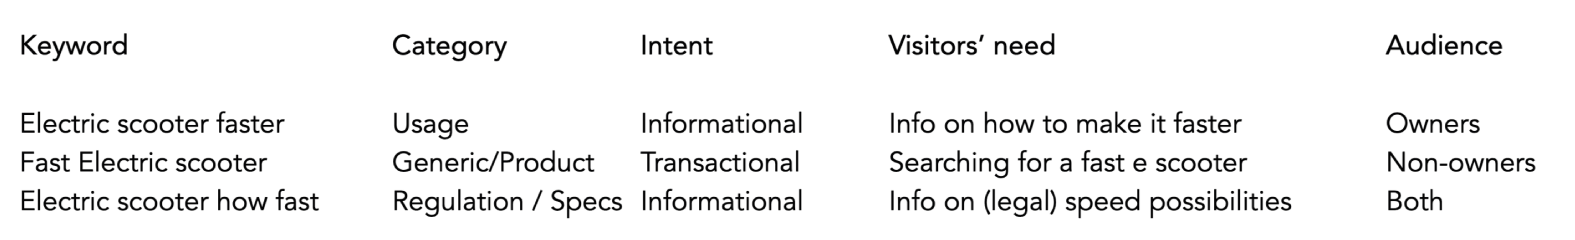
Unfortunately, such latent information is hard to derive from these third-party tools’ query output, especially when grouping is at play.
The next table by keywordtool.io illustrates this:
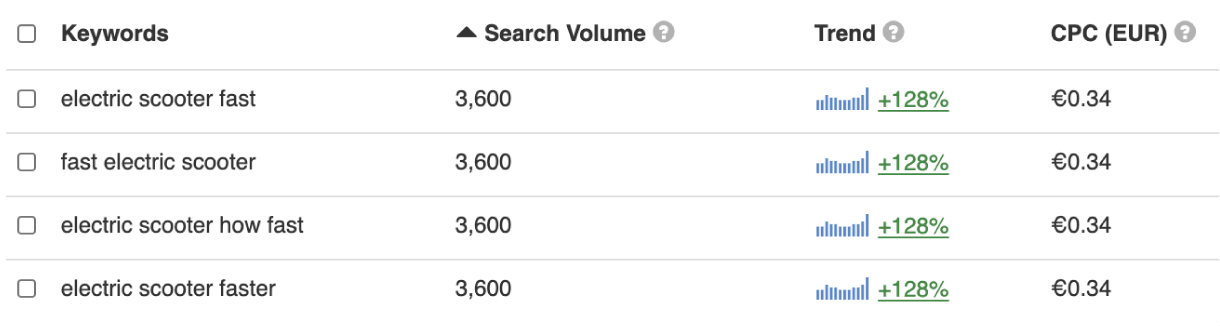
Perhaps not surprisingly, the volume reflects aggregated values.
The conspicuous reader notices that the table merely lists keywords in the singular form.
Converting singular to plural form gives us the next data provided by keywordtool.io:
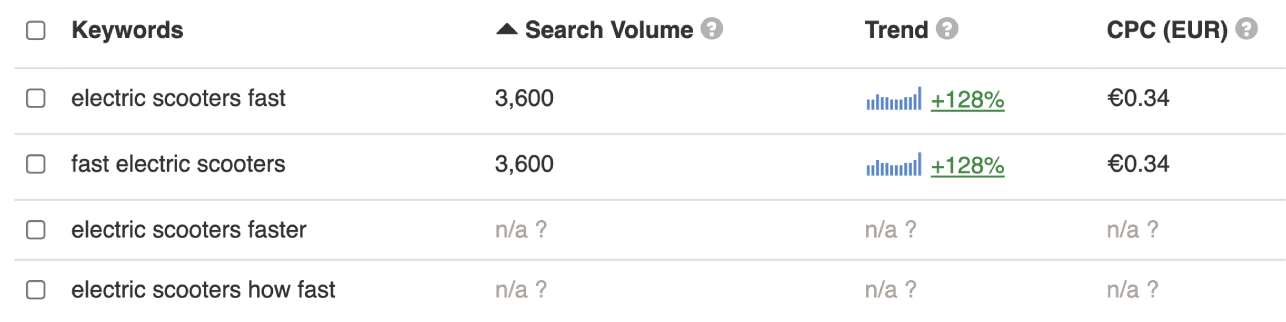
For data accuracy and reliability purposes, the immediate action here is to validate, to the extent possible, the volume values attributed to each keyword.
One way to do this is by querying the same four keywords in other keyword tools.
Other tools prompt different results. For example, SEMrush shows no results and Keyword Planner was similar to Keywordtool.io.
Ahrefs and Searchvolume.io did present data for all variations and, even more interesting, with disproportionately smaller volume values.
For instance, the query for the UK in Searchvolume.io prompts this data table:
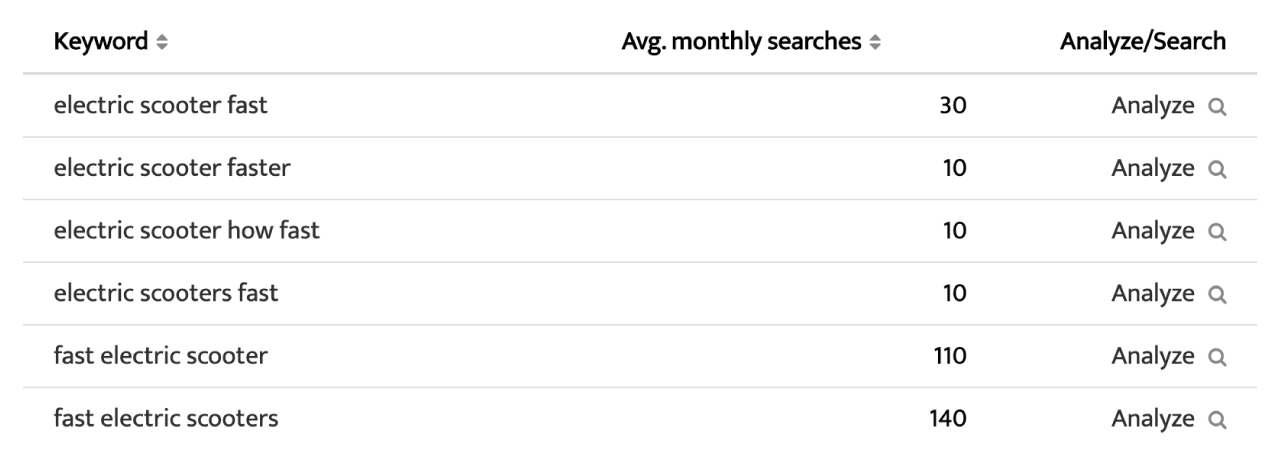
That is a staggering 70 times the difference of 310.
It’s true that the volume value of 3.600 already reflects the aggregated volume for the set of six keywords.
But sadly it happens all too often that marketers record all six – or perhaps even more – variations in keyword analyses.
We can propound the idea of choosing one variation and omitting the other combinations. But it will not solve the issue.
The embedded information in keyword variations about users’ intents and needs can simply differ, and thus any form is relevant to include.
Imagine overlooking such a detail, failing to see that each keyword potentially belongs to different clusters of keywords destined for different pages.
And basing your traffic and financial projections on these numbers.
It’s a compelling image, albeit a little amateurish. Nonetheless, something that happens frequently.
There is one observation left unattended.
Keywordtool.io presents disproportionately larger volume values as compared to that of, for instance, Ahrefs.
Despite them both retrieving keyword data from Keyword Planner.
Apart from the tools’ data handling systems, what could cause such a difference?
Spelling Errors
Keyword tools differ in how they deal with spelling errors.
Some, like Searchvolume.io, leave out any spelling error variant in your query output.
Others, like Ahrefs and Keywordtool.io, do include spelling errors variants.
They both show the data values for every single keyword in your query as long as the keyword’s correct spelling variation exists in its database.
But as Ahrefs ungroups keyword data originating from Google Ads API, it does attribute unique metric values to each spelling error variant.
Keywordtool.io, on the other hand, adopts the grouped keywords and metric values it retrieves from Keyword Planner, causing all spelling error variants to show identical metrics.
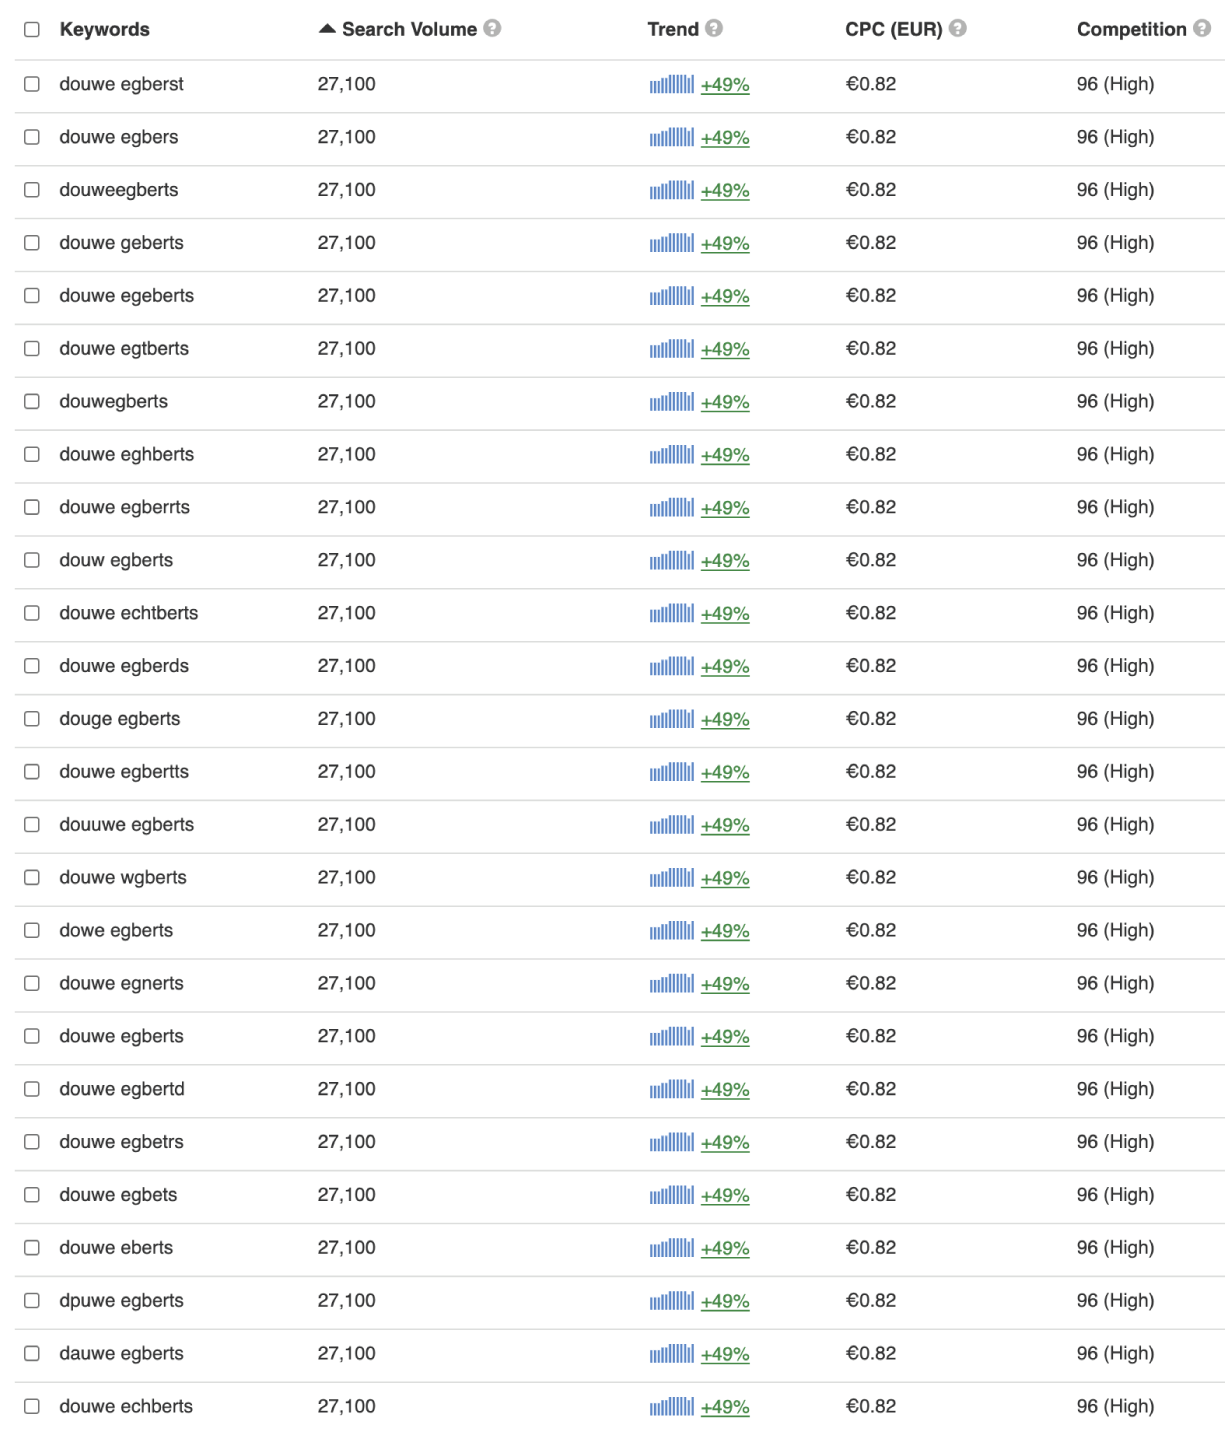
Misspellings often occur with brand names easily prone to being misspelled.
Think of brand names such as Audemars Piguet, Breguet, Douwe Egberts, Schwarzkopf.
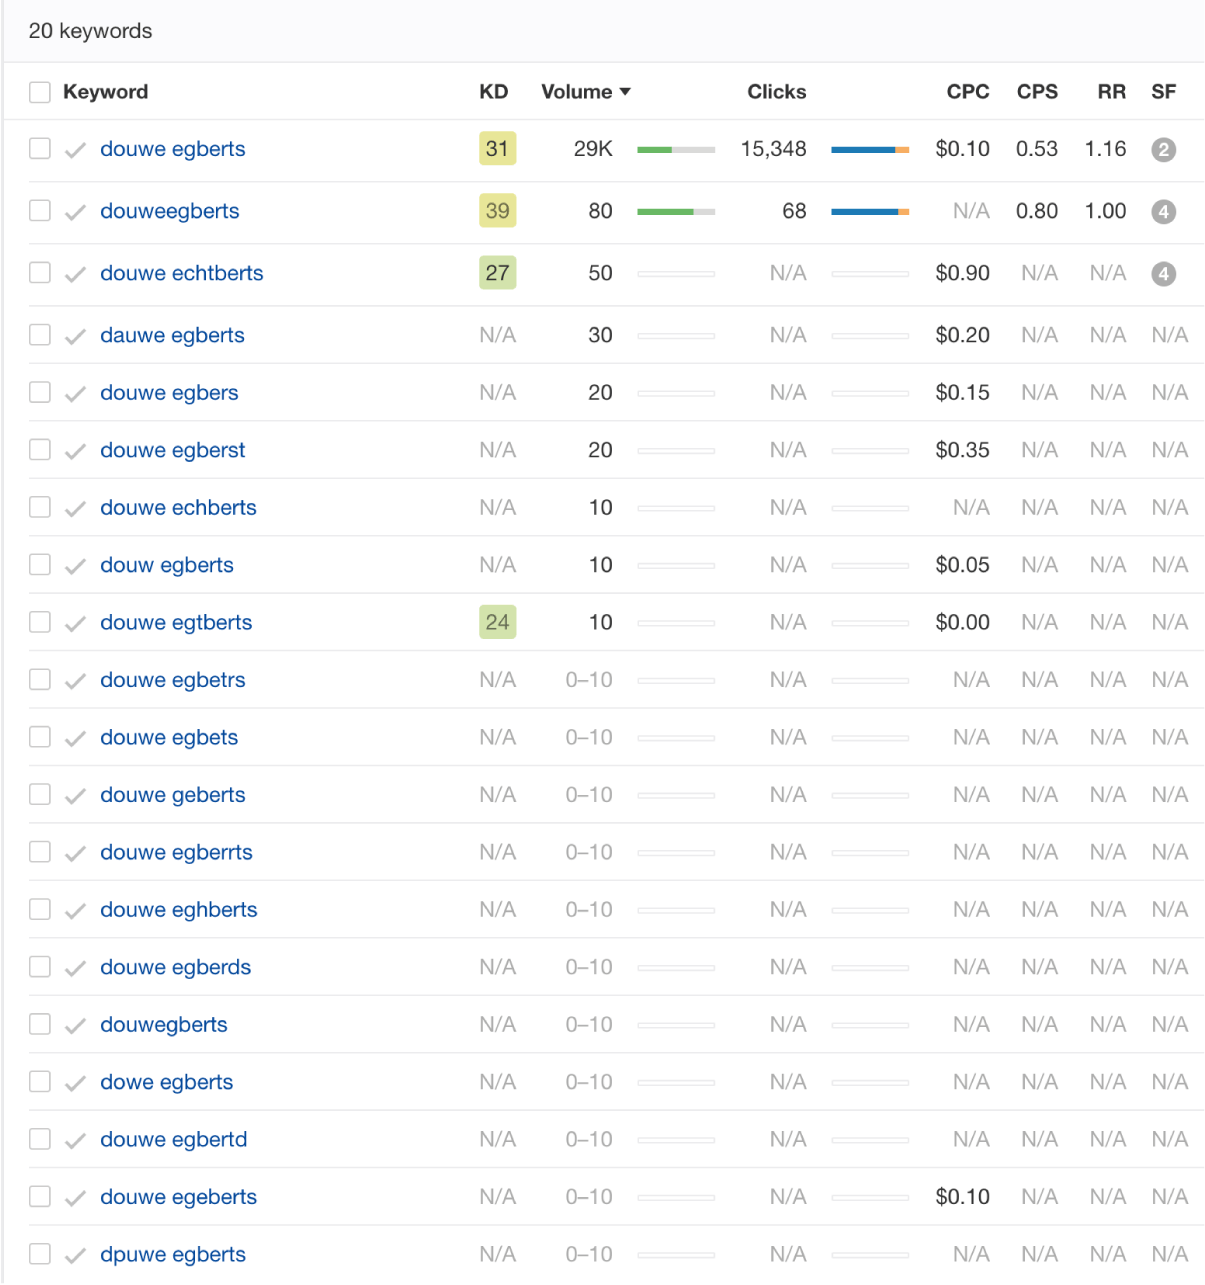
Let’s take a look at “Douwe Egberts”.
I am Dutch, and as a native, I am familiar with the varieties of errors one can make.
For instance:
- Is Douwe with ou or au?
- Is Egberts with g or ch or even with gh?
- Is it Egbert or Egberts?
Point is: what happens when we query a list of one single keyword misspelled in 26 different ways?
Despite the grouping mechanisms in place, Keywordtool.io serves you every unique misspelled keyword combination:
Ahrefs’ situation is a bit different. The query output is as follows:
Things that stand out:
- The query excludes 6 out of the 26 keywords.
- Ahrefs seems to independently attribute data values per metric.
- Except for the first result, which is the correct spelling variation, all other keyword variations have either one or multiple metric data values missing.
Keep in mind that it only works with the ‘list’ mode. The ‘explore’ function will only serve the correct spelling variation.
Omitting ‘PPP’ Data
Google Ads API omits keyword data involving ‘PPP’ topics.
It means that other tools retrieving data from Keyword Planner also face this limitation unless they enrich their database with data coming from other sources.
For security purposes, Google disallows keyword tools to retrieve keyword data revolving around Porn, Pills, and Poker.
Think of keywords like “cannabis” or “full house” but also keywords such as “Koffiemachine huren”.
“Huren” is Dutch for renting. But it also means “whores” in German.
While this ruling is not a matter of direct manipulation, it does complicate marketers’ data collection and analyses.
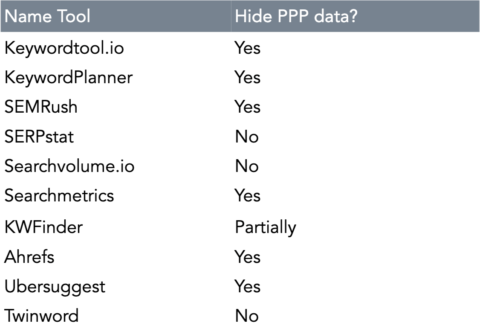
A selection of keyword tools and whether they provide”PPP”-data for your query:
The above examples illustrate the chaotic nature of keyword tool mechanisms and the hazards they impose on SEO consultants’ work.
To Sum Up
- Keyword tools do not necessarily show all keyword variations and corresponding metric values.
- Potential determinants: Tool’s functionality, safety or security measures, or missing data in the database.
- To our knowledge as outsiders, it seems the particular display of combinations of keyword and metric value variations is randomly “chosen”.
- Grouping applies to both the numerical values and search terms.
- Linguistic determinants for keyword grouping:
- Plural vs. singular.
- Usage or non-usage of articles and prepositions.
- Placement of adjectives or interrogative pronouns.
- Usage of comparative and superlative adjective.
- Grouping occurs both within a particular group and across group variations.
- Grouping occurs at random.
3. Data Validation: Validating Keyword Data Values
Keyword data validation is possible, yet without access to uncorrupted data, it becomes an act of finding the closest approximation to the keyword’s actual data values.
One option is to benchmark keyword impression data values from Search Console to volume values of third-party keyword tools.
Search Console data isn’t 100% reliable either, but it is as close as we can get.
Early in 2020, we designed a study to determine the accuracy of keyword data with a set of 160 keywords from a variety of industries.
The study tackled these two questions:
- For each keyword tool, what is the average deviation % of keyword volume values for the whole set of keywords compared to Search Console impression data values?
- For each keyword tool, what is the variance of all deviation % for the whole set of keywords?
The former gives us insights into the degree of accuracy for any given keyword’s volume value.
The latter question determines to what extent the deviation % of each keyword is spread out from the average deviation value.
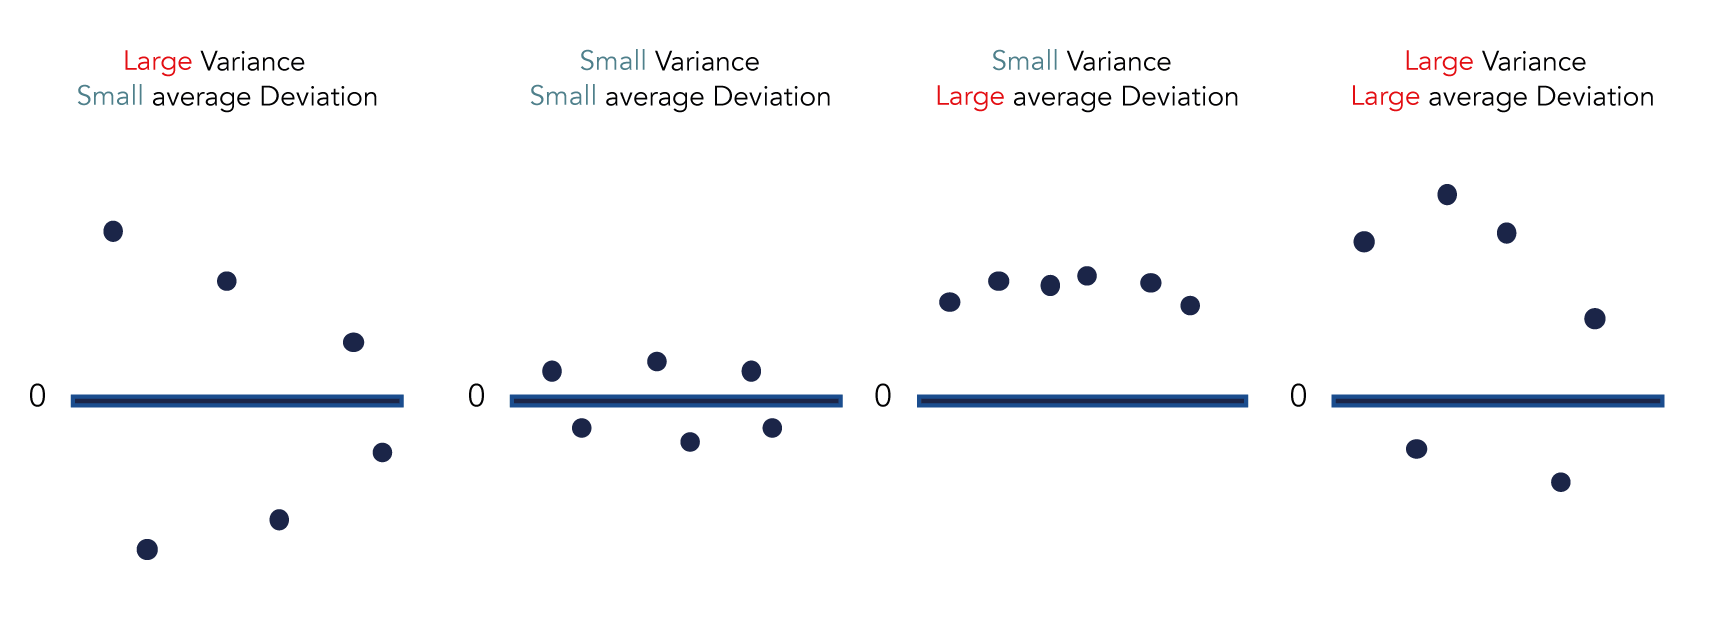
As values can both deviate negatively and positively, it does not suffice to merely show the average deviation %.
It is the combination, however, of both scores that yield the best results in determining the data values’ accuracy and reliability.
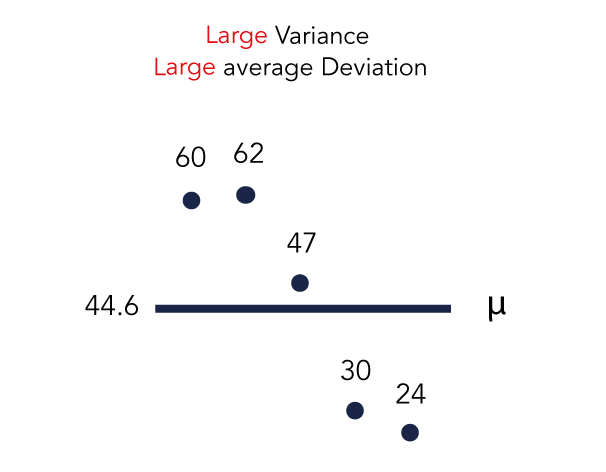
As these visualizations illustrate, we see that exclusively looking at either variance or average deviations can prompt erroneous representation of the situation:
Measuring the variance of the average deviation % enables us to determine the scatteredness of each keyword’s deviation percentage.
Large dispersions hints to lower accuracy and thus reliability of the keyword volume values.
To put it differently, the more substantial the variance, the higher the likelihood of selecting a keyword from the data set showcasing a more inaccurate volume value than the average volume value deviation.
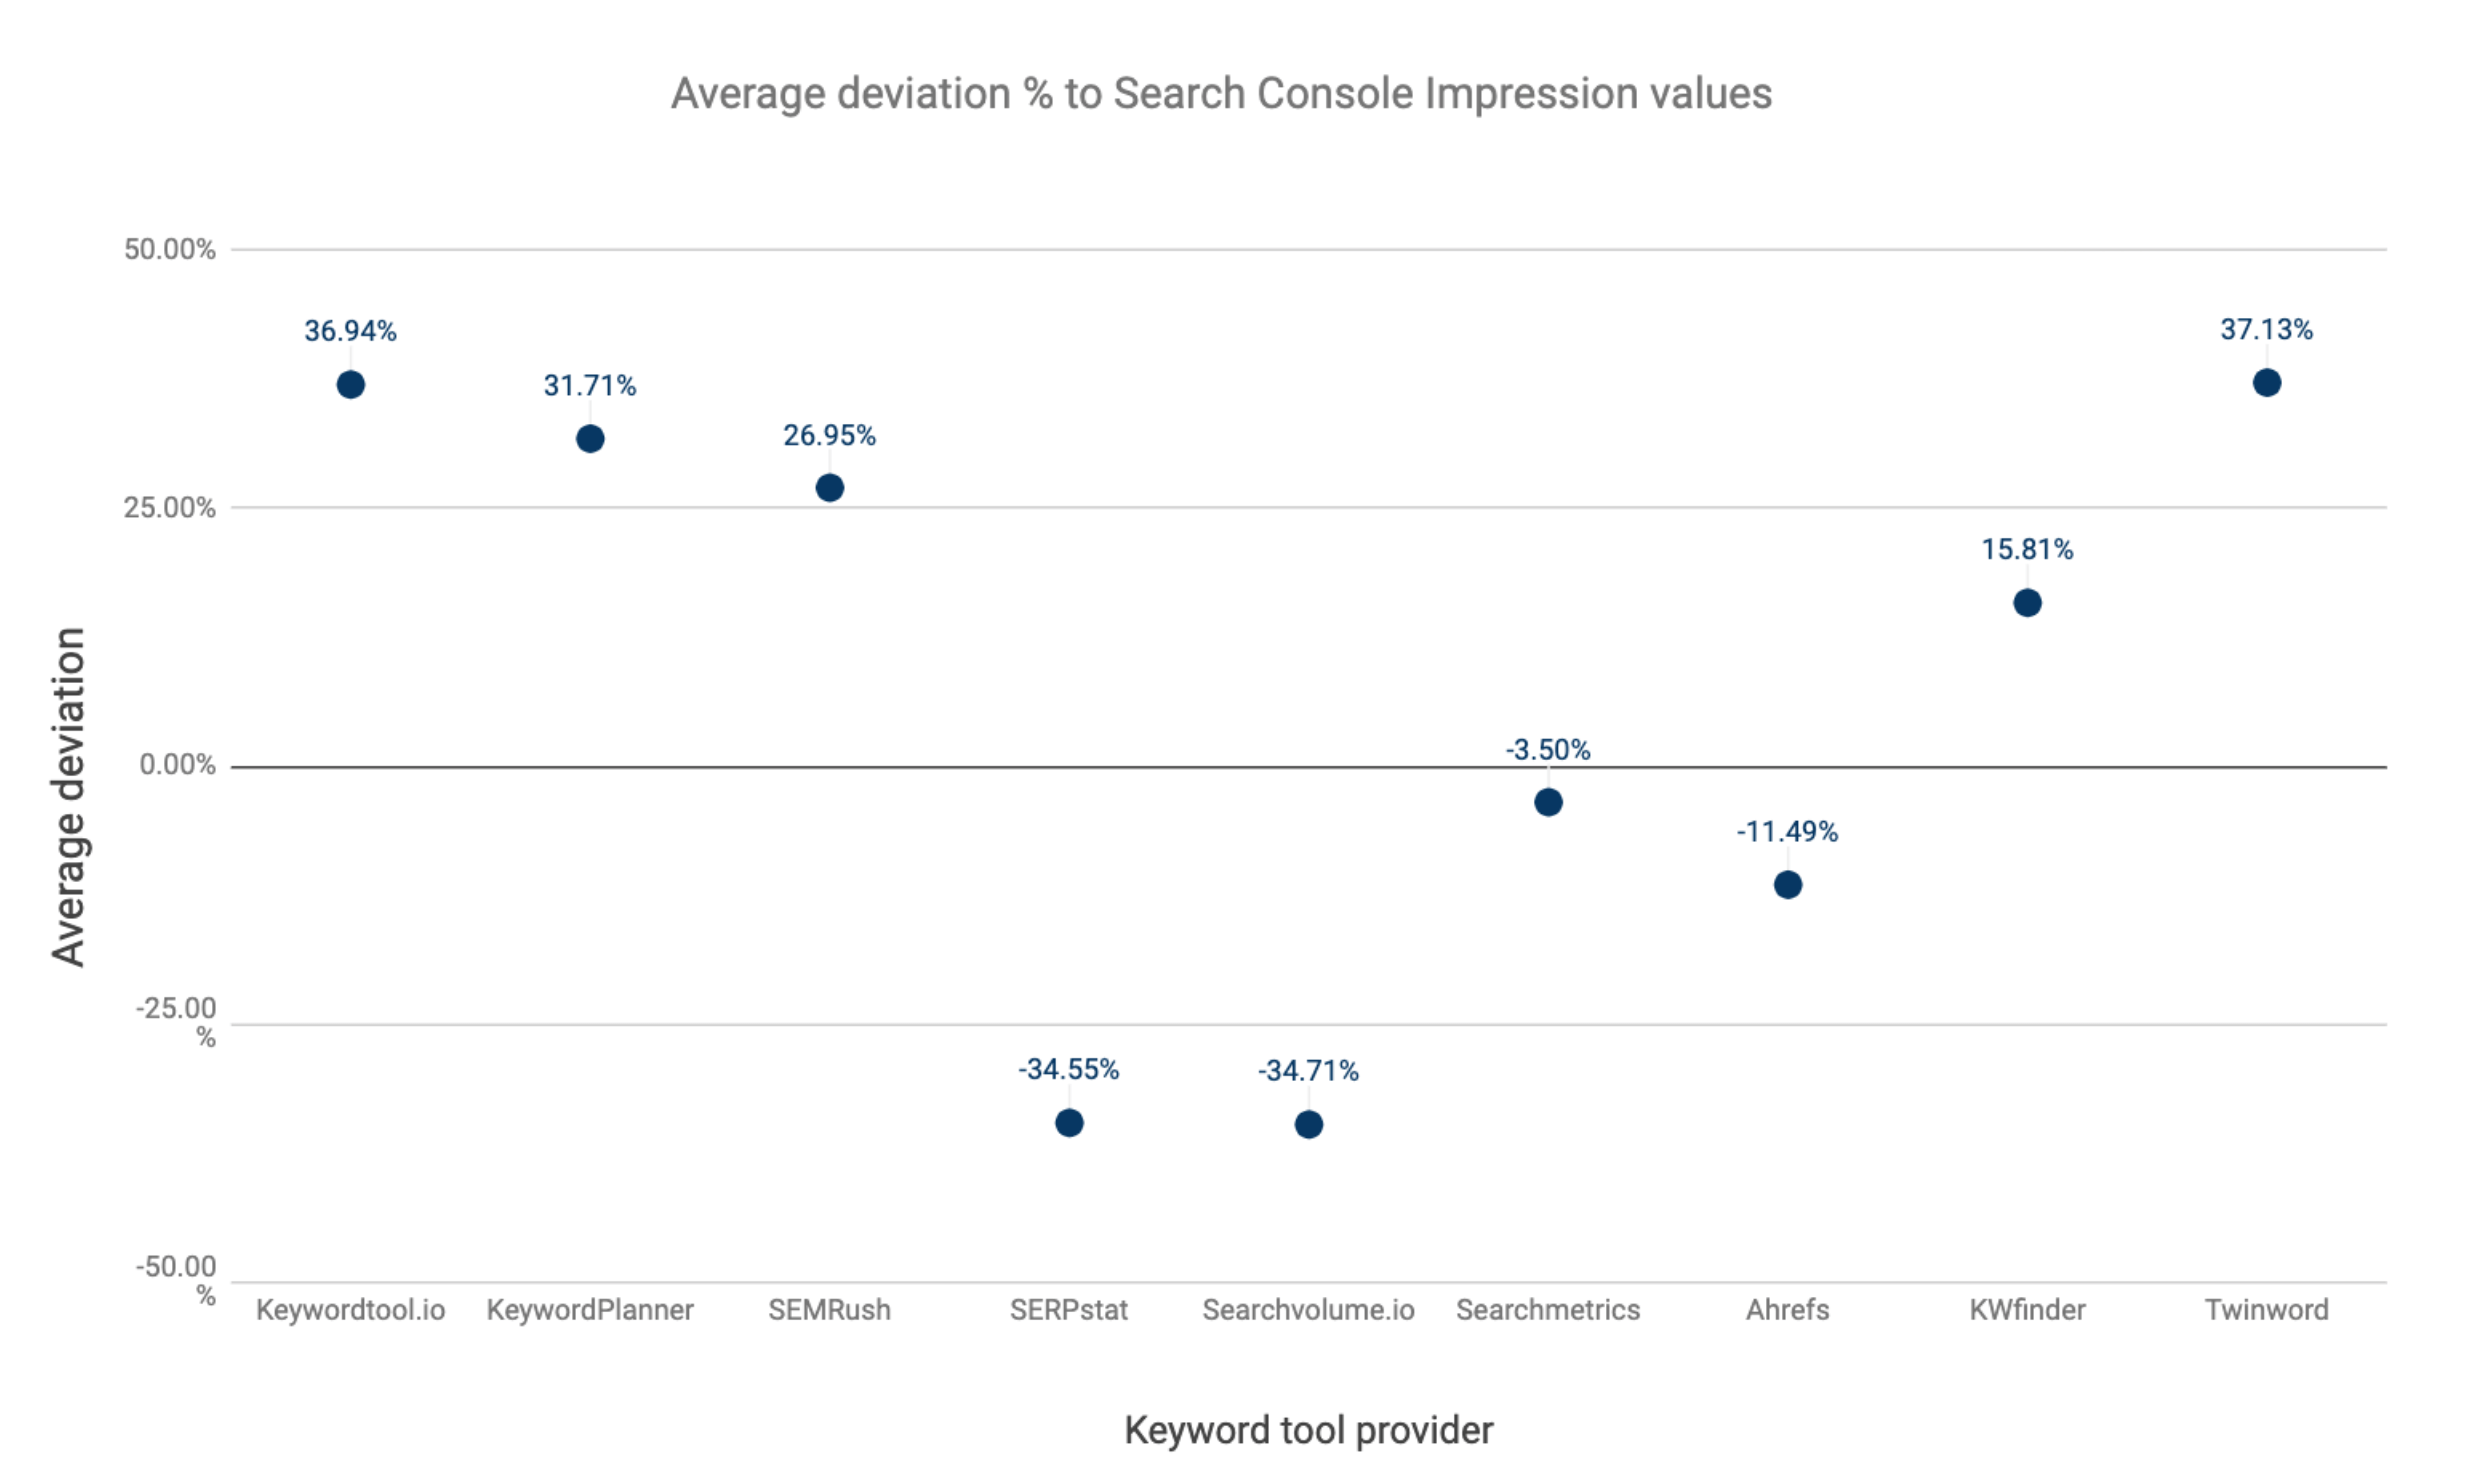
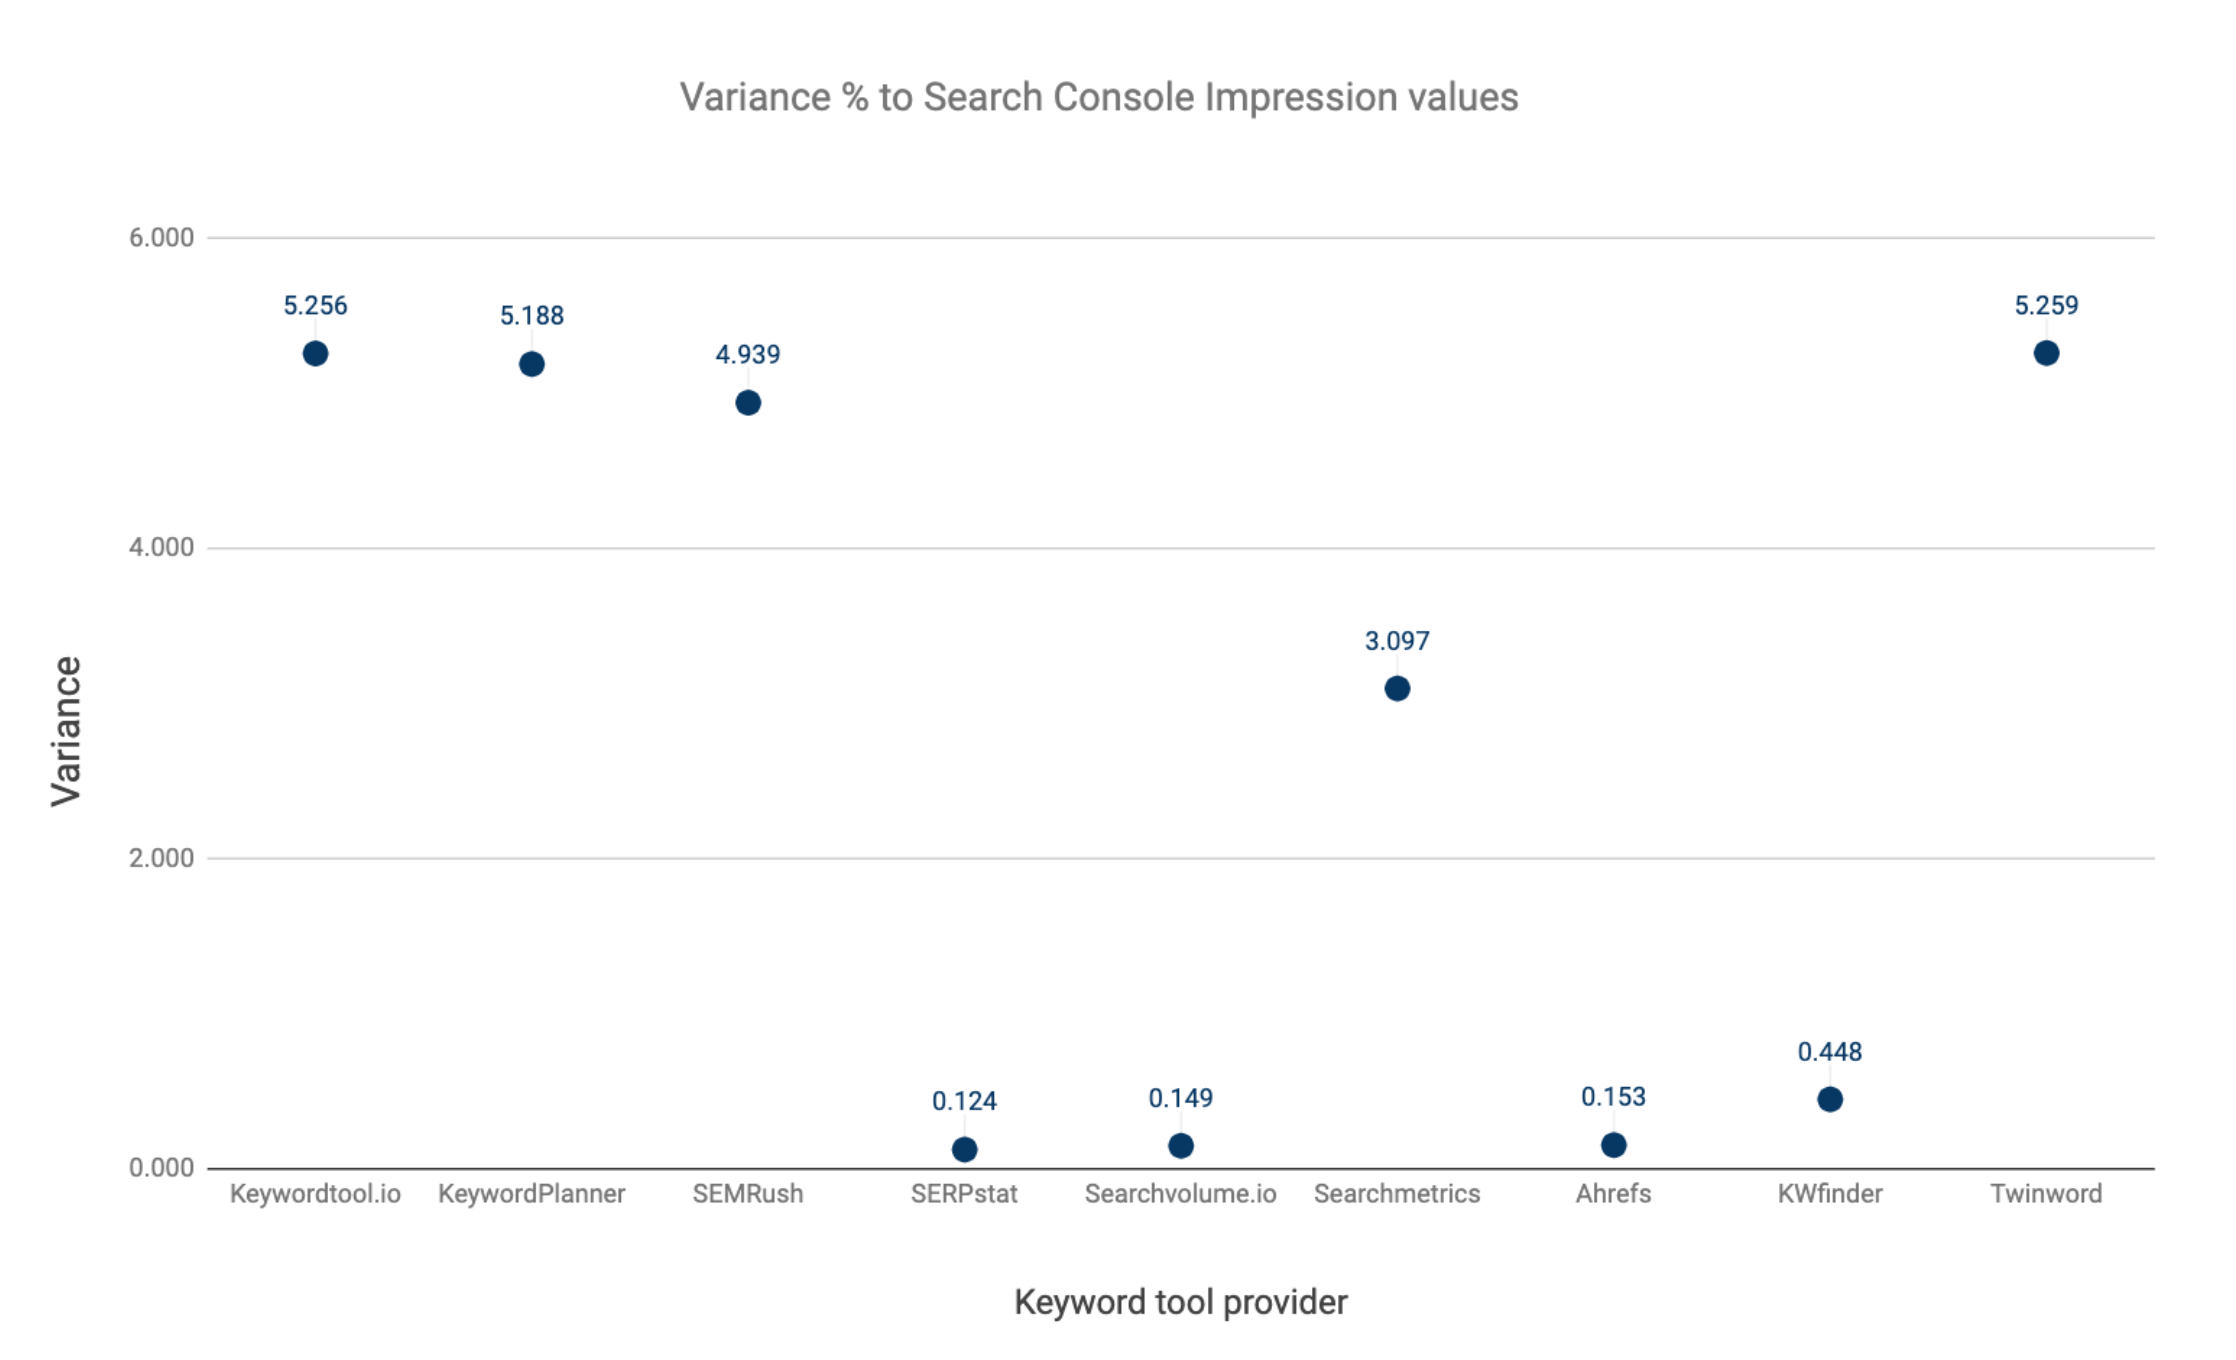
These were the key findings:
- Twinword volume data showed the largest positive average deviation to Search Console impressions: +37.13%.
- Searchvolume.io volume data showed the largest negative average deviation to Search Console impressions: -34.71%.
- The frontrunners with the largest variance
- Twinword: 5,259
- Keywordtool.io: 5,256
- Keyword Planner: 5,188
- The frontrunners with the smallest variance
- Serpstat: 0.124
- Searchvolume.io: 0.149
- Ahrefs: 0.153
Ideally, tool providers exhibit numbers close to zero for both the average deviation and the variance of the average deviation.
These findings show otherwise. Specifically:
- The grouping effect drives the large variance and average deviation score by the frontrunners.
- Both Keywordtool.io and Twinword get their data directly from Google. And since Google Ads applies grouping to keyword and data values, Twinword and Keywordtool.io automatically adopt this effect.
- Keywords with the largest data value deviations also appeared to be keywords with grouped data values.
- Serpstat, Ahrefs, and Searchvolume.io present variance numbers close to zero. These tools do not apply any clustering.
- Serpstat and Searchvolume.io show considerably lower average deviations. It suggests that volume data is on average lower than what you would expect according to the Search Console.
- Although Searchmetrics’ keyword volume values barely deviate on average to Search Console’s impression values, the individual data values are further removed from the mean, suggesting a higher degree of inconsistency in keyword data values.
- The numbers of Ahrefs and KWFinder exhibit the closest approximation to the keyword’s actual data values.
Data values from third-party keyword tools vary widely and seem to fail in providing unambiguity or consistency.
The findings further give the plausibility to the idea that mechanisms in handling data queries, and collecting or manipulating data, can add to delivering erroneous keyword data.
Can We Then Validate the Accuracy of Keyword Data in Another Way?
Together with Sander Tamaëla, a Dutch Freelance SEO-expert, we came up with a way to validate the accuracy of third-party keyword volume values with the help of Google Search Console and Google Trends data.
The idea was as follows:
- We picked one noun and selected both the plural and singular form.
- We had validated the accuracy of search volumes with GSC monthly average impression values.
- Then we retrieved the volume data from two or three random keyword tools.
- We then placed these two keywords in Google Trends.
With this setup, we could determine the relative interest between the two keywords.
Our assumption here was that Google Trends’s relative interest scores reflect the purest data values.
As such, the relative interest score should reflect a ratio similar to that of impression values in Search Console.
- Next, we expanded the set with keywords – for which we know we have an accurate approximation of the impression value – from several volume ranges.
- Then we compiled a training set.
The idea was to determine per volume range the deviation per keyword volume value based on the relative interest scores of Google Trends.
Unfortunately, things didn’t work out as planned.
After we had challenged the assumption that Google Trends data depicts accurate values, we discovered that Google Trends isn’t entirely reliable either.
To test the reliability of Google Trends we set up the next test:
- We selected five keywords with very similar monthly impression values in Search Console.
- We then added these five keywords in Google Trends.
- We made sure that we had chosen the same 12 month period for Search Console as for Google Trends: 1 December 2018 until 30 November 2019.
One of the five-keyword sets, in Dutch:
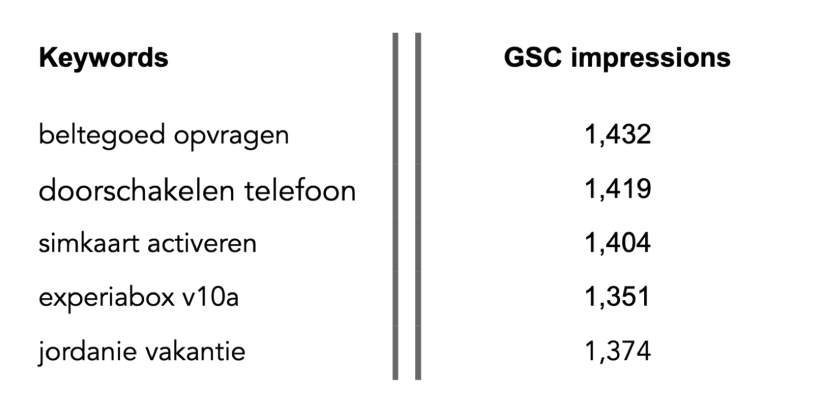
The next chart illustrates each keyword’s impression value deviation from the mean:
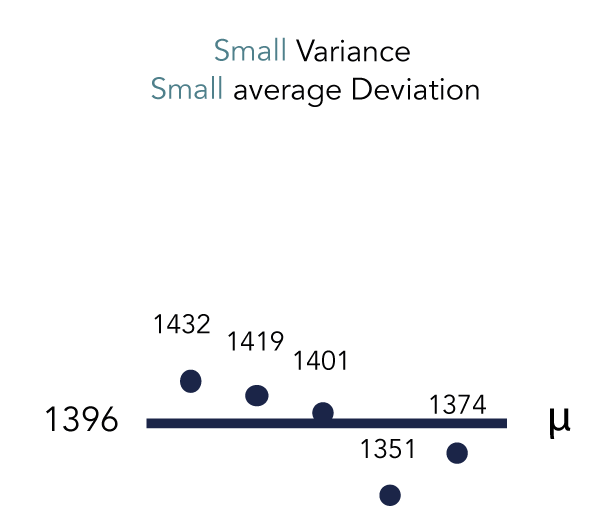
The monthly impressions average deviation in percentages was only 1.92%.
Unfortunately, it is only possible to select up to five keywords in Google Trends, limiting our sample to five keywords.
Such a sample size is statistically not a significant representation of the population. The only alternative was to repeat the test setup with different sets of keywords.
If Google Trends is reliable, we would have expected that the average interest ratio between the keywords in Google Trends is virtually the same.
What was the result?
For those five keywords, we observed ratio levels of relative interest score that were varying disproportionally:
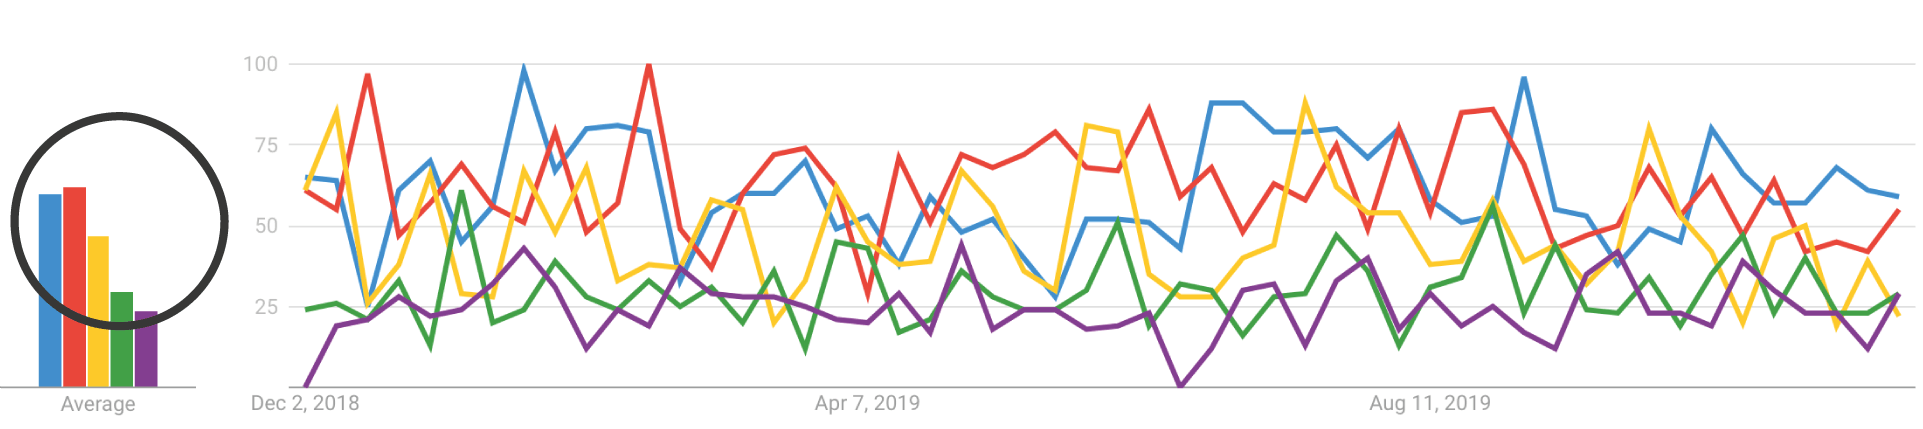 Google Trends’ average interest scores:
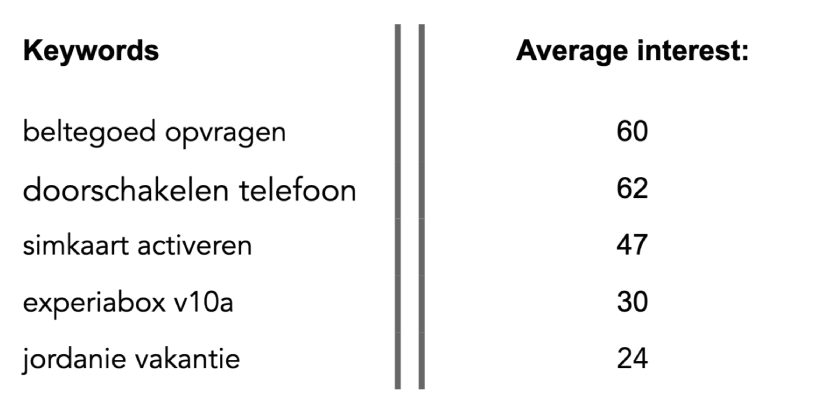
The ratio of three out of five corresponds to the ratio of Search Console impressions.
But the remaining two keywords differ significantly, with an average deviation in percentages of 31,57%.
Again, with a sample size of five, the average deviation output is not significant.
But by repeatedly testing the setup for different keyword sets, we observed a similar pattern.
Two other examples of Google Trends’ relative interest scores for five-keyword sets:
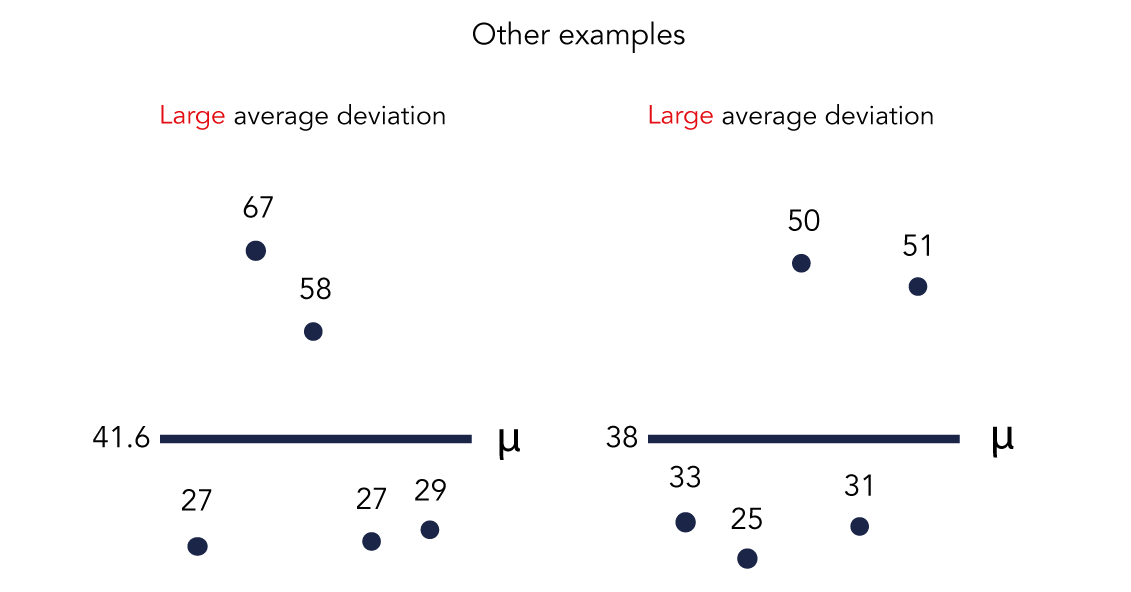
To put in perspective, the ratio average deviation percentages of Search Console are respectively 2.73% and 1.62%.
Google Trends’ average deviations thus show significantly larger percentages than those for Search Console’s impression value ratios.
Can we then draw any conclusions here?
As outlined in the beginning, Search Console isn’t always showing the most accurate representation of reality.
However, the designed setup to test Google Trends’ data accuracy and reliability provided evidence suggesting that data from Google Trends isn’t consistent or unambiguous either.
Does this mean that we can no longer use these tools? Or perhaps only some?
Not necessarily.
But, it doesn’t hurt to be aware of the demerits from keyword tools.
4. Role as an SEO Consultant
The primary purpose of this study is to grow awareness about the complexity surrounding the data values of keyword tools.
The next step after awareness is to incorporate critical thinking allowing us to recognize any faulty habits.
Common pitfalls to avoid:
- Taking volume data values as granted.
- Merging keyword volumes from multiple tools without further checks.
- Skipping the spellings check.
- Ignoring the grouping effect or not validating groupings.
- Inferring hard conclusions from your keyword volume data calculations.
- Not providing a reliability clause for your findings in the communication to your customer or prospects.
We cannot afford to take data from keyword tools for granted.
To build expertise and provide solid, reliable advice, we ought to set standards for how we work with keyword data.
How Will This Impact Your Role as an SEO Consultant?
I would argue that it starts with establishing a greater sense of accountability.
Remember the earlier example of overlooking a minor detail?
Imagine that happens.
You give this killer PowerPoint presentation. The prospects at the table are completely baffled by your story; you just landed a new client!
A few months pass by, and you discover that the total volume amount of your keyword data set is only 60% of the total amount you initially communicated to your client.
Assuming your analysis included virtually all existing keywords relevant to the business, such a mistake is difficult, perhaps even impossible to rectify.
Especially if your client’s case is specific to a niche or product cluster, you simply won’t find other relevant keywords to close the volume gap.
To avoid such disasters we recommend to incorporate the next worthwhile practices:
- Spend more time on your data analysis. A correctly performed keyword analysis takes time. Quality ≠ quantity.
- Validate your keyword data values.
- Double-check your data for irregularities
- Have your ‘facts’ straight.
- Do you have to make a presentation and draw conclusions? Make sure you at least have a proper contextual story ready to support your claims.
Your boss or client might not understand why individual efforts during the analysis have to take a substantial amount of time.
Be open and transparent to clients and prospects about the required efforts to ensure the continuous delivery of quality. It creates trust and fosters mutual bonding.
Telling your client beforehand is thus indisputably better than explaining your mistake afterward.
That will irreversibly compromise the relationship with your client.
Final Notes
- This study’s goal is not to place keyword tools in a bad light.
- Neither do I argue that keyword tools are in any way deficient. The reason I have provided the examples is purely to evoke a sense of awareness surrounding the accuracy and reliability of keyword data.
- This study did not include other search engines such as Bing, Yandex, and Yahoo.
Appendix
The study’s setup was as follows.
We selected a set of 160 keywords from various Google Search Console accounts. The selection of keywords depended on whether all of the following conditions were satisfied:
- The keyword must have had a top 3 SERP ranking for 12 consecutive months without any temporary dips reaching lower rankings.
- This facilitates an as close as possible approximation of the real average monthly impressions count, based on a 12 month period.
- The keyword’s monthly impression count is 1000 or higher.
- This increases the likelihood that each participating keyword tool’s database contains data on the selected keyword (long-tail keywords are less likely to be registered in keyword tool databases).
- The keyword should not be subject to seasonality.
- It increases the likelihood of consistent top SERP rankings throughout the year.
- We also made sure that the 12 month period of GSC data matched the 12-month period with which keyword tools calculate their monthly averages.
These criteria were set in order to establish an accurate recording of calculated monthly impression values.
Most keyword tools calculate their monthly average volumes in a similar vein.
More Resources:
- Top 7 SEO Keyword Research Tools for Agencies
- How to Go Deeper with Keyword Research: Go-to Tools & Techniques
- 7 Things SEO Tools Can’t Tell You
Image Credits
Featured Image: Created by author, June 2020
Infographic: Created by author, May, 2020
Screenshots taken by author, April & May, 2020
