


As you’re preparing to set up Google Analytics (GA4), you’re probably asking the same thing we were: What’s the best method for migrating our historical data?
There should be a way to do this, right?
In this column, you’ll learn whether we can merge data in GA4 and three DIY ways to save your historical data.
Can You Migrate Your Data To GA4?
The primary concern is whether GA users can transfer or migrate Universal Analytics data into their Google Analytics 4 property.
Unfortunately, you cannot migrate your data to GA4, and it’s not likely to be a feature we’ll see added in the coming months.
Migrating your data to GA4 is not likely to be a feature because the two versions use completely different data models.
I spoke with Charles Farina, Head of Innovation at Adswerve, and he explained that:
“It is the difference in schema and dimension definitions/calculations that make merging the data not possible.”
Schema refers to how the data is organized and the language used to ensure compatibility. Essentially it is the blueprint.
He explains you can see the differences in schema well when comparing the BigQuery integrations for UA and GA4.
“The UA export is sessionized, meaning each row in the export is a session, and every interaction is nested in that row. The GA4 export is very different, where each row is the event (interaction) itself,” shared Farina.
Another key reason is how dimensions and metrics are defined and calculated in GA4 compared to UA.
Google has a great support page that goes over many of these.
For example, let’s look at one of the most common KPIs, “Users.”
Universal Analytics reports on Total Users or all users, while GA4 focuses on Active Users or users that have visited the website at least once in the past 28 days.
Even if we could migrate UA data to GA4, it would be like comparing apples to oranges.
If you’re wondering why this change is happening, you’ll find the answer in our article, Google Analytics 4 FAQs: Stay Calm & Keep Tracking.
How To Export Google Analytics Historical Data
Google does empathize and encourages users to export their historical data.
“We know your data is important to you, and we strongly encourage you to export your historical reports during this time.”
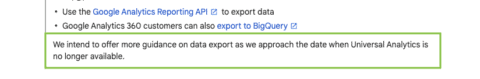 Screenshot from Google Help, April 2022
Google hints that more guidance on how to export may be coming in the future.
The good news is while we cannot migrate our data, we can still save it.
Google allows GA360 (paid product) users to export Universal Analytics data to BigQuery. However, the cost of this product makes it inaccessible for smaller organizations.
So, what about standard users? How do the rest of us export historical data?
I will show you three DIY methods and a few tools that can handle more complex requests.
1. Manual Export
The easiest way to export data is to get it directly from your Google Analytics account.
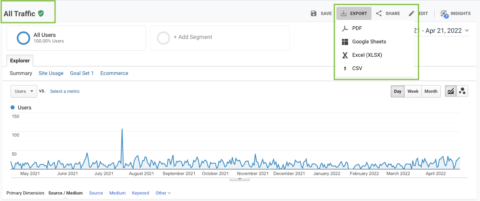
Open the GA standard report you want to keep. For example Acquisition > All Traffic > Source/Medium.
Set any customizations you want, such as a segment for a particular country, a filter for a particular page grouping, or a secondary dimension for landing pages.
Click EXPORT in the top right corner.
Select the file format from the drop-down menu. You can choose PDF, Google Sheets, Excel (xlsv), or CSV.
Though this is the easiest way to export your historical data, there are limitations.
You can only apply two dimensions and are limited to a maximum of 5,000 rows.
If you are registering thousands of hits per day your data may be sampled.
Check for the green checkmark shield in the top left near the title of the report you’re viewing; this means your data is not sampled.
2. Google Analytics Dev Tools: Query Explorer
Google Analytics dev tools sound off-putting (and technical), but you are likely already familiar with one of the tools.
The Campaign URL Builder is commonly used to create UTM parameters for campaigns.
GA dev tools also have a query explorer.
This is an easy (and free) way to export data for non-technical users (yeah!).
Open Query Explorer and click the orange button, LOGIN.
Sign in to your Google Analytics account that has access to the property you are working on.
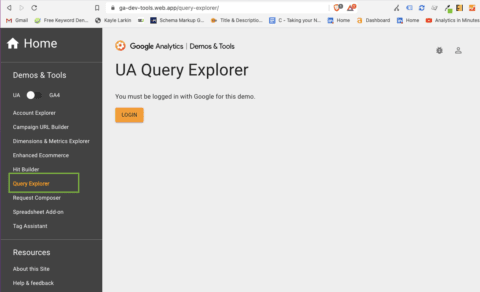 Screenshot from UA Query Explorer, April 2022
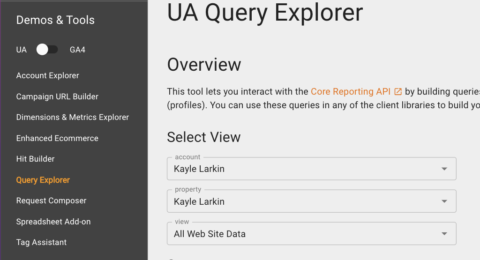
Select the account, property, and view you want to save data for.
The tool will automatically set the GA ID, so you don’t need to worry about that.
-
 Screenshot from UA Query Explorer, April 2022
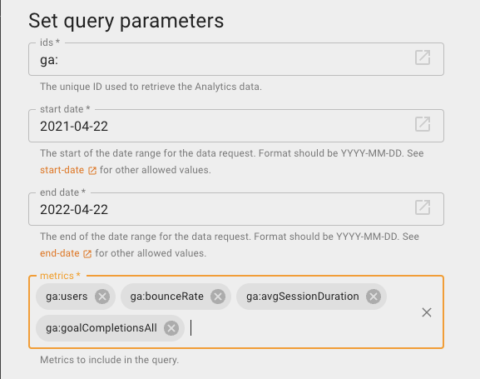
Set the remaining query parameters: Date range in the format YYYY-MM-DD, metrics, dimensions, and any filters or segments you would like to apply.
For metrics, select the columns from your Google Analytics report that you are extracting data from.
You can choose every metric in the report you want to replicate or just a few metrics that help achieve your goals like “Users,” “bounceRate,” “avgSessionsDuration” and “goalCompletionsAll.”
-
 Screenshot from UA Query Explorer, April 2022
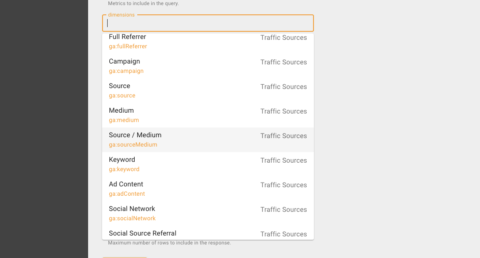
Dimensions will be the rows from the Google Analytics report from which we are exporting data.
For example, if we want to see metrics (users, bounce rate, duration, and goal completions) by traffic source select “ga:sourceMedium” as the dimension.
Note: If you plan to visualize this information in Data Studio, you will need to set the dimensions “ga:Medium” and “ga:Source” separately.
“ga:SourceMedium” does not work in Data Studio. More on visualizing to come.
- Screenshot from UA Query Explorer, April 2022
The rest of the query parameters are optional. I recommend leaving these blank in this use case to pull the max amount of data.
You can always sort, filter, and segment within your spreadsheet.
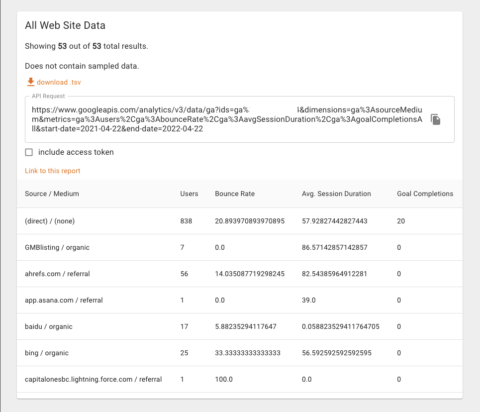
Scroll to the bottom and click the orange button RUN QUERY.
From here, download the data as .tsv (tab separated values) and open it in Excel or Google Sheets.
-
 Screenshot from UA Query Explorer, April 2022
Note: Notice the UA – GA4 toggle in the left-hand menu navigation. By clicking this toggle, you can access Query explorer for GA4 accounts.
3. Google Analytics Sheets Add-On
This option is a tad more complex but connects Google Analytics directly to Sheets, so you don’t have the extra steps of downloading and uploading.
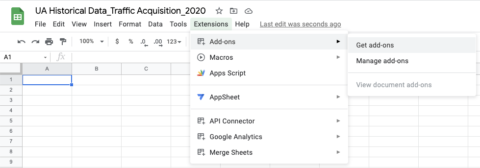
Create a folder in your Google Drive that will hold your historical data. Create a new Google Sheet and name something that will make sense for future team members, like “UA Historical Data_Traffic Acquisition_2021.”
Along the top menu navigation, click Extensions > Add-Ons > Get Add-Ons.
-
 Screenshot from Google Sheets, April 2022
Search for the Google Analytics app in the Google Workspace Marketplace. Click to install and follow the onscreen prompts.
-
 Screenshot from Google Workspace Marketplace, April 2022
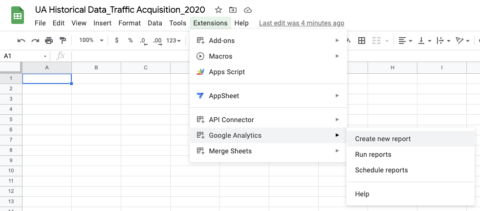
Back to your Google Sheet. Click Extensions again. This time you should see the app for Google Analytics.
Hover and click Create new report.
Now it’s time to export your historical data.
-
 Screenshot from Google Sheets, April 2022
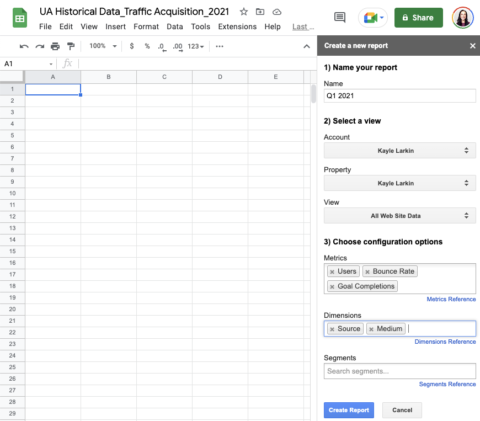
Step 1. Name your report something that makes sense for your fellow team members. For example, we will pull data by financial quarter, so report no. 1 will be named “Q1 2021.”
Step 2. Select the Analytics view you want to extract data from by choosing our Account, Property, and View.
Step 3. Configure report. Here we will choose our metrics, dimensions, and segments.
I am going to keep it simple for this example and choose “Users,” “Bounce Rate,” and “Goal Conversions” for my metrics and “source” and “medium” for my dimensions.
Note: ga:sourceMedium is not compatible with Data Studio. If you plan on visualizing this sheet, it is best to pull the traffic source dimensions separately like ga: Medium, ga:Source.
Leave Segments empty to see all users.
-
 Screenshot from Google Sheets, April 2022
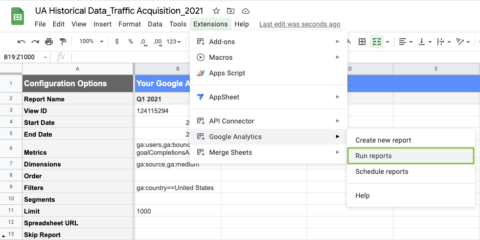
Clicking the blue button Create Report will lead you to configuration options.
There are more options to customize our report that are not available on the previous screen.
We can adjust the date range using the format YYYY-MM-DD.
We can apply filters like country, ga:country==United States.
Double-check that everything looks correct, then click Extensions > Google Analytics > Run reports to export your historical data.
 Screenshot from Google Sheets, April 2022
Note: Speed up this process by copying and pasting the configuration over to the next column, updating the date range, and running multiple reports simultaneously.
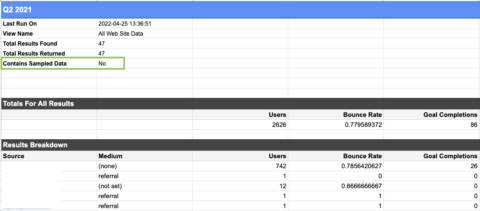
A report status popup will let you know if you’ve made any mistakes or once the report is completed successfully.
Row Number 6 will show us if the data is sampled or not. Row number 7 will tell us how much if the sheet contains sampled data.
-
 Screenshot from Google Sheets, April 2022
In Universal Analytics, data sampling happens after 500,000 sessions in the timeframe.
So, you can adjust your report data range to reduce the number of sessions in your timeframe.
Or, if you need the full dataset and want to skip the back and forth, use a third-party tool to avoid data sampling.
Third-Party Tools
Optimizesmart.com has a 46-step walkthrough of using Supermetrics for sending GA data to BigQuery.
On March 12, 2022, JR Oaks announced that they are working on releasing an open-source GA to BigQuery backup script/workflow to the public.
There are pre-built data pipelines by companies like Hevo and Electrik AI that export historical data from Google Analytics to a database file or data warehouse of your choice.
You may also consider switching to a paid Analytics provider.
A few have already launched a Google Analytics historical data import option.
Visualizing Historical Data With Data Studio
Now that you have pulled your historical data, you want to make something easy to compare to GA4.
Note: I have to forewarn you that attempting to compare UA and GA4 will be really rough because the data models are completely different.
Farina adds,
“Google intends for you to run GA4 side-by-side with UA and, instead of merging the data, just cut over to GA4 as soon as it has 13 months of historical data.”
Be assured that a lot of your hard-earned knowledge and skills carry over to GA4! Read, Getting started with GA4 to learn where to find site traffic, user engagement, events, and conversion reports.
Ok, back to visualizing historical data.
Follow these steps to create a Data Studio report that will stack a historical data table on top of a GA4 data table, so your YoY results are at least in one place.
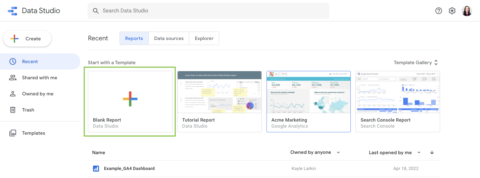
Open Data Studio and click to start a Blank Report.
-
 Screenshot from Google Data Studio, April 2022
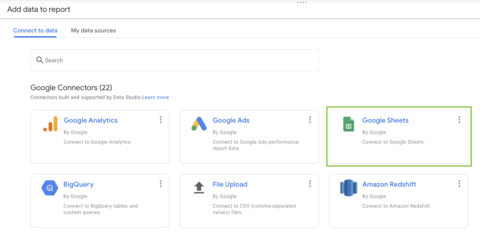
There will be an overlay screen to select the data source you want to connect. Select Google Sheets.
-
 Screenshot from Google Data Studio, April 2022
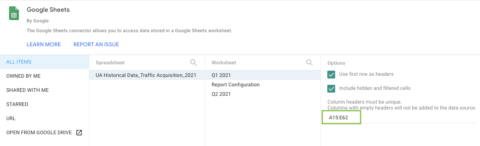
Locate the spreadsheet you made above when exporting your data. If you followed the steps exactly, it will be named “UA Historical Data _Traffic Acquisition_2021.”
Select the worksheet “Q1 2021.”
Using the first row as headers will automatically name your metrics and dimensions, so keep boxes both checked.
Select the optional range that matches your sheet.
For example, my headers start at A15, and the last number in my sheet is E62, so my range will be “A15:E62.”
-
 Screenshot from Google Data Studio, April 2022
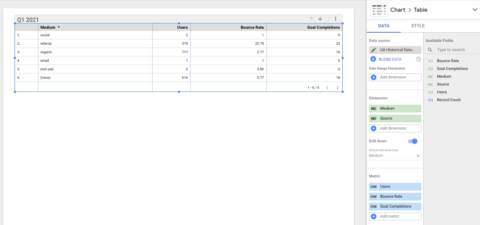
Data Studio will automatically create a table. Double-check that the configuration is the same as your sheet in the right-hand menu.
Medium is the primary dimension. Flip the toggle to add a secondary dimension of Source.
Metrics are Users, Bounce Rate, and Goal Completions.
Your historical data table will look similar to the screenshot below.
-
 Screenshot from Google Data Studio, April 2022
Next, we will create the same table but for our GA4 data in the same time frame: Q1 2022.
Right-click to copy and paste your table, then change the data source from UA Historical Data to your Google Analytics 4 account.
Because the metrics have different names, you will see an error – invalid metric.
Click on each metric and update it to something similar like “Total Users,” “Engagement Rate,” and “Conversions.”
Dimensions will update to “session/source” and “session/medium.”
Last, in the same menu, scroll down and set the date range so it matches your historical data: January 01 – January 31, 2022.
The final report will look similar to the screenshot below.
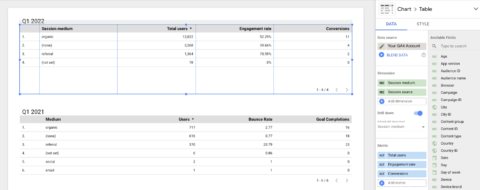
- Screenshot from Google Data Studio, April 2022
You can easily see primary metrics year over year by comparing historical data with GA4.
Although, it’s fairly bare-bones.
You can not blend this data because the definitions and calculations of the dimensions and metrics are fundamentally different.
For more robust historical reporting options, such as graphic users or goal completions over a period of time, you may want to consider BigQuery.
Final Thoughts
Unfortunately, migrating your data to GA4 is not currently possible (and not likely to come) because the two versions are fundamentally different data models.
There are a few DIY solutions for saving your historical data, but the outputs are fairly bare-bones.
If you need more robust information and reporting capabilities of historical data, look into a data warehouse like BigQuery.
Google hints that additional information on exporting historical data will come before the July 2023 end date.
Maybe that will be a data connector for BigQuery for Google Analytics standard users – one can hope.
More resources:
- Learn GA4: 17 Top Guides & Educational Resources
- Getting Started With GA4: These 4 Tips Will Get You Up & Running
- SEO Strategy: A Full Year Blueprint (+Template)
Featured Image: Paulo Bobita
